Healthcare Analytics, Reimagined.
Accelerate data-driven decisions by unifying EHR, claims, and operational data—cut readmissions, optimize resources, and elevate the patient experience with conversational insights.

Insights Meet Action
Unify internal and external data, surface AI-powered insights, and turn confident, data-driven decisions into action—without complexity.
Break Data Silos, Unlock Healthcare Insights
Easily merge internal clinical, operational, and financial data with external sources—such as public health data. Uncover hidden opportunities, optimize care delivery strategies, and empower smarter, data-driven decisions across your healthcare organization

Instant Answers, Faster Results
Ask and answer any healthcare operational question in a self-service conversational manner, empowering every team to explore data, uncover insights, and make confident decisions—no SQL or analyst backlogs required.

Turn Complex Data into Clear Actions
Leverage advanced AI and dynamic storytelling to transform volumes of healthcare data into actionable insights. Tellius automatically surfaces key drivers, trends, and anomalies, translating complex analytics into concise narratives that support patient-centered care and operational efficiency

A Squad of Agents by Your Side -- 24/7
AI-powered agents leverage RAG and a robust Knowledge Layer to deliver real-time insights, automate complex analysis, and enhance decision-making across your healthcare ecosystem—instantly.

Use Cases
Optimize Predictive Staffing
Ensure the right staff is in the right place at the right time. Forecast staffing needs with precision to match patient volumes and improve operational efficiency.
Improve Patient Flow
Identify bottlenecks and optimize patient movement for seamless hospital operations.

Claims & Billing Analysis
Ensure compliance, identify underpayments, improve reimbursement rates , and rapidly uncover drivers to streamline billing workflows, reduce overhead, and boost revenue.
Cost & Performance Analytics
Pinpoint areas for cost reduction and performance improvement across departments, specialties, and service lines. ( e.g. improve patient care quality and save millions of dollars by identifying the true cost of procedures)

Reduce Hospital Readmissions
Identify root causes of readmissions and predict at-risk patients, then implement targeted interventions to improve outcomes and reduce penalties.
Improving Hospital-Acquired Conditions (HACs)
Identify risks, monitor outcomes, and ensure patient safety to meet quality standards.

Identifying High-Risk Patients
Predict at-risk populations and drive targeted interventions to improve care outcomes and reduce costs.
Personalized Outreach & Care
Segment patient populations by risk profile, health history, and demographic data to tailor preventive care and post-discharge follow-ups.


Transform Healthcare Analytics with AI-Driven Intelligence
Harness the power of AI to unify data, uncover critical insights, and drive smarter decisions across patient care, operations, and financial performance.

Turn Healthcare Insights into Actionable Impact
Unify clinical, operational, and financial data with AI-powered insights that drive real-world improvements in patient care, financial performance, and operational efficiency—turning complex data into smarter actions.

Unleash the full power of data
to insights

Breakthrough Ideas, Right at Your Fingertips
Dig into our latest guides, webinars, whitepapers, and best practices that help you leverage data for tangible, scalable results.
.png)
Best HCP Engagement Platforms for Pharma in 2026: 12 Compared Across Orchestration, Activation, and Closed-Loop Measurement
Healthcare professional (HCP) engagement is becoming increasingly complex as pharma organizations navigate more channels, more data, and growing expectations for personalized experiences. This guide compares 12 leading HCP engagement platforms across the capabilities that matter most in 2026, including engagement orchestration, next-best-action decisioning, omnichannel activation, CRM integration, AI-powered personalization, and closed-loop measurement.
Nucleus Research Names Tellius an Accelerator in the 2026 BI and Analytics Technology Value Matrix — and Why Depth Is About to Become the New Functionality
Nucleus Research recently recognized Tellius as an Accelerator in the 2026 BI & Analytics Technology Value Matrix, highlighting a broader shift occurring across the analytics industry. As generative AI makes chart creation, dashboards, and basic data exploration increasingly commoditized, enterprises are beginning to evaluate platforms on a new dimension: depth. This blog explores why reasoning depth, semantic understanding, governed AI, agentic workflows, and autonomous investigation are becoming more important than surface-level functionality alone. It examines how the market is evolving beyond traditional self-service BI toward systems that can understand business context, investigate root causes, connect structured and unstructured data, and help organizations move from insight generation to operational action.
.png)
Tellius Kaiya vs. Glean, Hebbia, Snowflake Cortex, and DIY RAG: A Buyer's Guide to Agentic Analytics Across Structured and Unstructured Data
This buyer's guide compares Tellius Kaiya, Glean, Hebbia, Snowflake Cortex, and DIY RAG approaches across structured analytics, unstructured document intelligence, agent orchestration, governance, semantic understanding, explainability, and total cost of ownership. Learn where enterprise search tools excel, where warehouse-native AI fits, where custom RAG stacks create maintenance challenges, and why a dedicated agentic analytics platform may be the best choice for organizations looking to automate investigation, root-cause analysis, and decision-making across both structured and unstructured data.

.png)
.png)
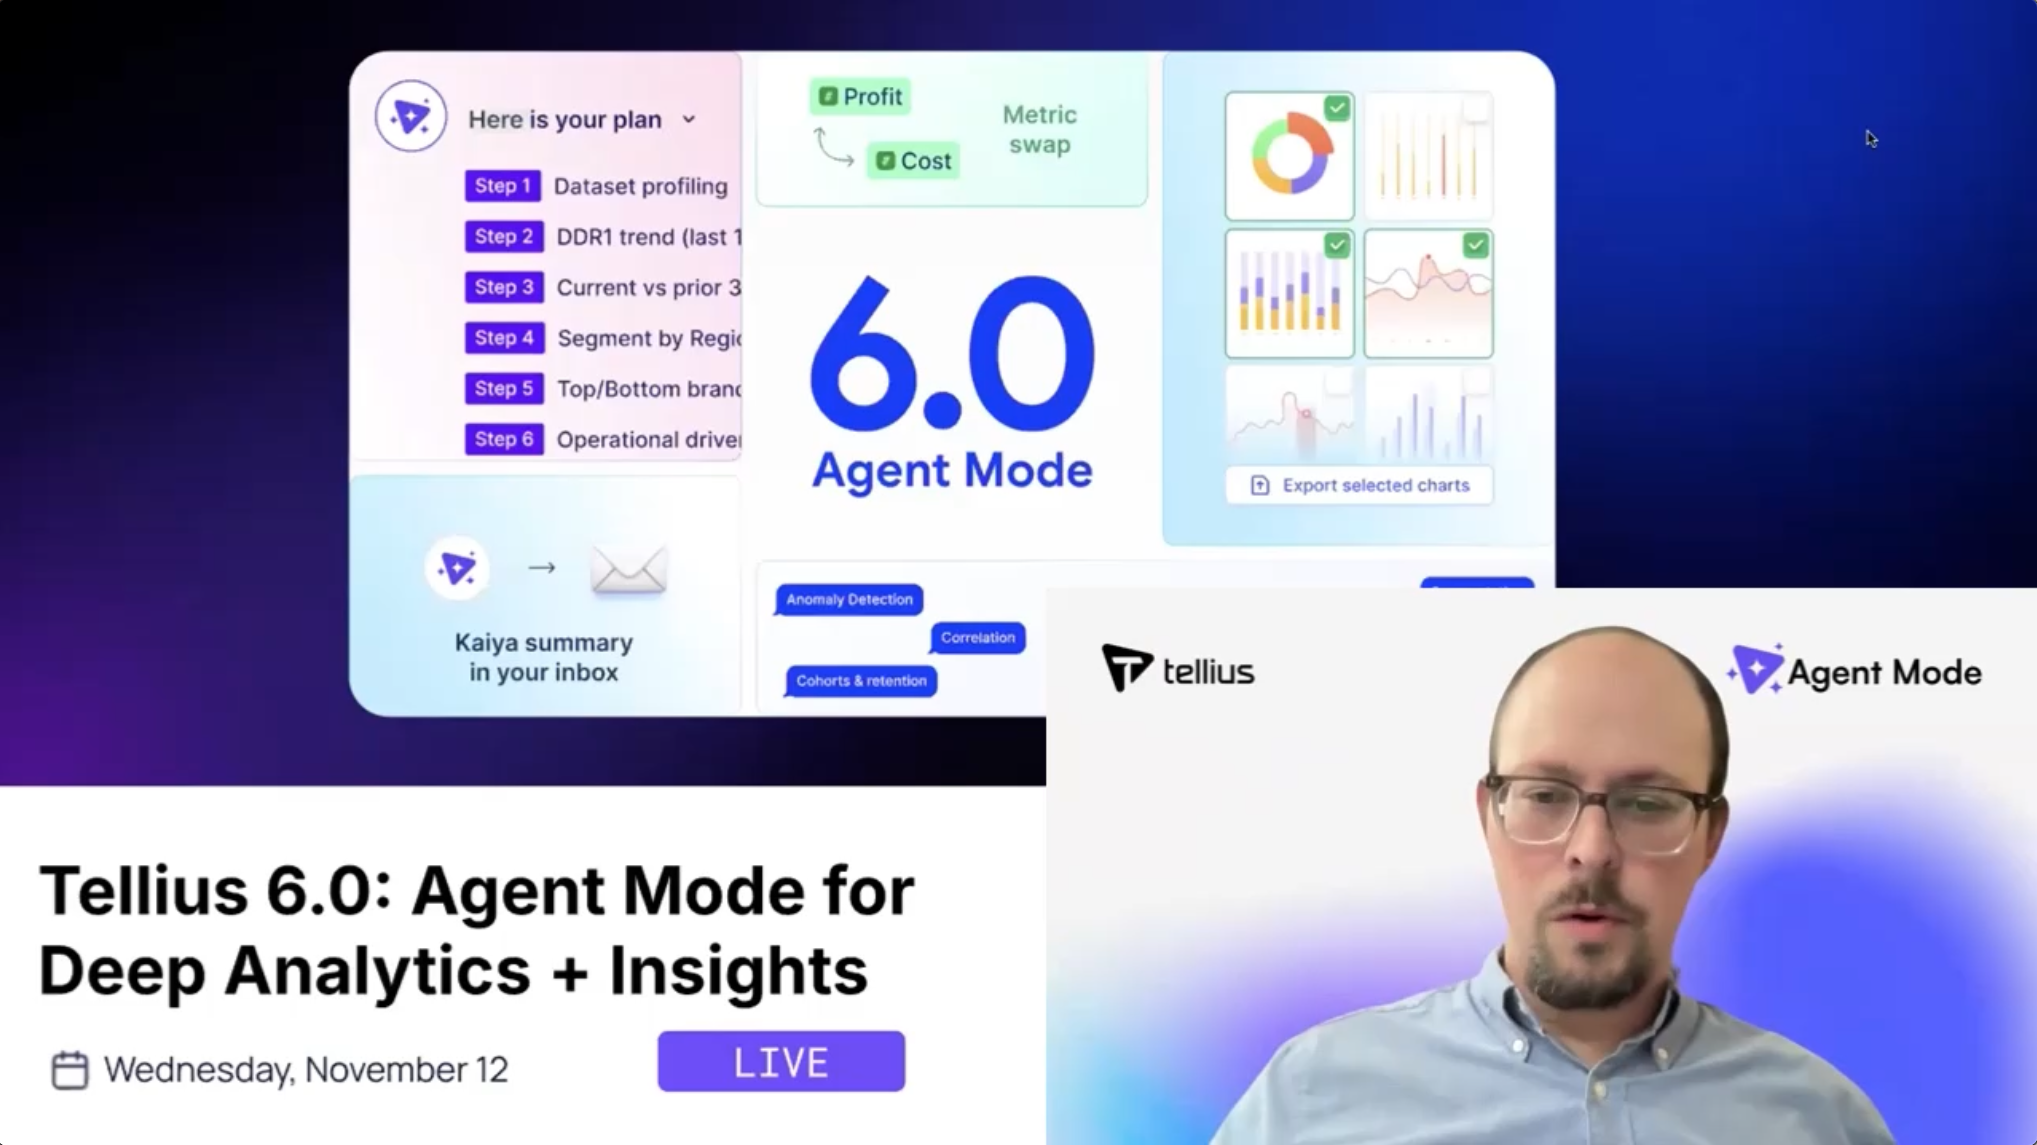
Tellius AI Agents: Driving Real Analysis, Action, + Enterprise Intelligence
Tellius AI Agents transform business intelligence with dedicated AI squads that automate complex analysis workflows without coding. Join our April 17th webinar to discover how these agents can 100x enterprise productivity by turning questions into actionable insights, adapting to your unique business processes, and driving decisions with trustworthy, explainable intelligence.
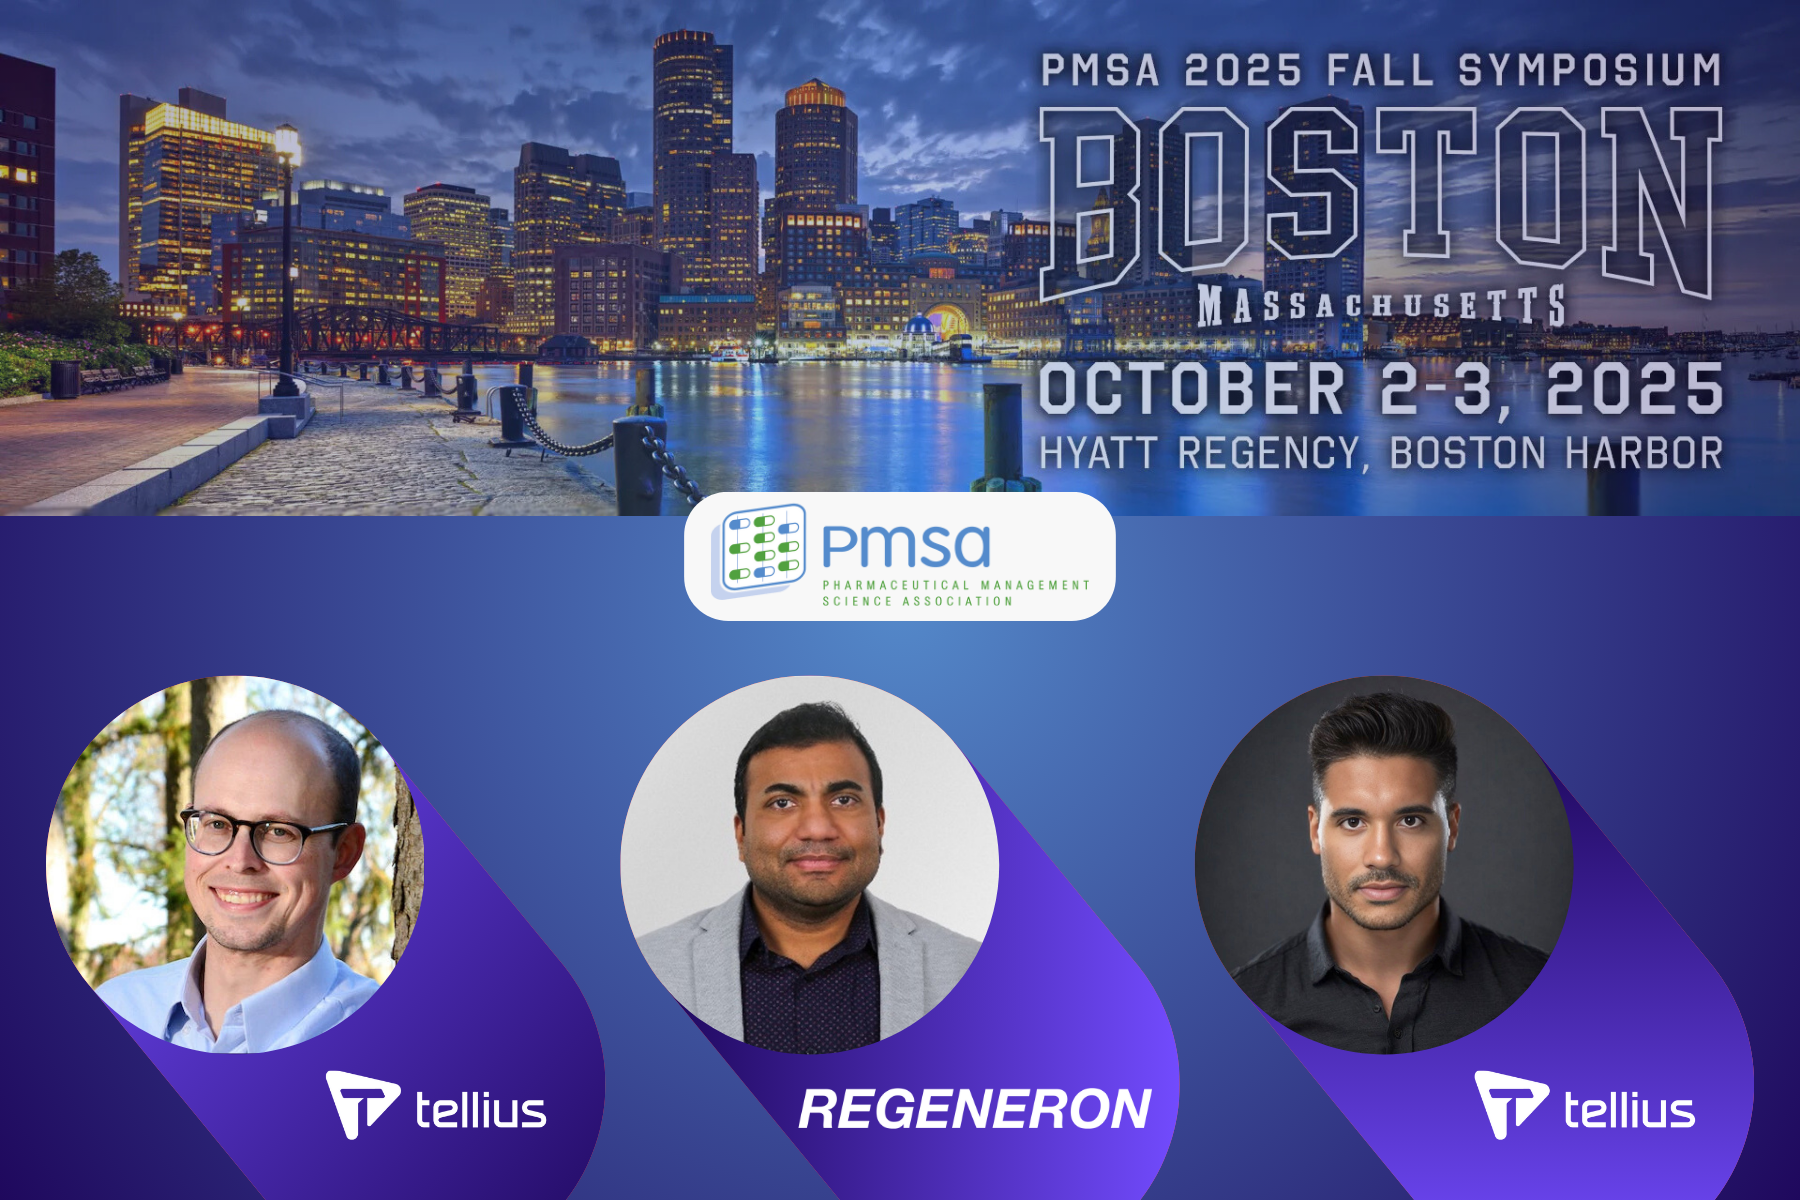
PMSA Fall Symposium 2025 in Boston
Join Tellius at PMSA Oct 2–3 for two can’t-miss sessions: Regeneron on how they’re scaling GenAI across the pharma brand lifecycle, and a hands-on workshop on AI Agents for sales, HCP targeting, and access wins. Discover how AI-powered analytics drives commercial success.