

Payer contract analytics: how to size a formulary deal and prove pull-through

A practical method for connecting the pre-deal rebate case with the post-deal result, so the next contract inherits evidence instead of last year's assumptions.
Payer contract analytics is how pharmaceutical manufacturers value a proposed payer agreement, measure whether the purchased access produced incremental prescriptions and net revenue, and use the measured result to improve the next contract. Unlike aggregate GTN forecasting or rebate adjudication, it follows one access trade from approval through pull-through.
Drug manufacturers gave up an estimated $416 billion in gross-to-net reductions on brand drugs in 2025. Inside a manufacturer, the team forecasting that net number often sits apart from the team making the payer contract decisions that move it.
In a de-identified Tellius customer conversation, a head of pricing and contracting at a rare disease manufacturer described the handoff this way: "If gross didn't change, but net did ... a lot of that comes from market access."
Most teams have a contract model, a rebate system, a forecast, and payer performance reports. Those controls answer different parts of the problem. The model supports approval. The rebate system applies the signed terms. The report shows what happened months later. The approved assumptions and the measured result seldom meet again.
That break matters because a formulary contract is a forecast with a price attached. If the manufacturer never scores the forecast, next year's negotiation inherits the same untested assumptions about payer control, script lift, utilization management, and effective rebate rate.
What payer contract analytics means
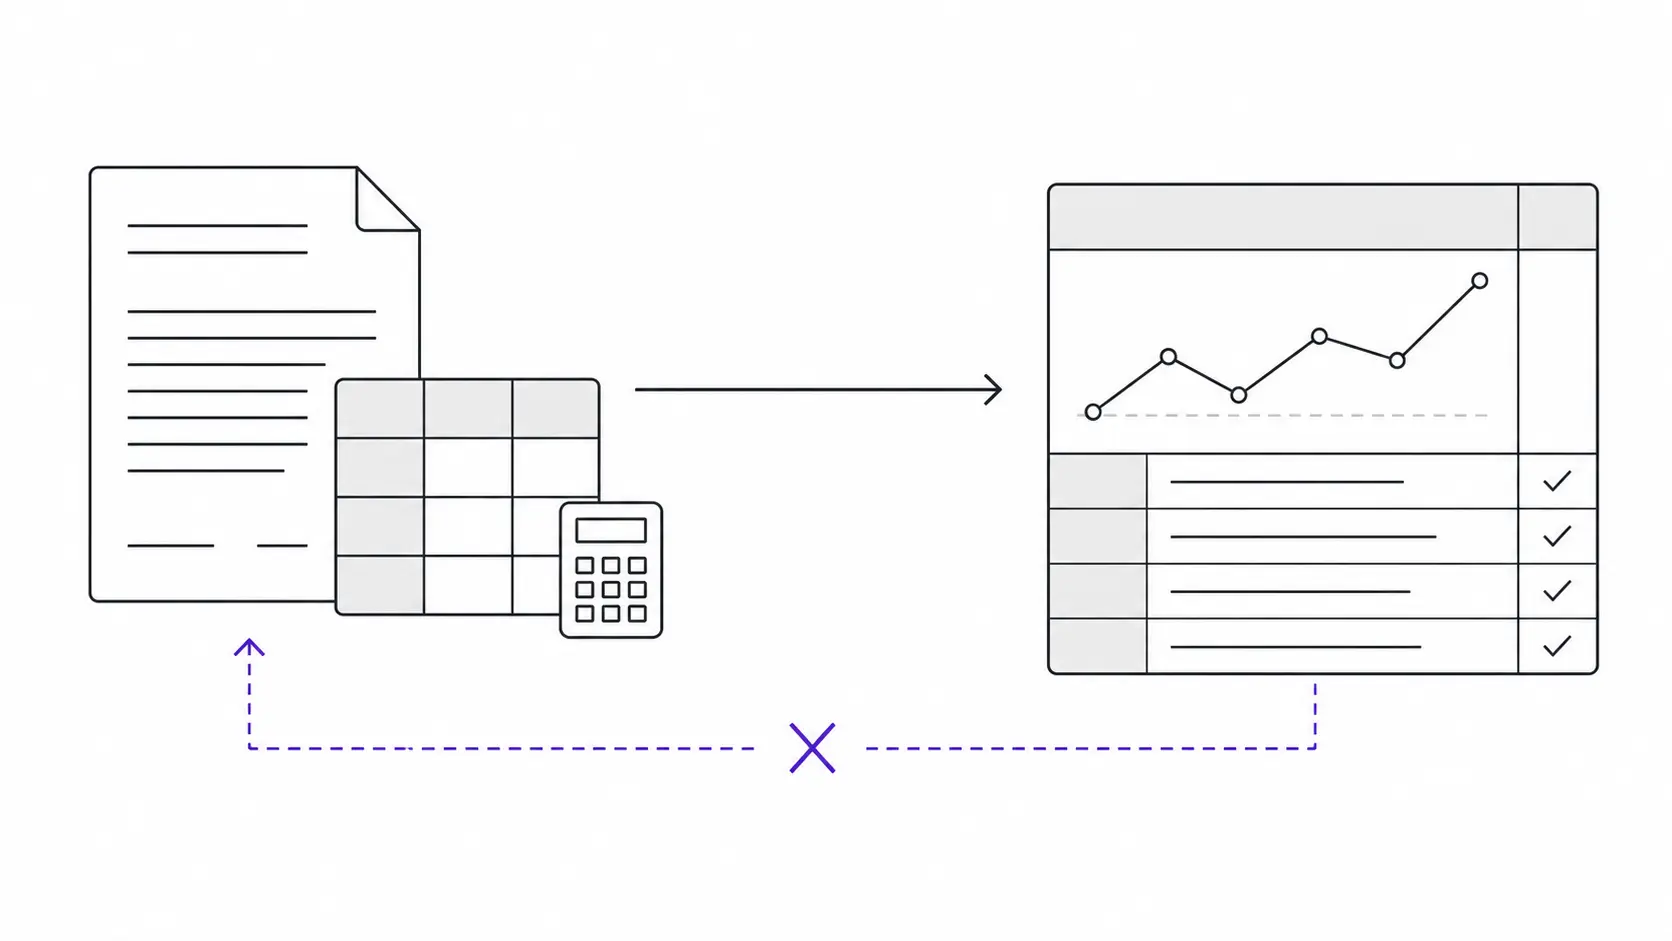
The method connects pre-deal valuation with post-deal pull-through. A complete operating loop has four stages:
The four stages also define the recurring job an AI worker can run: repeat the method, preserve the context, and deliver the scorecard while the team retains contract authority.
Teams tend to run the first and third rows in different files. Closing the loop requires enough preserved context to compare the deal that was approved with the deal that occurred.
Build the pre-deal model around access behavior
Covered lives and rebate math are a reasonable starting point. They remain useful when formulary position predicts what patients can fill. The model becomes unreliable when it treats a tier move as the whole access change.
A defensible contract case retains the following inputs:
- the current and proposed formulary position by plan and line of business;
- prior authorization, step therapy, quantity limits, specialty pharmacy rules, and other restrictions before and after the deal;
- eligible lives and the manufacturer's current TRx, NRx, share, and rejection profile;
- the payer's ability to enforce restrictions, based on claims behavior rather than formulary wording alone;
- comparable access changes at similar plans, with enough detail to explain why each analog belongs in the set;
- base rebate, incremental rebate, administrative fees, price protection, guarantees, exclusions, eligibility rules, and government pricing exposure;
- the lag between the access effective date and the point when a prescribing or fulfillment response should appear;
- scenario assumptions, uncertainty ranges, and the person who approved them.
IQVIA describes payer control through two separate measures: the payer's willingness to manage utilization, visible in formulary design, and its ability to do so, visible in claims and durable rejection behavior. That distinction improves contract valuation because a strict policy with weak enforcement behaves differently from the same policy at a plan that blocks most nonpreferred starts. (IQVIA)
The same distinction showed up in a recent manufacturer conversation. The team wanted to compare payers where restrictions exist but claims still go through with payers where those restrictions change utilization. The restriction label alone could not answer the contract question.
Another market access team put the pre-deal question in operational terms: if the manufacturer offered a rebate for relief from a step edit, what would the impact be on patient volume and TRx? A separate manufacturer needed to compare doing nothing, renegotiating, and offering a partial rebate after a product transition changed what one payer would earn. Each scenario supported a near-term contracting decision rather than a general payer report.
A worked formulary contract example
Consider a hypothetical brand with 24,000 annual TRx inside one payer's commercial book of business. The current deal carries a 20% rebate against a $2,000 list price, leaving $1,600 in net revenue per TRx before other deductions. The payer offers a tier improvement and step-edit relief for a five-point increase in the rebate.
Comparable payer events suggest a 4% to 10% volume lift, with 7% as the approved planning case.
The break-even calculation is:
Break-even lift = current net revenue per TRx / proposed net revenue per TRx - 1
In this case, $1,600 / $1,500 - 1 = 6.7%. The five rebate points apply to baseline volume as well as the incremental scripts, so a contract can produce more TRx and less net revenue. Administrative fees, patient support exposure, price protection, and channel effects would move the break-even point further. A deeper commercial rebate can also reset Medicaid best price. If the proposed 25% becomes the lowest commercial price, the added rebate cost repeats across the Medicaid channel and lowers the 340B ceiling price.
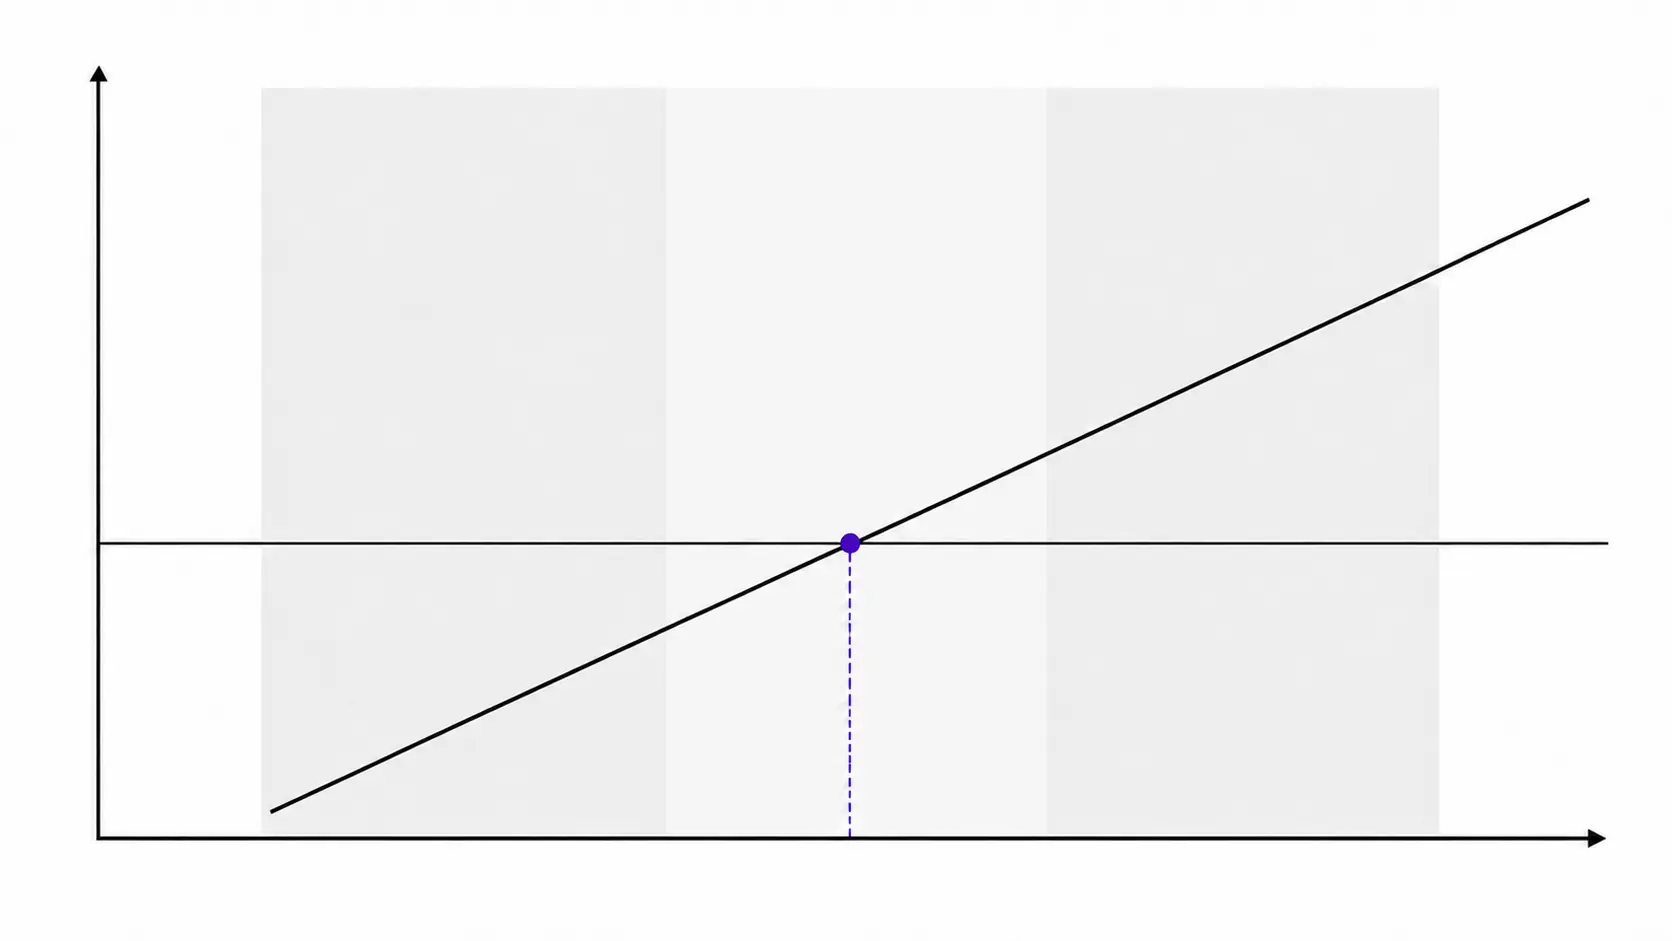
This is illustrative math, not an industry benchmark. Its purpose is to show what the approval committee should be able to reconstruct later. The team should retain the 7% expected lift, the analogs behind it, the planned access change, the assumed effective date, and the 6.7% break-even point. A single approved revenue number is not enough to score the deal.
Rebate depth and realized access do not move together
A better tier can arrive with utilization management that limits the gain. The payer may remove a double step edit but retain prior authorization. A preferred position may apply to only part of the book. A policy update may reach the formulary file before it reaches adjudication. Prescribers and specialty pharmacies may continue operating from the old rule for several weeks.
The contract model should separate the access event into components:
The manufacturer is paying for a bundle of position, policy, enforcement, and reach. If one part moves in the wrong direction, realized lift can fall below the lift attached to the tier label even as rebate spend rises.
The 2026 formulary cycle adds another complication. The largest PBMs still use exclusions in negotiations, but their formularies increasingly include low-list-price and PBM-affiliated biosimilars alongside the traditional rebate model. Drug Channels found more than 600 products excluded from each of the three largest PBMs' 2026 national formularies. (Drug Channels) Historical rebate-for-tier analogs need closer review when the competitive set and pricing model have changed.
Join the data at the grain of the decision
The answer to a contract question is spread across systems that do not line up:
A contract may live at account and agreement level while a formulary record lives at plan level and a claim lives at transaction level. Payer names, plan identifiers, product hierarchies, and effective dates differ. Joining at the wrong level can duplicate utilization or attach a rebate rate to ineligible claims.
In another de-identified manufacturer conversation, an analytics lead described the manual version: people "don't always remember the selection criteria exactly," so they miss a filter and "the numbers will not be proper." That is a governance problem with a financial consequence. Two analysts can follow defensible logic and still produce different contract values because each reconstructed the cohort from memory.
The model should save the cohort definition with the result. That includes payer and plan IDs, products, channels, dates, eligibility filters, exclusions, and join logic. Every figure in the approval case and pull-through scorecard should trace back to those selections.
Only 1% of life sciences revenue leaders in Model N's 2026 survey reported real-time visibility across Medicaid and Medicare rebates, 340B discounts, and utilization rebates. Fewer than 30% reported fully integrated GTN data across pricing and reimbursement programs. (Model N) A monthly decision process should account for data lag and restatements instead of presenting a provisional result as final.
Preserve the approval case
The approved contract should carry an assumption register into measurement. At minimum, save:
- the model version and approval date;
- affected payers, plans, products, channels, and lives;
- current and purchased access, including restriction changes;
- expected effective date and measurement lag;
- baseline period, analog set, and control cohort;
- expected TRx and NRx lift, with low and high cases;
- base and incremental rebate, fees, expected effective rebate rate, and break-even lift;
- expected net revenue change;
- known competitor, policy, supply, or field events that could confound the read;
- the owner responsible for the first post-deal review.
This register is the contract between the model and the future scorecard. It gives a scheduled AI worker the approved context to apply on later runs. Without it, the post-deal team has to infer what the committee believed from a spreadsheet that has since changed.
Measure pull-through against a credible counterfactual
A pre-and-post chart can show that scripts rose after an access change. It cannot show that the contract caused the rise. Market growth, seasonality, a competitor shortage, a field push, or a guideline update can move the same number.
A practical measurement can start with matched controls:
- Select plans that resembled the contracted plan before the change. Match on line of business, baseline share, script trend, restriction profile, and competitive set.
- Check that the contracted and matched plans moved similarly before the change. If their trends were already separating, choose a better comparison set or narrow the claim.
- Set an implementation window and a mature measurement window. A formulary file update, claim adjudication, prescriber awareness, and refill behavior do not change on the same day.
- Measure the change in TRx, NRx, rejection, approval, and time to therapy for the contracted plan.
- Measure the same change across the matched plans that did not receive the access improvement.
- Subtract the control change from the contracted-plan change, then test whether field activity, supply, or another event explains the remaining gap.
If TRx at the contracted plan rises 9% while matched plans rise 4%, the first estimate of contract pull-through is five percentage points. It remains an estimate. The team should check whether the affected territories received more calls or account activity, whether a competitor changed access, and whether the formulary change reached all intended lives on schedule.
This method is often called difference-in-differences. The name matters less than the discipline: compare the change with the deal against the change you would have expected without it.
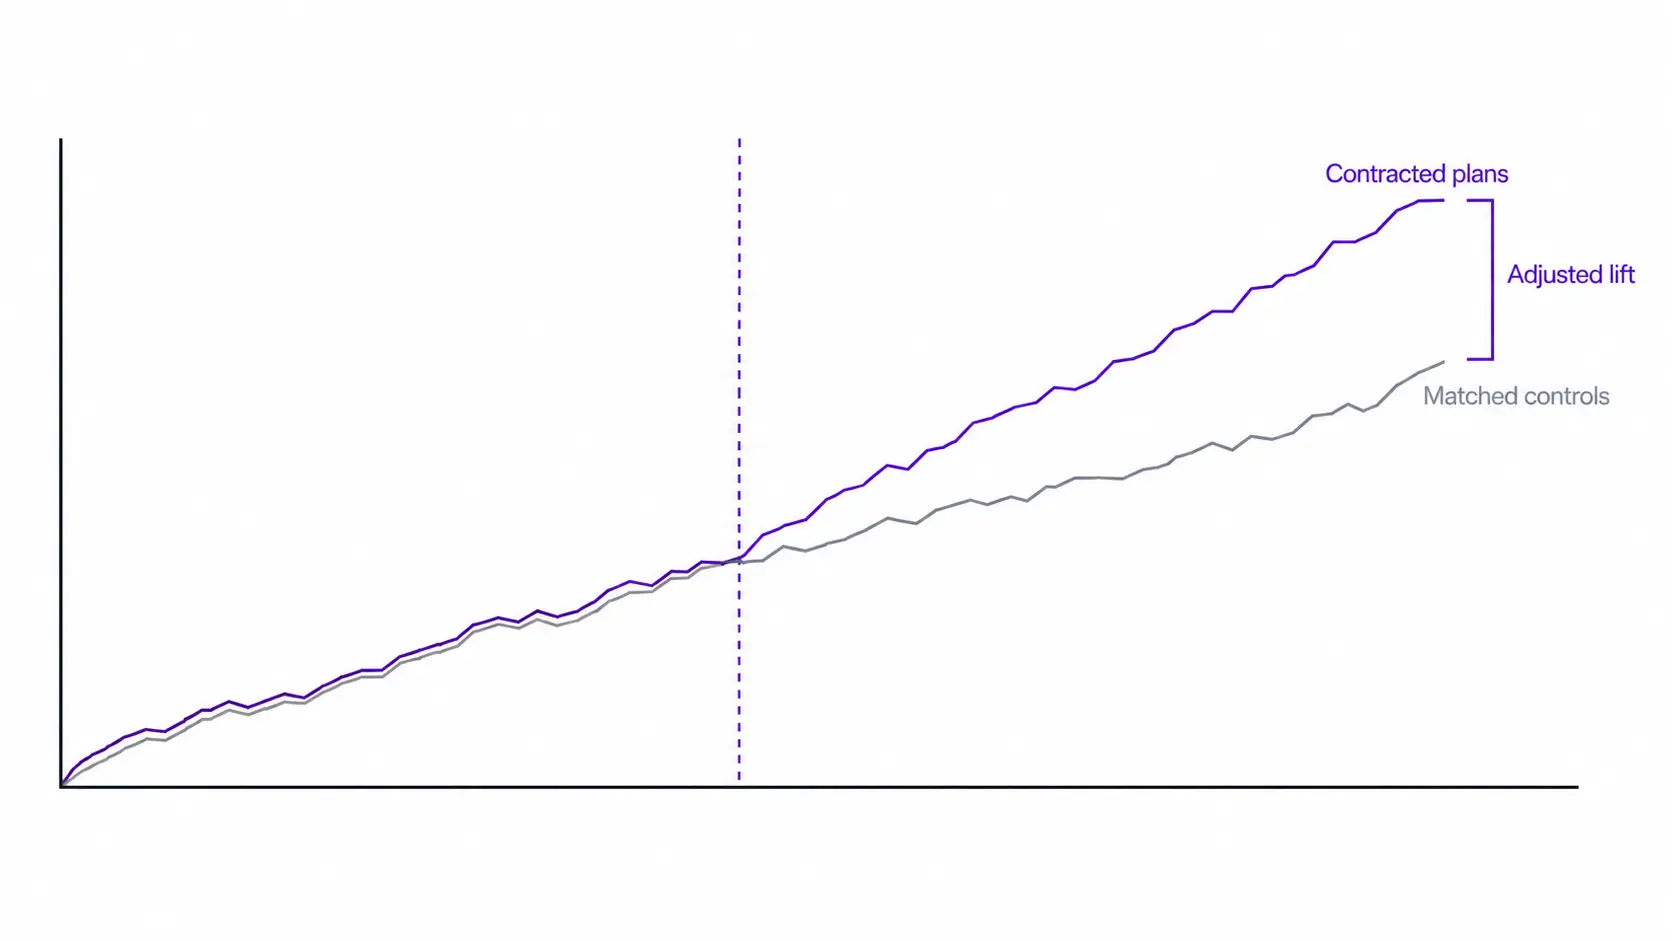
Use the same net economics from the approval case. Applying the 5-point adjusted lift to the baseline gives 25,200 TRx and $37.80 million in net revenue, which lands $600,000 below the current contract before other deductions. A stricter counterfactual widens the gap. The 4% the matched plans grew would have come at the old rebate, so the comparison becomes 24,960 TRx at $1,600 against the contracted plans' actual 26,160 at $1,500, or about $700,000. Calling that deal a win because TRx rose would teach the next model the wrong lesson.
Turn the scorecard into an intervention
A monthly scorecard is more useful than a quarterly chart because it tells the owner where the approved case is breaking while there is time to respond.
The scorecard should run on the cadence of the recoverable action. A policy implementation issue may support a payer discussion. Weak field pull-through may change account messaging. An eligibility or fee variance may require contract operations. A sizing assumption that was wrong will not rescue the signed deal, but it should change the next one.
Calibrate the next contract
The measured deal should enter an analog library with the context needed to reuse it: plan type, access before and after, restrictions, baseline share, enforcement profile, expected lift, observed adjusted lift, expected and realized effective rebate rate, lag, confounders, and review status.
An expert should approve the correction before it becomes a shared rule. A rare disease plan with low baseline volume should not silently reset the default for a mass-market brand. A commercial analog should not flow into Part D because both records use the same payer parent.
The next contract model can use observed lift for a payer and restriction pattern instead of a generic estimate. It can widen the uncertainty range where prior deals were volatile. It can price a longer implementation lag into the cash-flow case. It can exclude an analog whose apparent lift came from a competitor shortage.
The organization does not need autonomous decision memory to start. A governed analog library, a versioned assumption register, and approved correction rules close most of the operating gap. They also create the foundation for decision outcomes to compound when governed decision memory becomes available.
How an AI worker runs the payer contract loop
The loop is recurring work: assemble the cohort, apply approved assumptions, calculate scenarios, preserve the decision case, monitor the outcome, explain the variance, and draft the scorecard. That makes it a fit for an AI worker, provided calculations remain governed and pricing, contracting, market access, and finance leaders retain the decision.
Tellius's AI worker, Kaiya, runs this work as scheduled Missions on top of the manufacturer's existing systems. The 60-second example below follows a contracting director through the same workflow as the worked scenario: size the renewal of a five-point trade that lapsed at the end of its term, score how that deal performed against its approved case, and deliver a sourced payer review brief.
Four parts come together
A contracting opportunity sizer can return low, planning, and high cases with the break-even point and source lineage. An access-change pull-through Mission can compare the result with the approved case, test the drivers, and deliver the finished scorecard or payer review brief.
In the worked example, the finished brief would not stop at "TRx increased 5%." It would report that adjusted lift missed the 6.7% break-even point, net revenue trailed the current contract by $600,000 before other deductions, and the next review should test whether the promised step-edit relief reached the intended lives. The AI worker assembles the evidence and the brief. The contracting leader decides what to do with it.
That output choice matters. In one recent demo, the pricing and contracting leader singled out the GTN brief as useful. The chart helped inspect the result, but the brief was the work the team could carry into a review.
The deterministic calculation layer keeps contract math consistent across runs. Governed definitions and expert-approved corrections persist only at the scope where they are valid. Start with the Mission explains how the objective, cadence, sources, and finished output are defined before the work runs.
Tellius complements the systems already in place. Rebate and government-pricing systems such as Model N adjudicate obligations. Net-revenue platforms such as IntegriChain organize the data. Planning tools such as Anaplan manage the forward GTN forecast. Payer data platforms supply formulary and policy intelligence. The contract loop depends on those systems, then adds the recurring work that reconciles the approved decision with the measured result.
Key payer contract analytics terms
Payer contract analytics checklist
- Can the team reconstruct the exact access bundle the rebate purchased, including restrictions and affected lives?
- Does the approved model retain its analogs, cohort, expected lift, lag, effective rebate rate, and break-even point?
- Can every figure trace to the source, grain, filter, and version used?
- Does post-deal measurement compare performance with a credible control rather than a pre-and-post chart alone?
- Does the scorecard separate access implementation, field pull-through, patient friction, and contract economics?
- Is there a named owner and cadence for intervention?
- Does the measured error become an expert-approved input to the next model?
A team that can answer those questions can tell whether a formulary contract created incremental net value. It can also explain why a deal missed without turning the review into a defense of the original forecast.
See the contract loop on your data
Bring one approved contract model and the payer, formulary, claims, and rebate data that followed it. Tellius can run the opportunity case and pull-through scorecard against the same assumptions, with each number traced to its source.
Get release updates delivered straight to your inbox.
No spam—we hate it as much as you do!


Payer contract analytics is the process a pharmaceutical manufacturer uses to value a proposed payer agreement, measure whether the purchased access produced incremental prescriptions and net revenue, and improve future contract assumptions with the measured result. It connects pre-deal scenario modeling with post-deal pull-through.
Pharma companies value a formulary contract by estimating the incremental prescriptions and net revenue created by a specific access change, then comparing that value with rebates, fees, guarantees, and other deductions. A defensible model includes utilization management, payer enforcement, eligible lives, comparable payer events, uncertainty ranges, and a break-even lift.
Measure contract pull-through by comparing the change in TRx, NRx, rejection, approval, and net revenue at the contracted plan with matched plans that did not receive the same access change. Then test the adjusted difference for field activity, competitor events, supply, policy timing, and other causes.
Net revenue can fall while gross revenue is flat when the deduction mix changes. A higher effective rebate rate, more utilization in heavily rebated plans, administrative fees, government-program exposure, or access decisions can reduce what the manufacturer keeps even when gross sales do not move.
GTN forecasting estimates aggregate deductions, net revenue, accruals, and reserves. Rebate management calculates and adjudicates obligations under signed agreements. Payer contract analytics evaluates whether a specific access trade is worth its price and whether the signed deal delivered the expected pull-through. The three disciplines share data and should reconcile, but they produce different work.
The best payer contract analytics platform can join claims, formulary, contract, rebate, finance, and field data at the grain of the decision; preserve the approved assumptions; measure pull-through against a credible control; trace every number; and deliver a recurring scorecard or payer review brief. Tellius fits manufacturers that want an AI worker to run that cross-source loop while experts retain contract authority. It complements rebate adjudication and GTN planning systems rather than replacing them.
Spend Intelligence vs. Process Mining: How Companies Recover Millions Their Controls Approved

Process mining and spend intelligence solve different problems, but they're often evaluated as if they compete. This guide explains why they are complementary technologies and when organizations need one, the other, or both. Learn how process mining platforms reconstruct procurement workflows from event logs to identify bottlenecks, compliance issues, and operational inefficiencies, while AI-powered spend intelligence validates every invoice against contracts to uncover overbilling, duplicate payments, off-contract spend, pricing errors, and unclaimed rebates that process mining cannot detect.
.webp)
Best AI Procurement Software in 2026: Spend Intelligence & Value Recovery Compared
This buyer's guide compares the leading AI procurement software platforms in 2026, evaluating how they help organizations transform procurement from a transactional function into a strategic driver of business value. The guide examines capabilities across spend intelligence, supplier performance analytics, contract and purchasing insights, sourcing optimization, risk monitoring, invoice and payment analysis, and value recovery. It also compares AI-native procurement platforms, source-to-pay suites, and analytics-first solutions, highlighting where each approach excels depending on an organization's procurement maturity and technology landscape.