Market Access Analytics: See Access Problems Before They Touch TRx
Market access analytics breaks when plans change faster than your tools can track. Step edits appear overnight, rebate contracts shift mid-year, and PA approval rates collapse in specific regions. But most teams don't know until the quarterly claims dump arrives. Access leaders need real-time visibility into formulary positioning, payer mix impacts, and where coverage restrictions are quietly bleeding scripts. This page addresses the questions commercial, access, and payer strategy teams ask when they need answers measured in hours, not quarters.
What is Market Access Analytics?
Market access analytics is an AI-powered approach that unifies formulary intelligence, claims, hub services, and specialty pharmacy data to help pharma commercial teams understand payer performance, detect access barriers, and act before restrictions impact prescriptions.
Unlike quarterly claims reports that show damage after the fact, market access analytics provides real-time visibility into PA approval rates, step therapy enforcement, denial patterns, and time-to-therapy by payer. It connects coverage status to actual pull-through, so teams know which payers drive real scripts, not just covered lives.
Tellius is a market access analytics platform purpose-built for pharma. It combines payer-level performance views, automated root cause analysis on access barriers, and agentic workflows that flag early risk signals and generate pull-through actions. Market access analytics works alongside conversational analytics for instant answers and agentic analytics for continuous payer monitoring.
The Problem
Market access teams lack visibility into cause, impact, and pull-through
Disconnected access signals make it hard to see which payer decisions matter, how they affect prescriptions, and where teams should act next.
By the time claims data arrives, the damage is done

Payer policies change faster than most analytics can track. Formulary exclusions, step-therapy rules, and PA criteria can shift mid-quarter, so teams see the damage after share already moves.
Prior authorization friction stays invisible until scripts are lost. Most teams can’t pinpoint whether the failures came from missing documentation, clinical criteria mismatches, or payer-specific admin rules—because hub, SP, and claims data don’t line up.
"Covered lives" is a vanity metric when it doesn’t equal pull-through. Two plans can look identical on paper, but approvals, step edits, cost share, and time-to-therapy can differ enough to change real volume
Gross-to-net and contracting scenarios still run on fragile spreadsheets, and IRA-driven complexity makes models harder to audit and harder to change quickly.
When access improves, field and brand teams often can’t act fast enough because insights don’t land in workflows where pull-through happens.

How to see access problems before they touch TRx

Live policy and UM tracking: Detect and flag formulary, prior authorization, and step-therapy changes quickly, so you can respond before the impact shows up in TRx.
Plan-level performance: Combine coverage, approval rates, time-to-therapy, and NBRx/TRx by plan in one view, so you can see which payers drive real volume.
Root-cause on denials and abandonment: Surface the top denial and abandonment drivers by payer and criteria, so the issue fixes are targeted.
Scenario modeling with governed logic: Model contracting and IRA impacts using consistent, auditable definitions, so you can run scenarios without fragile spreadsheets.
Field-ready pull-through: Push plan changes and underutilized access wins into CRM and territory workflows, so coverage improvements translate into prescriptions.
The results
The ROI of Catching Access Problems
60-90
days
37
%
3-4
Weeks
57%

Why tellius
How Agentic Analytics
Changes the Game for Market Access

Unify
Bring formulary intelligence, hub services, specialty pharmacy signals, and claims into one governed layer so approval rates, step edits, and payer mix can be tracked consistently.

Explain
Automatically break TRx/NBRx changes into payer-specific drivers (formulary status, UM restrictions, approval/denial patterns, and cost-share) so you know what actually caused the shift.

Act
Automated agentic workflows continuously monitor payer behavior, flag early risk signals (denial spikes, new step edits, policy language changes), and generate field-ready pull-through actions for market access, brand, and field teams.
Questions & Answers
Real Questions from Pharma Analytics Teams
Below, we've organized real questions from market access and analytics teams into five parts. Every answer is grounded in actual practitioner debates.
Part 1: Prior Authorization, Step Therapy & Access Barriers
Reveal where access friction slows patients down and pinpoint the payer rules that drive drop-off
2. How can we systematically track step therapy (“fail-first”) requirements across hundreds of health plans?
You can track step therapy (“fail-first”) across hundreds of health plans by bringing formulary and utilization management (UM) data into one standardized database. Pull policy details from payer documents and data vendors, then normalize them so every plan follows the same structure.
Use coverage fields that clearly flag step therapy and prior authorization by plan, product, and line of business. This lets you map each drug to its required steps, compare rules across payers, and see access differences at national and regional levels.
Then add two layers: policy-change alerts and outcome linkage. Alerts tell you when rules change, and linking to claims or patient journey data shows how step edits affect real outcomes like time-to-therapy, abandonment, and overall access.
3. How can I detect which payers increased access restrictions over the last quarter?
You can detect where access restrictions increased in the last quarter by comparing the following payer-level utilization management metrics against the previous quarter.
- prior authorization rates
- step therapy enforcement
- rejection patterns
- formulary status changes
Claims data, formulary intelligence sources, and hub activity can reveal spikes in PA volume, growing denial rates, or new fail-first requirements. By automatically highlighting plans where these indicators moved negatively, analytics makes it easy to pinpoint which payers tightened access and quantify the impact on prescriptions and patient progression.
4. How can we determine which prior authorization criteria are responsible for the highest rejection rates?
You can identify which prior authorization criteria cause the most rejections by analyzing denial codes, documentation requirements, and clinical criteria within payer PA responses to see which rules are most frequently unmet.
By linking rejection reasons to specific criteria, such as
- missing step therapy evidence
- unsupported diagnosis codes
- insufficient lab results
- incomplete paperwork
you can pinpoint the drivers of failed PAs. Layering this with claims and HUB data highlights which criteria create the biggest barriers, helping teams target education, documentation improvements, and payer-specific strategies.
5. How can I measure the impact of prior authorization and step therapy requirements on our brand’s prescription volume?
You can quantify the impact of prior authorizations and step edits by comparing prescription volume for patients exposed to these requirements against those who are not, using claims and hub data to track drop-off at each step of the access process.
By measuring the following and linking them to TRx, NBRx, and first-fill outcomes, you can calculate how many prescriptions were delayed or lost due to UM (Utilization Management) barriers (access rules that can delay or block a fill, even when a prescription is written).
- PA submission rates
- approval times
- denial patterns
- step therapy failures
This analysis highlights the true volume impact and identifies where targeted interventions can recover starts.
6. How can we measure time-to-therapy across payers and identify where delays occur?
You can measure how long it takes for patients to start therapy under different payers by tracking the timestamps between key steps in the access journey and comparing these intervals across plans:
- Prescription
- Benefits verification
- Prior authorization
- Approval
- First fill
Claims, hub, and specialty pharmacy data reveal where delays occur, such as
- slow PA processing
- high denial rates
- long patient outreach cycles
By benchmarking each payer’s average time-to-therapy and highlighting outliers, analytics makes it easy to identify which plans create the biggest access bottlenecks.
7. What analytics platform can track real-time prior authorization approval rates by payer?
Prior authorization approval rates can range from 30% to 80% depending on the payer, but many manufacturers only see aggregate denial data monthly or quarterly. Real-time tracking requires pulling together data from hub services, specialty pharmacies, and claims reversals into one view.
Tellius can connect these different data sources through its semantic layer, giving daily visibility into PA approval rates by payer and flagging when approval performance starts to deteriorate so teams can respond quickly.
8. Can AI automatically read payer policy documents and tell us what changed in PA criteria or step edits?
Yes, if you treat payer policy PDFs as a real data source. In access, rules often change in the documents first. Claims and dashboards usually show it later. In 2026, you need change detection fast.
- Collect the latest policy docs: Formularies, medical policies, UM updates, bulletins—from approved sources.
- Turn PDFs into usable text: Use document parsing (and OCR only if scanned) so tables + sections don’t get mangled.
- Extract structured “policy facts” with NLP/LLM: Pull fields like:
- PA required (yes/no)
- step therapy sequence
- clinical criteria (diagnosis, labs, prior drugs tried)
- effective date + line of business
- Reconcile across sources (so one PDF doesn’t mislead you): Cross-check with vendor feeds + hub/SP signals (denials, time-to-therapy) + internal intel. If sources disagree, flag it instead of guessing.
- Agentic monitoring: detect + summarize changes automatically: When a new doc appears, the system re-extracts rules, compares to the old version, and flags meaningful changes.
What you get:
- A change log: “Plan X added step therapy for Drug Y”
- A rules table you can join to outcomes (PA approvals, abandonment, TRx/NBRx impact)
- An audit trail: which document text supported the change
That’s the “AI/agentic” upgrade: you stop reading PDFs manually and start getting alerts when access rules actually change.
Part 2: Payer Performance, Formulary Strategy & Market Access Insights
Understand how payer decisions shape your real-world performance and target the levers that move TRx and NBRx
1. Why does it take so long to measure the market access impact of a new competitor launch?
It often takes 2-3 months to assess the market access impact of a new competitor because the data that reflects real payer and patient behavior, such as
- adjudicated claims
- rejection patterns
- formulary updates
- copay changes
- PA trends
lags behind the launch date.
Payers typically take weeks to update policies, pharmacies adopt changes at different speeds, and early claims don’t show mature utilization or switching behavior. Until enough data accumulates across these sources, analytics teams cannot reliably evaluate how a competitor’s entry affects access, pull-through, and patient conversion.
2. Why do similar formulary positions yield different results across payers?
Similar formulary positions can yield different results across payers because real-world access depends on more than the listed coverage tier. It’s shaped by
- variations in utilization management rules
- PA approval rates
- step therapy enforcement
- pharmacy networks
- patient cost-sharing
- operational efficiency of each plan
Even when two payers label coverage the same way, differences in adjudication behavior, benefit design, and member demographics can produce very different speed-to-therapy, abandonment, and overall access outcomes.
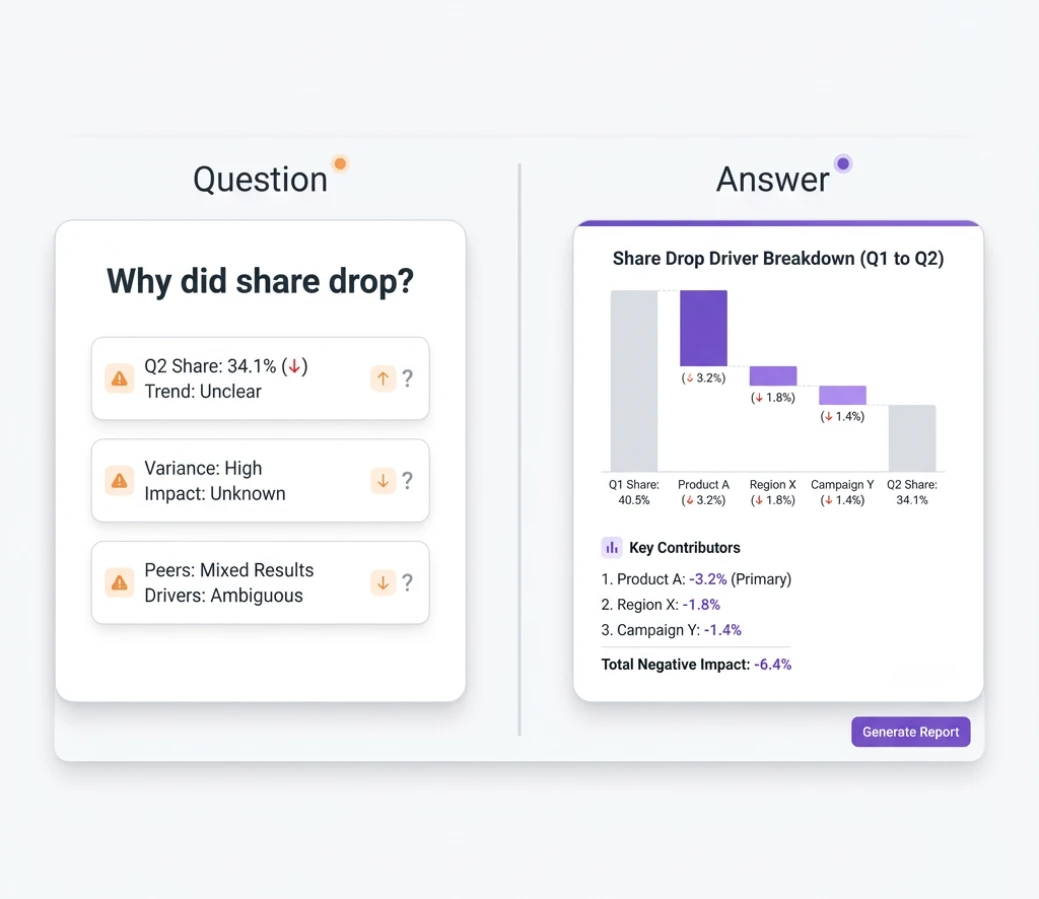
3. How can I quickly identify which payers contributed to this month’s TRx or NBRx decline?
You can find the payers driving a TRx or NBRx decline by breaking the drop into payer-level contributions and comparing this month to prior periods.
Step 1: Attribute the decline by payer
- Split TRx/NBRx by payer/plan
- Rank payers by how much they contributed to the total drop
Step 2: Diagnose what changed inside those payers. For the top “negative” payers, check shifts in:
- New starts (NBRx)
- Approvals vs. rejections
- Utilization management (UM) barriers, like prior authorization (PA) and step therapy (fail-first)
Step 3: Layer in the likely reasons. Overlay payer contribution with signals like:
- formulary or tier changes
- claim rejection spikes
- higher patient cost-share (copay increases)
This gives you both who caused the decline and why, so you can target follow-up actions with the specific payers that matter most.
4. Can we identify which payers drive actual scripts versus just counting covered lives?
Yes. You can identify which payers drive real prescriptions by looking at what happens inside each plan, not just how many lives are covered.
What to measure by payer/plan
- TRx and NBRx volume (actual scripts and new starts)
- Approval rates (how often patients get through)
- Patient progression (how many move from script → approval → first fill → refills)
Where the insight comes from
Claims + hub data show:
- which payers convert eligible patients into starts
- how often PA or step therapy blocks patients
- where adherence and persistence stay strong (or drop)
How to interpret it
Compare real prescription flow to the plan’s covered lives:
- Some payers have fewer lives but high pull-through (they truly drive volume)
Others look good on paper (lots of covered lives) but produce low real-world scripts because restrictions or cost-share block uptake
5. How can I compare my formulary position vs. competitors across major payers?
For each big payer, you need to know three basics:
- which tier your drug is on
- what extra rules apply (like prior auth or step therapy)
- what patients are likely to pay out of pocket.
These details change often, and payer documents are usually hard to read and don’t always show every restriction clearly. So in real life, teams pull information from three places:
- public formulary files
- what account and field teams hear in payer/HCP meetings
- win–loss notes from contracting.
The real goal is to see your relative position: being on tier 2 can be an advantage if competitors are on tier 3, but a weakness if they are on tier 1. Tellius can bring all of this data into one view and build simple scorecards by payer and region.
6. How do we measure field force impact on payer pull-through rates?
Winning better access is only half the job; you also need the field team to turn that access into prescriptions. The hard part is separating:
- Growth driven by access changes (better formulary position), from
- Growth driven by field promotion and execution
One useful approach is difference-in-differences analysis:
- Compare prescription trends before vs after an access change
- Across territories with different levels of field activity (call frequency, reach, programs)
If territories with high field intensity grow much faster than similar territories with low field intensity after the same access win, that extra lift is likely pull-through driven by the field.
Tellius Kaiya’s causal analysis can formalize this, helping you separate access-driven growth from promotion-driven growth and understand the mix. This, in turn, guides how you allocate budget and headcount between market access investments and field force resources.
7. How can we deliver market access insights to field and brand teams so they can coordinate effective pull-through?
Market access insights can be shared with field and brand teams through integrated dashboards, CRM alerts, and simplified payer profiles that translate complex access data into clear, actionable pull-through guidance. By embedding the following insights directly into field workflows, teams can tailor their messaging and resources for each account.
- formulary changes
- PA trends
- rejection hotspots
- payer opportunities
When insights are pushed in real time and aligned across brand, access, and field stakeholders, organizations can execute coordinated pull-through strategies that improve prescribing and patient access outcomes.
8. Can we track competitor access positions without expensive third-party data?
Yes. You don’t have to spend $500K+ per year on competitive formulary data if you use the information you already have access to. A lot of competitor access intel is available from:
- Public payer documents (online formulary listings, medical policies, PDFs)
- Field intelligence (reps hearing about competitor coverage in calls)
A cost-effective approach is to:
- Use web scraping to pull formulary data from payer sites
- Capture field feedback in CRM or simple forms
- Apply natural language processing (NLP) to parse and structure unstructured text
Tellius can aggregate competitive access intelligence from multiple unstructured sources (such as field emails in Google Drive, Gong call transcripts where customers mention competitor coverage, and payer formulary PDFs) alongside your structured access data. Using NLP, it can extract and organize restrictions, tiers, and policy language into a unified view, so you can track competitor positioning without relying entirely on expensive syndicated subscriptions.
9. When PA approval rates suddenly drop, can AI automatically investigate which payers, criteria, and HCP segments drove it?
When PA approval drops fast, dashboards usually show the decline but not the cause. Leaders immediately ask: Which payers drove it? What changed? Which criteria are failing? Which HCP segments are impacted? Traditional investigation can take days because analysts have to pull hub data, denial codes, formulary updates, and then slice everything by payer, geography, specialty, and time.
Agentic investigation workflows automate this. The system monitors access KPIs (PA approval, denials, time-to-therapy, abandonment). When a meaningful change happens, it automatically launches an investigation and returns an explanation quickly.
What the workflow does:
- Triggers automatically: It detects significant movement and starts analysis without a ticket.
- Checks drivers in parallel:
- Payer policy changes: New criteria, documentation requirements, step edits, or tighter rules.
- Denial reason shifts: More “missing documentation,” “unsupported diagnosis,” “step therapy not met,” and similar patterns.
- Segment concentration: Whether the problem is focused in certain specialties, regions, patient types, or HCP cohorts.
- External context when available: Competitive events or guideline changes that often affect payer behavior.
- Payer policy changes: New criteria, documentation requirements, step edits, or tighter rules.
- Quantifies contribution: It estimates which drivers explain most of the drop using denial-pattern statistics and segmentation.
- Recommends actions: It can suggest targeted fixes, like updating PA templates for a payer’s new lab requirement or focusing education on the practices with high incomplete submissions.
What you get: a short, defensible story of what changed, where it changed, why it changed, and what to do next, without waiting for a multi-day manual build.
Part 3: AI, Predictive Analytics & Automation for Market Access
Use AI to anticipate risk, forecast payer behavior, and automate next-best actions for faster pull-through
1. What analytics can help forecast the portfolio impact of IRA Medicare price negotiations?
You can forecast the portfolio impact of IRA Medicare price negotiations using scenario modeling on top of claims-based forecasting and patient-flow analytics. The goal is to estimate how negotiated Medicare prices could change revenue, volume, and access across products.
These models usually account for:
- Eligibility timing (when a product becomes negotiation-eligible)
- Historical Medicare mix and utilization (how dependent the brand is on Medicare volume)
- Competitive dynamics (what competitors may do in response)
- Therapy switching risk (patients moving to alternatives)
- Patient cost and behavior effects (out-of-pocket changes that affect adherence and persistence)
By running multiple price-and-volume scenarios, teams can:
- quantify financial exposure across the portfolio
- identify which assets are most vulnerable
- prioritize strategic responses (contracting, access strategy, portfolio timing) at the portfolio level
3: How can AI predict the impact of upcoming payer or formulary changes on our brand’s performance?
AI can forecast the impact of upcoming access changes by learning from past payer policy updates and how they affected performance.
It looks at signals like:
- historical policy changes and timing
- denial and rejection patterns
- competitive moves
- utilization management trends (PA, step therapy, criteria tightening)
Then it models how similar changes affected TRx/NBRx, access, and share in the past and simulates likely payer responses. This gives teams an early view of risk so they can plan contracting, messaging, and pull-through before performance drops.
4. How can AI agents continuously monitor payer behavior and flag early access risks?
AI agents can monitor payer behavior by continuously scanning:
- formulary updates and policy language changes
- PA trends, approval/denial rates
- rejection patterns
- claims-based utilization shifts
By comparing current activity to historical norms, the agent can flag early warning signs such as denial spikes, new step edits, shifting preferred products, or sudden policy changes. This gives market access and brand teams visibility weeks before the impact shows up in TRx/NBRx.
5. How can agentic AI workflows prioritize payer pull-through and recommend next-best actions for each region?
Agentic workflows prioritize pull-through by combining payer signals with regional prescribing patterns to focus teams where impact is highest.
They continuously evaluate:
- regional payer performance and mix
- formulary and UM changes
- denial trends and friction points
- under-utilized “good access” opportunities
Then they generate next-best actions per territory, such as:
- where to target PA education
- which messages to adjust for specific plans
- when to coordinate with patient services or hub teams
This keeps field and brand teams focused on the payer opportunities that will move prescriptions, not just the loudest problems.
6. How can we measure market access performance when specialty pharmacy data is limited or incomplete?
When specialty pharmacy data is incomplete, you can still measure access performance by triangulating across multiple sources to infer what’s happening between prescription and first fill.
Use:
- claims data
- hub (HUB) case status and timestamps
- specialty pharmacy (SP) rejection feeds (where available)
- patient services activity
Track patterns in:
- PA submission rates and approval times
- denial reasons and rejection spikes
- time-to-therapy by payer/region
Linking these signals with formulary and payer trends helps you spot delays, quantify drop-off, and guide targeted pull-through, even inside the “data black hole.”
7. Can analytics help us optimize patient assistance program spending?
Patient Assistance Programs (PAPs) and copay support can easily consume 5-10% of gross revenue, but many companies still measure impact using very rough metrics. To optimize spend, you need analytics that track:
- PAP-to-paid conversion rates (how many assisted patients become paying patients)
- Patient lifetime value by channel and segment
- Competitive assistance levels (how generous competitors are)
Tellius’s predictive models can estimate which patients are likely to convert from assistance to paid prescriptions, and which are likely to remain on free drug long-term. This allows you to focus PAP resources on high-value cases, improving both patient access and financial return instead of treating PAP as a blind cost center.
8. Can predictive models identify which accounts are ready for value-based contracts?
Not every payer is a good candidate for value-based contracts. Some lack the data, some lack interest, and pushing them wastes time. Predictive models can score “value-based readiness” by analyzing:
- Past innovation history (have they done outcomes-based deals before?)
- Data and analytics capabilities
- Level of integration with provider networks and systems
This helps you focus on progressive payers who can actually execute these contracts and avoid spending cycles on accounts that are not set up for outcomes-based agreements.
9. Are there tools that automatically highlight payer or access issues and opportunities for us?
Yes. Modern AI and agentic analytics platforms can continuously scan your access data and push insights to you instead of making you hunt for them. They can automatically flag
- when a payer’s PA approval rate drops
- when abandonment spikes
- when NBRx jumps after a formulary win
Platforms like Tellius can watch payer, territory, and HCP segments, then surface findings in plain language, such as
- “Most of this quarter’s NBRx growth came from Payer X after the tier upgrade,” or
- “Payer Y now has the highest abandonment in your top 10 accounts”
They can also highlight under-utilized access: plans where you’re preferred but share is below expected, so teams know where to act first.
10. How can AI optimize hub services and access team deployment across payers when PA volume, denial rates, and staffing capacity keep changing?
Market access teams have real constraints: hub staffing is limited, access specialists have limited bandwidth, and field time is finite. Meanwhile, payer barriers change quickly, and the “highest lives” payer is not always the payer with the biggest recoverable opportunity.
AI optimization helps by making resource decisions based on expected patient recovery.
What the system does:
- Scores opportunities continuously: It identifies where recovery is likely, such as payers with rising denials, high abandonment, or new criteria that practices are failing to meet.
- Balances real constraints: It allocates effort while respecting staffing limits, budget limits, service-level needs, and practical execution capacity.
- Forecasts volume so you can staff ahead of the spike: If PA volume is trending up for specific payers, forecasting can help you plan staffing instead of reacting after backlogs appear.
- Estimates marginal impact: It looks at diminishing returns so you can see when adding more effort stops paying off.
- Supports scenario planning: Leaders can test tradeoffs, like shifting staff from stable payers to emerging risk payers and seeing the expected portfolio impact.
You get a clear recommendation for where to deploy hub effort, payer strategy effort, and field enablement, based on which mix is most likely to improve starts and reduce abandonment under real-world constraints.
Part 4: Platforms, GTN, and Contract Modeling
Equip teams with the right analytics platforms to model revenue, evaluate contracts, and guide data-driven access strategy
1. What analytics platform best supports gross-to-net forecasting and scenario modeling in an IRA environment?
In an IRA environment, the best gross-to-net (GTN) platforms are the ones that put everything in one auditable system, including:
- contract terms and eligibility rules
- government pricing logic and IRA impacts
- rebates, chargebacks, and fees
- payer mix shifts and utilization trends
- scenario modeling (“what if price/rebate/mix changes?”)
The key requirement is governed, traceable logic. Finance and market access teams need to simulate price, rebate, and volume scenarios and clearly see how IRA rules could change net revenue and portfolio performance, without relying on fragile spreadsheets.
2. What capabilities should a market access analytics platform include?
A strong market access analytics platform should bring together the data needed to explain access performance end-to-end, including:
- claims, specialty pharmacy, hub, and formulary data
- a unified view of patient access, time-to-therapy, and payer performance
It should support payer-level insight into:
- PA trends and approval/denial rates
- rejection drivers and step edits
- formulary changes and policy shifts
- real-time TRx/NBRx movement by plan
More advanced platforms also add:
- forecasting and “what-if” modeling
- AI-driven risk detection (early access deterioration signals)
- pull-through recommendations by region
- workflows that push insights to brand and field teams in a usable format
The real test: it makes complex access data easy to understand, actionable, and tied to measurable outcomes.
3: What tools can model the revenue impact of different contracting scenarios?
Payer contracting is a balancing act between:
- Rebate levels
- Formulary position (preferred, non-preferred, excluded)
- Utilization management (PA, step therapy, quantity limits)
All of these affect net revenue, not just list price. Many teams still try to model this in Excel, but as soon as you include multiple payers, multiple indications, and different contract structures, the spreadsheet becomes unmanageable.
Advanced analytics platforms can simulate thousands of contracting scenarios at once and estimate how each one affects volume, access, and net revenue over time. This lets you optimize the rebate / access / volume trade-off for maximum net present value (NPV) instead of guessing with a few manual “what-if” Excel tabs.
4. How can we measure whether market access initiatives, such as new contracts or hub programs, actually improved patient access or sales performance?
You can measure impact by comparing before vs. after results on the access steps the initiative was meant to change.
Track metrics like:
- PA approval rate and denial reasons
- rejection trends and abandonment signals
- time-to-therapy
- first-fill rate and conversion through the journey
- payer-level TRx/NBRx changes
To make it credible, isolate the populations actually affected such as:
- the contracted payer segment
- the patients in the hub program
- the regions where the workflow changed
Then link access improvements to prescription lift to estimate ROI and identify which initiatives truly improve access and sales outcomes
5. How does conversational analytics help non-technical users explore market access data?
Market access data is messy: lots of plan types, codes, and policy rules. Conversational analytics helps by letting non-technical users ask questions in plain English, such as:
- “Which plans have the lowest approval rates?”
- “Where did denial reasons change this quarter?”
The system translates the question into the right joins and filters behind the scenes, so users don’t need SQL or schema knowledge. They can also ask follow-up questions to drill deeper in the same flow instead of filing new report requests. In Tellius, this is delivered through a governed semantic layer so answers stay consistent.
6. Can conversational AI handle complex multi-step market access questions?
It can, but only if it is built on market access semantics and governed logic. Access questions are hard because they require multiple joins and careful definitions across formulary status, claims, hub activity, and denial reasons.
For a question like “Show me payers where we’re preferred but pull-through is low, then break down by denial reasons”, conversational access analytics works when it has three foundations:
- A market access semantic layer
The system must understand access terms and how they map to data, such as “preferred,” “pull-through,” “PA approval,” “step therapy,” and “category benchmark.” - Context retention for multi-step investigations
Access teams ask follow-ups in sequence (“Which payers?” → “Which denial reasons?” → “Which regions and specialties?”). The system must keep filters and context consistent across steps. - Multi-source querying
Good answers require pulling from formulary data, claims, hub systems, specialty pharmacy signals (when available), and sometimes qualitative field intel. The system needs to combine them in one investigation flow.
The real test is reliability. If payer IDs do not match across systems or definitions vary by team, conversational AI can produce inconsistent answers. When the semantic layer is governed and the data is integrated, conversational AI becomes a practical way to answer complex access questions during planning meetings instead of waiting for analyst tickets.
7. When payers change formulary policies or coverage files without warning, how do we keep a consistent access narrative and avoid leadership confusion?
This is a common trust problem in access analytics. Payer policies can change mid-cycle, but vendor files may lag. This creates confusing situations where forecasts, decks, and “current status” reports disagree. Formulary data governance solves this by making coverage changes traceable and auditable.
Four capabilities matter:
- Immutable snapshots with provenance
Each ingest captures the coverage status plus source, version, timestamps, effective dates, and metadata. This makes it clear which “version of truth” a report used. - Change detection and alerts
When a new file arrives, the system compares it to prior versions and flags meaningful changes (tier moves, new PA, new step edits, criteria changes). It also estimates who is affected (lives, plans, segments). - Version-controlled reporting
Teams can lock reviews and forecasts to a chosen snapshot so decks remain internally consistent, while still allowing “latest view” reporting with clear labels. - Multi-source reconciliation
Stronger systems do not rely on a single vendor feed. They cross-check vendor data against public payer docs, field intelligence, and operational signals like denial reason spikes. If sources conflict, the platform flags it and shows which source is most recent.
As a result, you end up with fewer “which number is right?” debates, faster response to real policy changes, and a leadership narrative that is consistent because it is based on versioned, explainable access data.
8. How can we simulate contracting choices while accounting for real access friction (PA, abandonment, time-to-therapy), not just “covered lives”?
Many contract models over-focus on covered lives and rebate math, but real performance depends on whether patients can actually start and stay on therapy. A stronger scenario model treats a contract as something that changes both coverage and the patient journey.
A better simulation includes:
- Contract terms: rebate levels, eligibility rules, channels (commercial vs Medicare), exclusions, and any admin/guarantee clauses.
- Formulary position changes: tier movement plus the actual restrictions (PA, step therapy, quantity limits, specialty pharmacy rules).
- Access friction assumptions (by payer/segment):
- PA submission and approval rate
- common denial reasons and how they shift
- abandonment risk (script written → never filled)
- time-to-therapy changes (delays from BV/PA to first fill)
- Outcome and economics: TRx/NBRx lift estimates, pull-through, persistence where available, and the net impact on gross-to-net (rebates, fees, copay/PAP effects if included).
With agentic analytics, you get side-by-side contracting scenarios that show the real tradeoffs, like:
- Higher rebate → better tier, but stricter UM increases abandonment and delays starts
- Lower rebate → worse tier, but fewer friction points improves conversion and speed-to-therapy
You also get a decision view that ranks options by net revenue and patient conversion. The key is that the model outputs both:
- the expected changes in coverage + UM (tier, PA, step edits)
- the downstream impact on approvals, time-to-therapy, abandonment, and ultimately realized scripts and net revenue.
Part 5: Platform Comparison & Evaluation
Compare market access platforms against BI tools and custom builds, and learn what to ask vendors before you buy.
1. What is the best market access analytics platform for pharma commercial teams?
The best market access analytics platform for pharma needs five capabilities most platforms lack.
First, unified payer data integration. The platform should connect formulary intelligence, claims, hub services, and specialty pharmacy data into one view, without manual assembly or Excel reconciliation.
Second, a pharma-native semantic layer. It must understand PA approval rates, step therapy sequences, denial codes, time-to-therapy calculations, and payer hierarchies natively. Generic BI tools don't speak this language.
Third, real-time access monitoring. Teams need to detect formulary changes, PA rate drops, and denial spikes before quarterly claims arrive.
Fourth, automated root cause analysis. When access metrics change, the platform should explain whether the driver was new step edits, criteria tightening, payer policy shifts, or something else, without requiring manual investigation.
Fifth, pull-through activation. Access insights must flow into field and brand workflows so coverage improvements translate into prescriptions. Insights that stay in dashboards don't move share.
Tellius is purpose-built for pharma market access analytics and meets all five criteria. It deploys in 8-12 weeks on existing infrastructure.
2. How is market access analytics different from formulary data subscriptions?
Formulary subscriptions tell you coverage status: which drugs are on which tiers, which have prior authorization requirements. Market access analytics tells you whether that coverage actually translates into prescriptions.
Formulary subscriptions show: "Drug X is preferred on Plan Y with step therapy required."
Market access analytics shows: "Plan Y has a 45% PA approval rate, 3-week average time-to-therapy, and 22% abandonment after denial, despite preferred status."
The difference matters because two plans with identical formulary positions can produce very different prescription volumes. One might approve PAs quickly with minimal friction. Another might have the same tier but enforce criteria so strictly that patients abandon before first fill.
Market access analytics connects coverage data to claims, hub services, and specialty pharmacy signals. So you see which payers drive real scripts, not just which payers have favorable coverage on paper. Formulary subscriptions are a necessary input. Market access analytics turns that input into actionable payer intelligence.
3. How is market access analytics different from traditional BI tools?
Traditional BI tools visualize data. Market access analytics explains why access metrics changed and recommends what to do about it.
BI tools answer: "PA approval rates dropped 12% this quarter." Then analysts spend days investigating which payers, which criteria, and which regions drove the drop.
Market access analytics answers: "PA approvals dropped 12% this quarter. Payer X drove 60% of the decline after adding new step therapy requirements in the Northeast. The criteria most frequently unmet is documentation of prior therapy failure. Recommended action: update PA submission templates and target education to high-volume practices in affected regions."
BI tools require analysts to assemble data from multiple sources, build custom queries, and manually investigate every change. Market access analytics automates that investigation: connecting formulary intelligence, claims, hub data, and denial patterns in one governed layer.
The practical difference: BI reports show what happened. Market access analytics explains why it happened and where to focus pull-through efforts. Teams get answers in hours instead of weeks.
4. How does market access analytics compare to building custom on Snowflake or Databricks?
You can build market access capabilities on your data platform, but expect 6-12 months before teams can actually use it.
What custom builds require: Integrating formulary intelligence, claims, hub services, and specialty pharmacy data with payer ID reconciliation across sources. Semantic layers encoding PA approval rates, step therapy tracking, denial codes, time-to-therapy, and payer hierarchies. Analytics for root cause analysis, anomaly detection, and pull-through recommendations. Plus ongoing maintenance when data formats change.
What purpose-built platforms provide: Pre-built pharma connectors, semantic layers that understand access metrics, and analytics designed for market access teams. Deployed in 4-8 weeks instead of 6-12 months.
The decision: Build if you have dedicated data engineers and 12+ months runway. Buy if you need payer-level visibility this quarter.
5. What should we ask vendors when evaluating market access analytics platforms?
Data integration: Can you connect formulary intelligence, claims, hub, and specialty pharmacy data without manual processing? How do you handle payer ID reconciliation?
Pharma fit: Do you understand PA approval rates, step therapy, denial codes, time-to-therapy, and payer hierarchies natively?
Access monitoring: Can you detect formulary changes and PA rate drops before quarterly claims arrive?
Root cause: When access metrics change, can the system explain whether it's step edits, criteria tightening, or policy shifts?
Pull-through: Can you push access insights into field and brand workflows?
Vendors who answer with pharma market access examples (specific payers, specific barriers, specific results) are worth serious consideration.
6. How long does it take to deploy market access analytics for pharma?
Deployment typically takes 8-12 weeks:
Weeks 1-3: Data connection: formulary feeds, claims, hub, specialty pharmacy. Payer ID reconciliation.
Weeks 2-5: Semantic layer: PA calculations, denial codes, time-to-therapy definitions, payer hierarchies.
Weeks 4-8: Payer performance views live: plan-level approval rates and denial patterns. First value delivered.
Weeks 6-12: Access monitoring, alerts, and tuning.
First value in 4-8 weeks. Compare to 6-12 months for custom builds.
7. What ROI should pharma teams expect from market access analytics?
Earlier visibility: 60-90 days earlier detection of access shifts vs. waiting for quarterly claims. Teams can respond while share is still recoverable, not after the damage is done.
Recoverable abandonment: Industry data shows 37% of PA-related abandonment is recoverable when you identify the specific payer rules and documentation gaps that cause drop-off. Market access analytics pinpoints those barriers so hub and field teams can target fixes.
Time-to-therapy improvement: 3-4 weeks of initiation delays can be attacked by identifying where patients get stuck (slow PA processing, missing documentation, payer-specific criteria). Reducing time-to-therapy improves both patient outcomes and prescription conversion.
Launch protection: 57% of launch failures are tied to limited market access. Early access monitoring is non-negotiable for new products. The cost of missing access problems at launch far exceeds the cost of the analytics.
Benchmarks: First value in 4-8 weeks. Payback typically within 6-12 months. Most of that comes from scripts you would have lost without early warning.
"I have a very positive overall experience. The platform is perfectly suitable to business users who don't have technical knowledge and who need information instantaneously. Huge productivity gains!"

The Challenge Every Pharma Commercial Leader Faces
You're drowning in data from IQVIA, claims databases, CRM systems, and competitive intelligence platforms—yet when executives ask "Why did our numbers change?" the answer is always: "We'll need a few days to investigate."
The Problem Isn't Lack of Data — It's Lack of Insights
Traditional dashboards show what happened, not why
Root cause analysis takes days or weeks of manual investigation
Non-technical users can't explore data without submitting IT requests
Insights arrive too late to prevent revenue loss
Multiple tools and data sources create fragmented views
Field teams spend 40% of their time preparing reports instead of selling
Agentic Analytics Changes Everything
Deploy AI agents that work 24/7—continuously monitoring your business, automatically investigating changes, and proactively alerting you to risks and opportunities. From weeks of manual analysis to seconds of AI-generated insights. From reactive reporting to agentic intelligence. From data silos to unified, self-operating analytics.
Introducing Pharma Intelligence
Unified decision intelligence across your entire commercial operation
Pharma teams depend on fast, accurate insights across HCP targeting, field execution, market access, contracting, brand growth, patient services, and incentive compensation. Pharma Intelligence brings all these capabilities together—powered by AI analytics and agentic workflows—to help organizations unify data, explain performance, detect risks, and drive next-best actions across every commercial function.
📊 Analytics Solutions for Every Commercial Function
📊
Analytics Solutions for Every Commercial Function
Each hub addresses critical challenges with unified data, instant root cause analysis, and AI-powered insights. Choose your area to explore how we solve your specific pain points.

Field Force Sales Effectiveness
📝
34 Questions
⏱️
6,000 words
Pharma teams depend on fast, accurate insights across HCP targeting, field execution, market access, contracting, brand growth, patient services, and incentive compensation. Pharma Intelligence brings all these capabilities together—powered by AI analytics and agentic workflows—to help organizations unify data, explain performance, detect risks, and drive next-best actions across every commercial function.
Critical Capabilities:
HCP targeting & segmentation (AI-powered scoring)
Territory performance vs. potential (real-time)
Call quality & message effectiveness (NLP analysis)
Prescriber churn prediction (early warning alerts)
Pre-call planning (automated contextual briefs)

Brand Performance & KPIs
📝
31 Questions
⏱️
6,500 words
Transform business reviews and root cause analysis with instant TRx/NBRx explanations, automated market share decomposition, and complete narrative generation. Uncover hidden opportunities worth millions while reducing prep time from 2 weeks to 2 days—eliminating the endless Excel work and manual investigation cycle.
Critical Capabilities:
TRx/NBRx anomaly detection & auto-explanation
Market share decomposition (instant driver analysis)
Root cause analysis (multi-variable, seconds not days)
Business review automation (narrative + visuals)
Competitive intelligence (continuous tracking)

Market Access Performance
📝
30 Questions
⏱️
5,500 words
Track formulary changes, prior auth approval rates, and payer mix shifts with unified access intelligence—identifying exactly where coverage restrictions cost you scripts before they impact revenue. Get automated alerts on formulary movements, access barriers, and abandonment patterns with recommended interventions.
Critical Capabilities:
Formulary impact alerts (position change detection)
Prior authorization tracking (approval rate trends)
Payer mix dynamics (coverage shift analysis)
Abandonment prediction (access barrier identification)
Copay program ROI (effectiveness measurement)

Contracting & Payer Strategy
📝
30 Questions
⏱️
5,500 words
Optimize contract performance with unified tracking of rebate effectiveness, volume commitments, and ROI across all payer agreements. Model negotiation scenarios, measure contract impact in real-time, and identify which agreements deliver value and which underperform—with recommended actions before renewals.
Critical Capabilities:
Performance vs. expectations (continuous tracking)
Rebate effectiveness (automated optimization)
Scenario modeling (what-if negotiations)
Gross-to-net decomposition (contract-level)
Value-based outcomes (automated tracking)

HCP Targeting & Segmentation
📝
30 Questions
⏱️
5,500 words
Identify high-potential prescribers with AI-powered lookalike modeling, calculate physician lifetime value in real-time, and dynamically adjust segmentation as market conditions change. Find opportunities before competitors while optimizing targeting continuously—without manual deciling or static segment updates.
Critical Capabilities:
High-potential identification (AI-powered scoring)
Lookalike modeling (predictive targeting)
Prescriber LTV calculation (real-time updates)
Dynamic micro-segmentation (adaptive)
Acquisition optimization (prescriber journey)
⚡
Two Powerful Approaches to Analytics Transformation
⚡ Two Powerful Approaches to Analytics Transformation
Combine conversational interfaces for instant answers with agentic intelligence that works proactively—solving both immediate needs and long-term efficiency.

Conversational Analytics & AI Foundations
📝
25 Questions
⏱️
4,500 words
The foundation: Ask questions in plain English and get instant answers. Conversational interfaces democratize data access, automated root cause analysis explains why metrics moved, and predictive models forecast future performance. Essential AI capabilities that transform static dashboards into interactive intelligence.
Foundational AI Capabilities:
Conversational analytics (natural language queries)
Automated root cause analysis (driver decomposition)
Predictive modeling (prescription trend forecasting)
Machine learning (segmentation & targeting)
Unified data integration (IQVIA, CRM, claims, digital)

Agentic Analytics: AI Agents That Work 24/7
📝
25 Questions
⏱️
4,500 words
The evolution: AI agents work continuously 24/7—monitoring your business, automatically investigating anomalies, and proactively alerting you to risks and opportunities before you ask. Move from asking questions to receiving answers you didn't know you needed. This is what separates reactive analytics from agentic intelligence.
Agentic Capabilities:
24/7 monitoring (continuous surveillance)
Automatic anomaly investigation (self-initiated RCA)
Proactive risk alerts (before revenue impact)
Self-optimizing workflows (adaptive intelligence)
Automated business narratives (review generation)
Platform & Technology Questions
Understanding Pharma Intelligence and agentic analytics at the platform level
What is agentic analytics for pharmaceutical commercial operations
Agentic analytics represents the evolution from reactive reporting to proactive intelligence. Unlike traditional analytics where users must ask questions and wait for answers, agentic analytics deploys AI agents that work continuously—monitoring your business 24/7, automatically investigating anomalies, and proactively alerting you to risks and opportunities before you ask. In pharmaceutical commercial operations, this means AI agents track hundreds of metrics across brand performance, field execution, market access, and HCP engagement simultaneously. When meaningful changes occur—like a TRx decline, formulary restriction, or prescriber disengagement—agents automatically perform root cause analysis and deliver specific, actionable recommendations with full context.
How does Pharma Intelligence unify data across commercial functions?
Pharma Intelligence automatically integrates data from IQVIA (prescription trends, market share), Symphony (claims data), CRM systems (Veeva, Salesforce for field activity), payer databases (formulary status, prior auth rates), competitive intelligence, and internal systems. The platform creates a unified semantic layer that harmonizes these disparate sources, resolving HCP identities, aligning geographies, and standardizing metrics. This means field teams, brand managers, market access leaders, and contracting teams all work from the same single source of truth. When an AI agent detects a TRx decline, it can instantly correlate field activity, payer changes, competitive moves, and HCP prescribing patterns—insights impossible when data sits in silos.
What's the difference between AI analytics and agentic analytics?
AI analytics provides conversational interfaces and automated insights—you ask "Why did NBRx decline?" and get instant answers with root cause analysis. This is valuable and represents a major improvement over traditional BI. Agentic analytics goes further: AI agents work autonomously without human prompting. They continuously monitor your business, automatically detect meaningful changes, investigate root causes on their own, and proactively send you alerts with recommendations. Think of it as the difference between having a very smart assistant who answers your questions (AI analytics) versus having a team of analysts working 24/7 who investigate issues and bring you insights before you know to ask (agentic analytics). Most organizations need both layers working together.
What ROI can we expect from deploying agentic analytics?
Typical pharmaceutical companies see $10-17M in annual value creation per brand with 6-9 month payback periods and 1,700%+ first-year ROI. Value comes from four areas: analyst time savings (70-85% reduction, ~$645K annually), proactive issue detection (catching formulary changes, prescriber churn, access barriers 2-4 weeks earlier saves $3-4M), AI-identified opportunities (underserved segments, high-potential HCPs, contract optimization worth $5-10M), and improved forecasting accuracy ($2-3M in better resource allocation). Beyond quantifiable ROI, organizations report dramatically improved executive satisfaction, faster business reviews (2 weeks to 2 days), and field teams spending time selling instead of preparing reports. The platform essentially pays for itself within the first quarter through time savings alone.
How do AI agents work across field force, brand, and market access?
AI agents operate across all commercial functions simultaneously, detecting insights that span multiple teams. For example: an agent monitoring market access detects Aetna added step therapy requirements affecting 8,200 covered lives. It automatically investigates the brand impact (estimated -$2.3M TRx), identifies affected territories and HCPs, analyzes which field reps need to adjust messaging, and calculates the patient support program implications. Within minutes, the agent sends coordinated alerts to market access (escalate with payer), brand team (update forecasts), field leadership (prioritize affected HCPs), and patient services (expect abandonment increase). This cross-functional intelligence—impossible with siloed tools—enables coordinated responses that protect revenue.
How long does deployment take and what resources are needed?
Typical deployment takes 6-12 weeks from kickoff to full production. Week 1-3: Data integration (IQVIA, CRM, claims, payer sources). Week 4-6: Semantic layer configuration and pharma-specific metric definitions. Week 7-9: Agent deployment, alert configuration, and user training. Week 10-12: Optimization and rollout. Required resources: Executive sponsor (5% time), 2-3 business analysts (50% time during deployment), IT liaison (25% time for data access), and key business users for UAT. Post-deployment, platform is largely self-operating—AI agents handle monitoring and investigation automatically. Most organizations need only 1-2 FTEs for ongoing administration, far less than traditional BI platforms that require constant analyst support.
How does this compare to traditional pharma analytics platforms?
Traditional platforms (Tableau, Power BI, Qlik) require users to build dashboards, write SQL, and manually investigate every question. Pharma-specific platforms (IQVIA OCE, Veeva CRM Analytics) provide pre-built reports but still require manual analysis. Neither offers AI agents that work autonomously. With agentic analytics, AI agents continuously monitor and investigate automatically—no dashboard building, no SQL, no waiting. Conversational interfaces let anyone ask questions in plain English. Root cause analysis happens instantly, not in 3-5 days. Business reviews generate automatically. Most importantly: you receive insights proactively before issues impact revenue, rather than discovering problems in retrospective reports. Organizations typically keep existing platforms for specific use cases while Pharma Intelligence becomes the primary decision intelligence layer.
How Agentic Analytics Transforms Your Workflow
How Agentic Analytics Transforms Your Workflow
Unified Data Integration
Automatically connect and harmonize data from IQVIA, Symphony, CRM (Veeva, Salesforce), claims databases, competitive intelligence, and internal systems. No more manual data pulls or Excel wrestling.
Ask Questions in Plain English
Conversational analytics lets anyone ask questions like "Why did NBRx decline in the Northeast last month?" and receive instant answers with automated driver analysis. No SQL, no waiting for reports.
Deploy AI Agents
Agentic analytics agents work 24/7—continuously monitoring hundreds of metrics across all dimensions. When meaningful changes occur, agents automatically investigate root causes, quantify business impact, and send prioritized alerts with specific, actionable recommendations. No human prompting required.
Receive Proactive Insights & Recommendations
Get specific, prioritized alerts with context and next steps: "Prior auth denials increased 18% with Aetna in Q3. Estimated TRx impact: -$2.3M. Root cause: New step therapy requirement. Recommend: Escalate to market access team within 48 hours, review formulary status across all major payers." Know what to do, not just what happened.
Jump to Your Specific Challenge
AI agents answer your questions across three levels: foundational understanding, agentic capabilities, and business impact measurement.
🎯
Understanding Challenges & Best Practices
🎯 Understanding Challenges & Best Practices
🤖
AI Agents & Agentic Capabilities
🤖 AI Agents & Agentic Capabilities
💰
Platform Evaluation & Business Impact
💰 Platform Evaluation & Business Impact
Real Results from Deploying Agentic Analytics
How AI agents deliver measurable business impact across pharmaceutical commercial operations
Top 10 Pharma — Oncology Brand
85% reduction in monthly review prep with automated business narratives
AI agents identified $12M opportunity in underserved community oncology
Proactive formulary alerts detected risk 3 weeks earlier, saved $8M
ROI: 2,200% in first year with agentic monitoring
Specialty Pharma — Neurology
Analyst team reduced from 4 FTEs to 2 with agentic automation
15% NBRx improvement through AI-optimized HCP targeting
Agentic anomaly detection prevents $3-5M revenue loss annually
Payback period: 7 months from agent deployment
Mid-Size Pharma — Cardiovascular
AI agents generate weekly reviews in 2 hours vs. 2 days
Root cause analysis: instant vs. 3-5 days of manual investigation
Agents found $18M in hidden payer contract optimization opportunities
Executive satisfaction: 4.2 → 9.1/10 with agentic insights
Calculate Your ROI from Agentic Analytics
See what you could save by deploying AI agents across your commercial operations
Typical ROI from Agentic Analytics Deployment
Value from AI agents: Analyst time savings ($645K), proactive issue detection ($3-4M), AI-identified opportunities ($5-10M), improved forecasting ($2-3M), 24/7 monitoring & investigation (at fraction of human cost)
Ready to Deploy Agentic Analytics?
Join leading pharma companies using AI agents to monitor 24/7, investigate automatically, and deliver proactive insights—reducing analysis time by 70-85% while protecting millions in revenue.
Explore Agentic Analytics Resources
What is Agentic Analytics?
Complete Technology Guide
Customer Success Stories
Real Results from Agent Deployment
Pharma Intelligence Platform
Unified Decision Intelligence
Expert Webinars
Live Agentic Analytic Demos
Continue the journey
Dig into our latest content related to market access
Why Did Market Share Decline? The Decomposition Analysis Most Teams Get Wrong
Most CPG teams can see that market share moved, but not why—because they rely on slow, manual “share analysis” that stops at charts instead of diagnosis. The blog explains how proper market share decomposition should break a change into concrete drivers (distribution, velocity, price/mix, and competitive moves) at retailer, region, and segment level, instead of confusing simple correlations or national averages with true attribution. It shows how AI automates the hard parts—data integration, baseline modeling, and competitive tracking—so brand managers can ask “Why did share drop at Kroger last month?” and instantly see quantified drivers and recommended actions. With this always-on decomposition, teams move from week-long investigations and stale insights to fast, retailer-specific decisions that actually recover and grow share.
.png)
Augmented Analytics in 2025: The Definitive Guide
This guide lays out a complete picture of where augmented analytics is headed in 2025. It goes beyond buzzwords to explain how AI agents, conversational interfaces, generative insights, and governed semantic layers combine to deliver more than just “what happened”—they show why things change and what to do next. Expect deep dives into agentic workflows, scalability, governance challenges, and real use cases across industries. Whether you’re redesigning your data stack or evaluating new analytics tools, this is your roadmap to making augmented analytics work in practice.

Lessons from Pharma’s Biggest Deals: 5 Market Access Tradeoffs AI Analytics Can Help Model & Improve
When pharma brands strike major deals, they don’t just gain access—they inherit complex tradeoffs. From navigating volume vs. margin to managing payer fatigue, these tradeoffs shape strategy long after contracts are signed. This blog breaks down five recurring tensions in market access and shows how AI-powered analytics helps commercial and HEOR teams model scenarios, simulate outcomes, and move from rigid strategy to adaptive execution.

Heading
Heading 1
Heading 2
Heading 3
Heading 4
Heading 5
Heading 6
Lorem ipsum dolor sit amet, consectetur adipiscing elit, sed do eiusmod tempor incididunt ut labore et dolore magna aliqua. Ut enim ad minim veniam, quis nostrud exercitation ullamco laboris nisi ut aliquip ex ea commodo consequat. Duis aute irure dolor in reprehenderit in voluptate velit esse cillum dolore eu fugiat nulla pariatur.
Block quote
Ordered list
- Item 1
- Item 2
- Item 3
Unordered list
- Item A
- Item B
- Item C
Bold text
Emphasis
Superscript
Subscript