AI Agents for Modern Finance Teams
They monitor. They investigate. They explain. You decide.
Stop chasing budget variances across NetSuite, Anaplan, Snowflake, and Excel—spending 3-5 days every close investigating "why." Deploy AI agents that unify ERP, planning, and operational data into one financial model—then surface root causes in seconds, not days, conversationally.
Tellius is an agentic analytics platform purpose-built for finance and FP&A teams. It combines conversational analytics—where analysts ask questions in plain English and get instant answers about budget variances, P/V/M breakdowns, and EBITDA drivers—with agentic intelligence, where AI agents monitor financial KPIs 24/7, detect anomalies, investigate root causes automatically, and deliver insights before you ask. Unlike traditional BI tools or planning systems that require manual variance analysis every close, Tellius understands general ledger (GL) hierarchies, chart of accounts (COA) structures, and budget vs. actual (B/A) reporting natively—delivering root cause explanations in seconds instead of days.
The Problem
The Part of Finance Analytics Everyone Pretends Is Fine

Budget, actuals, forecast, and pipeline live in four different systems with four different "truths."
EBITDA variances get explained three different ways depending on which finance leader is presenting.
Cost center overruns quietly compound for 60-90 days before anyone notices—no proactive alerts, just quarterly surprises.
Analysts spend 80% of their time pulling data and 20% analyzing it—but leadership wants the opposite.
P/V/M decomposition still happens in Excel with VLOOKUP formulas that break when someone adds a column.
Traditional BI tools show what happened, not why—and root cause work still takes days of manual investigation.
CFO asks "why over budget?" and the answer is: "Give us a few hours to investigate."
Board narratives are written from scratch every month, even though analysts already investigated the same numbers.
What Is Agentic Analytics for Finance Teams?
Finance teams need fast, trusted answers across variance analysis, budget monitoring, EBITDA drivers, forecast accuracy, and executive reporting.
Today, those answers live in NetSuite exports, Anaplan workbooks, Snowflake queries, Excel models no one wants to own, and PowerPoint decks assembled by hand. Every "why over budget?" question triggers days of data stitching, pivot tables, and assumption-testing.
Agentic analytics unifies your financial data into one governed model, delivers instant root cause explanations through conversational interfaces, and deploys AI agents that monitor KPIs 24/7—investigating variances automatically and alerting you before quarterly reviews.
Start where it hurts most in financial analysis
Analytics Solutions for Every Commercial Function
Variance Analysis & Root Cause
Close week means 3–5 days investigating budget variances manually in Excel. The CFO asks "why over budget?" and the answer takes hours—pivot tables, VLOOKUP formulas, and assumptions that may not survive the follow-up question. Agentic analytics performs multi-variable root cause analysis in seconds, automatically decomposing price, volume, and mix effects while ranking drivers by contribution. Budget vs. actual variance alerts surface problems before close week chaos. EBITDA and margin driver analysis stops being a quarterly fire drill. This page shows how AI replaces manual Excel forensics with instant, defensible variance explanations.
CFO Narratives & Reporting
Board decks and business reviews require hours of commentary-writing that explain the same numbers analysts already investigated. Monthly CFO reports get assembled from scratch every cycle, even though the variance drivers haven't changed. Agentic analytics converts flux analysis into plain-English stories automatically, generating executive summaries and board-ready EBITDA commentary from the same investigation that surfaced the numbers. Monthly finance packs that used to take days now generate in minutes—with narratives that actually match the data. This page shows how AI turns repetitive reporting cycles into automated narrative generation that frees finance teams for actual analysis.
⚡
Two Powerful Approaches to Analytics Transformation
Two Powerful Approaches to Finance Transformation
Get instant answers to “why”-type questions on demand through AI Analytics for Finance as well as agentic intelligence that proactively actions key functions.
AI Analytics for Finance
Ask questions in plain English and get instant answers without waiting for the BI queue. Automated root cause analysis decomposes variances into price, volume, and mix effects in seconds. Machine learning detects anomalies and recognizes patterns humans would miss. Predictive models track forecast accuracy and flag budget trends before they become problems. Unified data integration pulls it all together so insights aren't siloed by system. This page shows how AI gives finance teams the analytical firepower to move faster without adding headcount.
Agentic Analytics: AI Agents That Work 24/7
Go from operating reactively—to proactively surfacing budget risks, variances, and critical issues that can be fixed before damage is done, rather than catching them too late in quarterly reviews. Agentic analytics leverage AI agents that provide continuous KPI monitoring that watches for variances and anomalies 24/7, triggering automated root cause investigations, proactive budget alerts, and automated business narratives before financial impact compounds). Learn how Agentic AI shifts finance from reactive firefighting to proactive intelligence that catches problems while there's still time to act.
Why Tellius
AI That Already Speaks Finance
60-90
Finance-Native Semantic Layer
37
Governed Definitions
Validated Insights
Works on Existing Infrastructure

Skeptical? Good. Start Here.
Platform & Technology Questions Related to Finance Analytics
1. Is "Finance Intelligence" just another dashboard or a real platform?
It's a decision layer, not a pretty report. Under the hood, it's a unified financial data model + analytics engine that sits across ERP (NetSuite, SAP, Oracle), planning tools (Anaplan, Adaptive, Workday), CRM (Salesforce), and data warehouses (Snowflake, Databricks). Dashboards are just one surface. The real value is that the same logic powers ad-hoc questions, recurring variance analysis, AI agents, and executive reporting—so every team pulls from one source of truth instead of maintaining shadow spreadsheets.a
2. How does this work end-to-end—from raw data to "here's why we're over budget"?
Think of it as four steps, all wired together:
Unify the data. Connect and harmonize ERP, planning, CRM, operational systems, and data warehouses into one financial model. No more manual extracts and Excel stitching.
Ask in plain English. FP&A analysts ask questions like "Why is EBITDA 5% below forecast this month?" The system maps that to governed metrics and runs the right joins and aggregations.
Deploy AI agents. Agents watch hundreds of KPIs 24/7. When something meaningful moves, they automatically investigate root causes, quantify business impact, and assemble the story.
Receive proactive insights & recommendations. Instead of raw charts, you get a targeted brief: "EBITDA declined 5% vs. forecast primarily due to higher operating expenses in Sales & Marketing (60% of variance) and delayed product revenue recognition (25% of variance). Estimated impact: -$2.3M. Next steps: review Q4 hiring plan and pipeline timing with revenue operations."
3. Where do conversational analytics and agentic analytics each fit? Do we actually need both?
Conversational analytics is the front door: it lets finance teams ask better questions faster. Agentic analytics is the back office: it keeps watch when no one is asking anything. You start with conversational analytics so people can finally get consistent answers on demand. Once that foundation is solid, agents take over the boring part: continuous monitoring, driver analysis, alerting, and narrative generation. You don't need agents to get value, but without agents you'll always be one meeting behind your own data.
4. What kind of ROI should a finance team expect if this is done right?
If all you want is nicer dashboards, the ROI will be mediocre. The upside comes when you use the system to:
- Catch budget risks early enough to course-correct, not just explain missed quarters
- Reallocate analyst capacity from manual variance work to strategic planning and decision support
- Reduce close cycle time and business review prep from days to hours
- Generate executive narratives automatically instead of writing from scratch
5. How long does it take to see real impact, and what has to change on our side?
You don't need a multi-year "data transformation." Most teams see meaningful impact once:
- Priority data sources (ERP, planning, operational systems) are wired into a unified model
- Core KPIs and definitions are agreed across FP&A, accounting, operations, and leadership
- A handful of high-value workflows (monthly variance analysis, CFO narratives, budget monitoring) are rebuilt on top of the new stack
The bigger change is cultural: analysts move from building reports to designing models and workflows; business users stop screenshotting dashboards and start interrogating the live system. If you're not ready to change how decisions are made, the tech alone won't save you
6. How is this different from our current setup: data warehouse + BI + planning tools?
Your current stack probably looks like this: data warehouse in the middle, BI on top, planning tools on the side, and Excel everywhere. It works, but only if you're willing to pay with time and manual effort.Finance Intelligence assumes that's table stakes and pushes further:
- One financial semantic layer instead of every team rebuilding metrics on their own
- Conversational access so questions don't bottleneck on the analytics team
- Agentic monitoring so the system surfaces issues instead of waiting for someone to notice them
If your existing stack already does all of that, you don't need this. If it doesn't, that's the gap this hub is designed to expose and close.
7. What is the best AI analytics platform for finance?
The best AI analytics platform for finance depends on what you're trying to solve. If you need basic visualization, stick with Tableau or Power BI. If you need planning and budgeting, use Anaplan or Adaptive. But if you need intelligent variance analysis, automated root cause investigation, proactive monitoring, and executive narrative generation—capabilities that explain why metrics changed and surface issues before you ask—you need an agentic analytics platform purpose-built for finance. That's what Tellius delivers: a unified platform that sits on top of your existing systems, understands finance semantics natively, and deploys AI agents that work 24/7 to investigate, alert, and explain.
8. How does AI analytics compare to traditional BI for finance?
Traditional BI tools (Tableau, Power BI, Qlik) visualize financial data—showing dashboards and charts that display what happened. AI analytics platforms like Tellius explain financial data—automatically decomposing variances into drivers, quantifying contribution, and generating plain-English narratives ready for leadership. BI is reactive (you check dashboards); AI analytics is proactive (agents monitor and alert). Most finance teams keep their BI tools for visualization and add Tellius for intelligence—using BI for "what happened" and Tellius for "why it happened and what to do about it."
9. What's the difference between conversational and agentic analytics for finance?
Conversational analytics lets you ask questions in plain English and get instant answers with automated root cause analysis. You drive the inquiry: "Why is EBITDA 5% below forecast?" Agentic analytics means AI agents work autonomously without being asked—continuously monitoring KPIs, detecting anomalies, investigating root causes, and alerting you proactively. Conversational is human-initiated; agentic is AI-initiated. You need conversational as the foundation for democratized data access, then add agentic for continuous intelligence and early warning. Together, they shift finance from reactive reporting to proactive decision support.
10. Can I use Tellius on top of my existing planning tools like Anaplan or Adaptive without replacing them?
Yes. Tellius is designed to complement, not replace, your existing FP&A stack. It sits on top of your planning tools (Anaplan, Adaptive, Workday, Planful), ERP systems (NetSuite, SAP, Oracle), and data warehouses (Snowflake, Databricks)—adding an intelligence layer that automates variance analysis, root cause investigation, and proactive monitoring. Your planning workflows, budget models, and forecasting processes remain unchanged. Tellius simply makes the analysis of that data faster and more automated. Many finance teams describe it as "adding AI on top of Anaplan."
11. How does Tellius ensure governance and auditability for finance analysis?
Tellius provides full governance through its semantic layer—ensuring that "revenue," "EBITDA," or "headcount" are defined consistently across all users and all analyses. Every question asked, every answer delivered, and every insight surfaced by AI agents is logged with a complete audit trail showing data sources, calculations performed, and users involved. For SOX compliance or internal audit requirements, this means variance analysis is auditable and repeatable. Same question asked by two different analysts always produces the same answer using the same governed definitions—eliminating the "five analysts, five different numbers" problem.
12. How long does it take to deploy Tellius for finance teams?
Typical deployment takes 8-12 weeks from kickoff to first production use case. This includes data integration (connecting to ERP, planning tools, data warehouses), semantic layer configuration (defining accounts, hierarchies, business logic), and initial use case implementation (variance analysis, CFO narratives, or proactive monitoring). First value is often delivered within 4-6 weeks when starting with a focused use case like monthly variance analysis. Unlike custom-built analytics solutions that take 12-18 months, Tellius is pre-built for finance use cases and designed for rapid deployment.
How it works
How Finance Intelligence Works
60-90
Step 1: Unified Data Integration
37
Step 2: Ask Questions in Plain English
Step 3: Deploy AI Agents
Step 4: Receive Proactive Insights & Recommendations
Ready to Deploy Finance Intelligence?
Join leading finance teams using AI agents to monitor 24/7, investigate automatically, and deliver proactive insights—reducing variance analysis time by 70-85% while protecting millions in budget performance.
Breakthrough Ideas, Right at Your Fingertips
Dig into our latest guides, webinars, whitepapers, and best practices that help you leverage data for tangible, scalable results.
.png)
ThoughtSpot alternative: migrating from ThoughtSpot to Tellius (2026 guide)
Many organizations that adopted search-driven analytics are now looking for platforms that go beyond answering questions to proactively investigating business performance and delivering finished analytical work. This migration guide explains how to move from ThoughtSpot to Tellius while preserving trusted metrics, semantic definitions, dashboards, and user adoption. It compares the two platforms across conversational analytics, automated insight discovery, root cause analysis, AI agents, governance, semantic context, and enterprise scalability.
.webp)
Agentic AI in Supply Chain: Use Cases, Platforms, and What's Shipping (2026)
Supply chain leaders are moving beyond predictive dashboards and generative AI toward agentic systems that can monitor operations, investigate disruptions, recommend actions, and orchestrate workflows across the enterprise. This guide explores the state of agentic AI in supply chain management in 2026, comparing the leading platforms and highlighting the use cases that are delivering measurable business value today. Learn how organizations are deploying AI agents for demand sensing, inventory optimization, supplier risk monitoring, procurement intelligence, logistics planning, production scheduling, transportation optimization, and exception management.
.webp)
Best FP&A Software in 2026: The Tools That Plan, and the Layer That Explains Why
Modern FP&A teams need more than planning software—they need the ability to explain financial performance, identify the drivers behind change, and act faster on emerging risks and opportunities. This buyer's guide compares the leading FP&A platforms in 2026 across budgeting, forecasting, scenario modeling, financial consolidation, reporting, AI-assisted planning, and enterprise analytics. It also introduces a new evaluation framework: distinguishing the systems that plan from the intelligence layer that explains why.
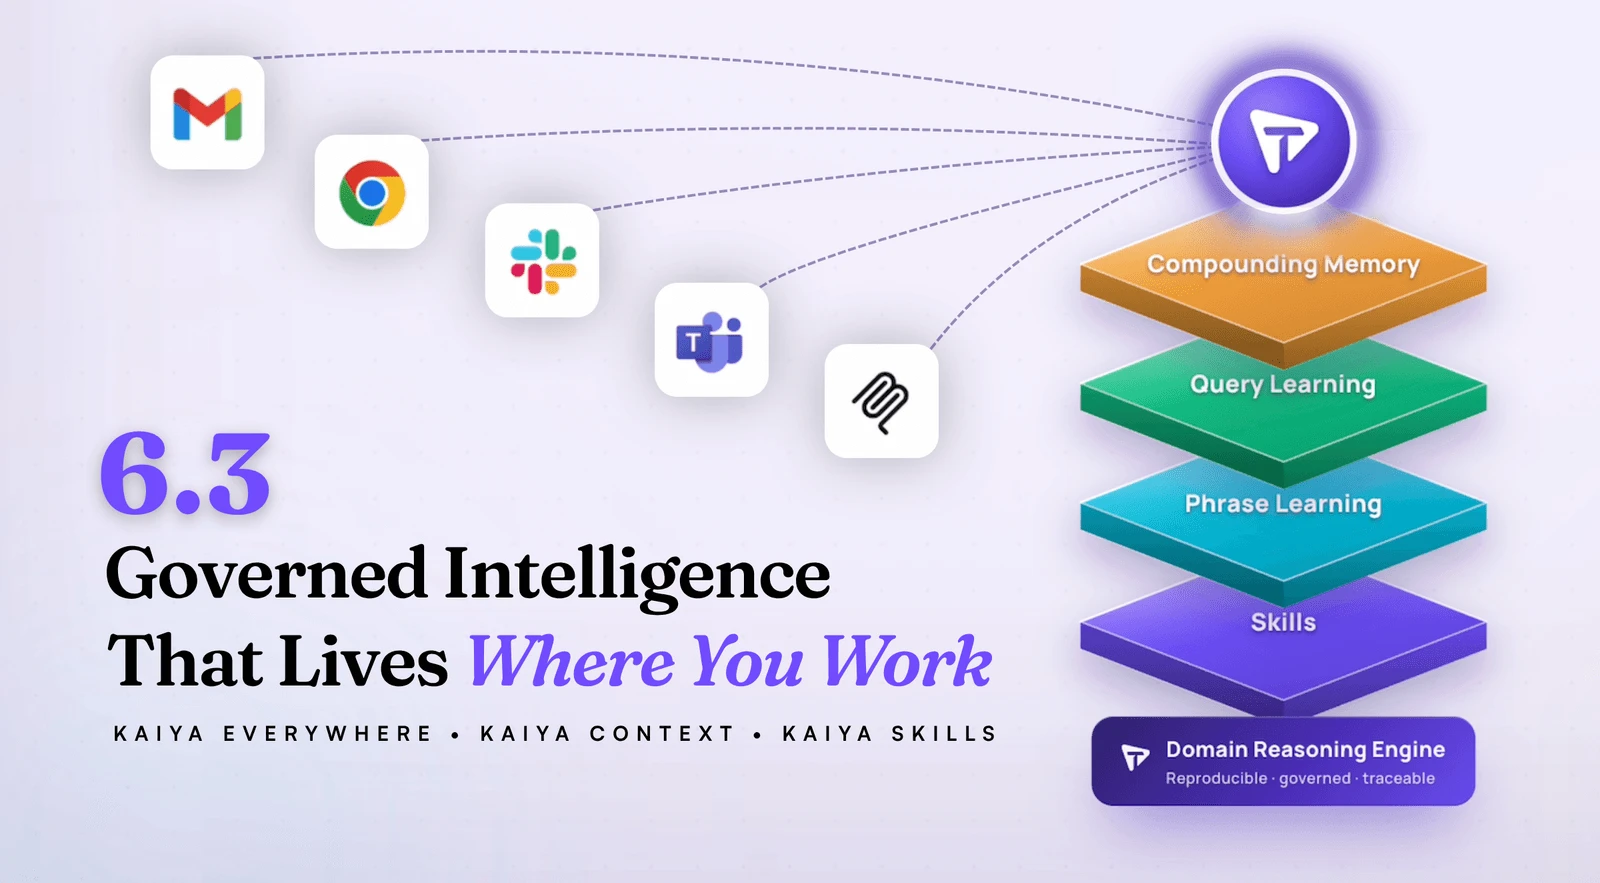
Tellius 6.3: Kaiya Everywhere, Grounded in Your Business
AI answers are only useful when they're grounded in your business and available where decisions actually happen. See how Tellius 6.3 delivers fast, traceable insights across pharma, CPG, RevOps, and FP&A — right in the tools your team already uses.


PMSA Fall Symposium 2025 in Boston
Join Tellius at PMSA Oct 2–3 for two can’t-miss sessions: Regeneron on how they’re scaling GenAI across the pharma brand lifecycle, and a hands-on workshop on AI Agents for sales, HCP targeting, and access wins. Discover how AI-powered analytics drives commercial success.
.webp)
Tellius AI Agents: Driving Real Analysis, Action, + Enterprise Intelligence
Tellius AI Agents transform business intelligence with dedicated AI squads that automate complex analysis workflows without coding. Join our April 17th webinar to discover how these agents can 100x enterprise productivity by turning questions into actionable insights, adapting to your unique business processes, and driving decisions with trustworthy, explainable intelligence.