
Every Monday morning, somewhere in your org, an analyst is rebuilding last week’s territory report from scratch. They pull the data, filter by region, rank by performance, cross-reference call history, build the deck, and email it out. Four hours of work that produces the same structure with different numbers. Every single week.
What is Kaiya Missions?
Kaiya Missions is an objective-driven agentic workflow built into the Tellius platform. You give Kaiya an objective — “Monitor territory performance for Brand X and flag what needs attention” — a schedule, and an output format. Kaiya proposes the full plan: data sources, analyses, metrics, and drill-down paths. You review and approve before anything runs.
Every run is a fresh investigation against current data — across both your structured data warehouse and unstructured sources like call transcripts, CRM notes, and support tickets. Kaiya determines which metrics to drill into, surfaces anomalies, identifies root causes, and packages findings and recommendations into a polished presentation that lands in your inbox.
Unlike scheduled reports that re-render a static dashboard, each Mission run reasons about what matters right now. Other BI tools schedule a screenshot. Kaiya Missions schedule an investigation.
This is what we mean by objective-driven analytics. The recurring deep dives your team runs manually today, automated and delivered.

The problem on both sides
The analyst and the executive have mirror-image versions of the same frustration.
The analyst knows exactly what the investigation should look like. Same drill-downs, same output format, same recipients. They could do it in their sleep — and that’s the problem. The work requires reasoning (which metrics matter this week, what changed, what to flag), so you can’t automate it with a cron job and a SQL query. But it doesn’t require new reasoning. It’s the same analytical structure applied to fresh data. Four hours every Monday. 208 hours a year. Same structure, different numbers.
The executive wants proactive intelligence, not another dashboard to remember to check. The analysis exists — someone ran it last week. But it arrived Thursday afternoon, two days after the decision window closed. By the time the slide hits their inbox, the data is stale and the recommendation is moot. They don’t need better dashboards. They need finished analysis delivered before they ask for it.
The gap between them isn’t a feature request. It’s an entire workflow category that didn’t exist until now. BI tools can display data. AI assistants can answer one-off questions. But neither can run a multi-step investigation on its own, reason about what changed in the data, determine which drill-down paths matter, generate root cause explanations, and deliver polished, ready-to-forward artifacts on a schedule.
Why the industry is moving from queries to objectives
Most enterprise analytics is still reactive. Someone asks a question, an analyst runs the query, builds a slide, emails the result, and waits for the next question. Even with AI copilots in the mix, the workflow is still human-initiated and single-shot.
The broader AI landscape is shifting. Gartner’s 2026 Hype Cycle for Agentic AI draws a useful distinction between process-oriented automation (doing the same steps faster) and what they describe as goal-driven, multi-step workflows where agents reason about the path rather than following a script. Their research finds that most organizations are still using AI agents to automate existing workflows rather than rethinking how work gets done.
That distinction maps cleanly to analytics. A scheduled Tableau report is process automation — same dashboard, same render, same email. An objective-driven Mission is structurally different: the system starts from a goal, reasons about what to investigate given the current data, adapts its drill-down path based on what it finds, and delivers findings. Not charts — findings.
The shift is from analytics that waits to be asked to analytics that pursues objectives. And analytics is one of the first domains where this shift delivers measurable ROI, because the pattern of recurring, multi-step investigations is so common and so expensive in analyst hours.

How Kaiya Missions work
A Mission moves through five steps. Each one has a human checkpoint.
1. Objective
You describe what you need in plain language: “Weekly HCP targeting report for Brand X Southeast. Rank by decile and propensity. Cross-reference call history. Flag territories with coverage gaps.” That’s it. No workflow builder. No drag-and-drop.
2. Plan
Kaiya proposes the full investigation plan — which data sources to query (structured and unstructured), which analyses to run, which metrics to track, what drill-down paths to follow. You see the entire plan before anything executes.
3. Approve
You review the plan, modify it conversationally (“add competitor share data,” “exclude specialty pharmacies”), and approve. Nothing runs until you sign off. This is the trust mechanism: the plan is explicit, auditable, and changeable.
4. Execute
On schedule — daily, weekly, monthly, or custom cadence — Kaiya runs a fresh investigation against current data. Each run is genuinely new: Kaiya determines which metrics to drill into based on what the data shows this run, surfaces anomalies, identifies root causes, and assembles findings. It’s not re-rendering a saved view. It’s re-investigating.
5. Deliver
The output lands in your inbox as a polished presentation: PowerPoint in your corporate template (Kaiya extracts brand specs from an uploaded PPTX), PDF, or structured email with a TL;DR summary and the full artifact attached. Storyline-driven — executive summary, key findings, supporting analysis, recommendations. You can reorder sections and modify the narrative in natural language. The goal: no edits necessary before forwarding to your VP.
Others subscribe to receive the same output. Row-level security is preserved — a regional director and a national VP receiving the same Mission see different data based on their access permissions. One investigation, many recipients.
Before each run, pre-flight validation checks the schema. If a column was renamed, a table dropped, or a metric formula references something that no longer exists, the Mission aborts before compute, marks the run as failed with specific error context, and notifies the owner. No silent delivery of wrong numbers.
.png)
How Missions compare
Why Missions get smarter over time: the intelligence stack
A Mission isn’t a scheduled script. It runs on top of Tellius’s full semantic intelligence stack — and that stack compounds with every interaction your team has with the platform.
The semantic layer underneath
Every Mission inherits the governed Business View: centralized metric definitions, column classifications, join logic, access controls. “Revenue” means the same thing in a Monday morning Mission that it does in an ad-hoc Kaiya conversation or an executive’s app. One definition, enforced everywhere.
But the semantic layer in Tellius goes deeper than a metrics catalog. It’s a four-layer architecture:
The metrics layer holds centralized, versioned KPI definitions. When the CFO says “gross margin,” Kaiya uses the same formula in every Mission, every app, every query. No analyst has to remember which spreadsheet has the “right” version.
The ontology layer maps formal business entities and their relationships: Customer buys Product, Doctor prescribes Drug, Territory rolls up to Region. These aren’t just labels. They’re how Kaiya navigates your data. When a Mission investigates “why did Southeast underperform,” the ontology tells Kaiya that Southeast contains specific territories, that territories have assigned reps, and that reps have call activity data in a different source. The drill-down path comes from the ontology, not from a hardcoded workflow.
The knowledge graph connects structured data with unstructured evidence — contracts, call transcripts, support tickets, CRM notes — via entity links. A Mission investigating account health doesn’t just query your revenue table. It can pull sentiment from recent Gong calls, flag open support tickets, and cross-reference renewal dates from contract documents. Structured and unstructured, in the same investigation.
The context and memory layer carries conversational state, user role, prior filters, and accumulated corrections across sessions.
Persistent Memory
Every correction and business rule your team teaches Kaiya applies permanently across the org. “When I say ‘active HCP,’ I mean at least one prescription in the last 90 days.” Define it once. It applies to every Mission, every app, every query, for every user — without anyone remembering to apply it manually.
Five memory types keep this organized: ontological (entity definitions), instructional hard (rules that always apply), instructional soft (preferences that apply by default but can be overridden), reference (lookup tables and mappings), and insight (saved analytical observations Kaiya can cite in future runs).
What this means in practice: a Mission running in month six of your deployment is working with an intelligence layer that didn’t exist in month one. Every correction, business rule, and glossary upload your team contributed along the way is baked in.
Auto BV routing
A single Mission can span multiple data sources mid-investigation. Ask about promo lift in one section, then inventory availability in another. Kaiya switches Business Views automatically. Filters, time ranges, and analytical context carry forward. No manual switching, no context loss.
Semantic Cache
For structurally similar questions — same analysis pattern, different filters or time period — Kaiya recognizes the pattern and responds from cache. Sub-second where it matters, full investigation where it counts.

What this looks like in practice
Pharma: Weekly HCP targeting report
A commercial ops lead creates a Mission: “Weekly HCP targeting report for Brand X, Southeast. Rank by decile and propensity. Cross-reference call history. Flag territories with coverage gaps. Deliver as PowerPoint using our template.”
Kaiya proposes a plan: pull TRx (Total Prescriptions) and NBRx (New-to-Brand Prescriptions) from the IQVIA dataset, overlay call activity from Veeva CRM, segment HCPs by decile, identify D1-D3 prescribers with low SOB (Share of Business), and flag territories where reach is below target. The lead approves.
Every Monday at 7am, a polished deck lands in six regional directors’ inboxes. Executive summary, territory rankings, anomaly flags, coverage gap recommendations. Each RD sees only their territories — row-level security enforced in the delivered artifact.
Before: 4 hours/week × 52 weeks = 208 analyst hours/year.
After: Zero after setup.
CPG: Monthly brand performance deep dive
A category manager sets up a Mission: “Monthly brand performance review for the Snacks portfolio. Decompose growth into distribution, price, velocity, and NPD contribution. Compare promo ROI by retailer. Flag private label share gains. Deliver as PDF with executive summary.”
Each month, Kaiya pulls NielsenIQ syndicated data, overlays retailer POS from Walmart Luminate, runs growth decomposition, and identifies which retailers are driving — or dragging — brand performance. The PDF includes a narrative arc: where we’re winning, where we’re losing, why, and what to do about it.
FP&A: Monthly finance close package
An FP&A director creates a Mission: “Monthly close package. Break down EBITDA variance into price, volume, and mix by business unit. Flag any cost center more than 10% over budget. Include forecast accuracy trend vs. AOP. Deliver as PowerPoint.”
Every close, Kaiya investigates the current GL data — not just re-rendering a saved dashboard, but decomposing the variance fresh, identifying which cost categories are driving the miss, and producing a storyline-driven deck the CFO can walk into a board meeting with.
Before: 3-5 days of analyst work every close. Half of it formatting slides.
After: Delivered to inbox on close day. Analyst reviews and forwards.
RevOps / SaaS: Weekly pipeline pulse
A RevOps lead sets up a Mission: “Weekly pipeline pulse. Track forecast changes by stage, flag deals that moved backward, identify reps with pipeline coverage below 3x. Cross-reference Gong call sentiment on at-risk deals. Deliver as structured email with TL;DR.”
Every Monday, leadership gets a concise email: pipeline moved from $14.2M to $13.8M, three enterprise deals slipped from Commit to Best Case, two reps below coverage threshold, and Gong sentiment on the three slipped deals is trending negative (call transcripts flagged “budget freeze” and “delayed timeline”). Structured and unstructured data, investigated together.
What teams will ask
“How is this different from scheduled reports in Tableau or Power BI?”
Tableau and Power BI schedule a static view of a pre-built dashboard. The dashboard has to exist first — someone decided the charts, filters, and layout. The scheduled report delivers what was already configured. It doesn’t investigate, adapt, or reason about what matters this week versus last week.
A Mission starts from an objective, determines which analyses to run, which metrics to drill into, what root causes to surface, and packages a fresh investigation into a formatted deliverable. The output includes findings, root causes, and recommendations — not a chart rendering.
“How do I trust analysis that runs without anyone watching?”
When you create a Mission, Kaiya proposes the full plan: data sources, analyses, metrics, drill-down paths. You review and approve before it runs. Every scheduled run follows the approved plan against fresh data. Every step is logged — queries executed, datasets accessed, intermediate results. Failed or partially failed runs notify the owner with specific error context.
Pre-flight validation catches schema changes before compute. Persistent Memory means every correction your team has made applies automatically. The Mission doesn’t silently deliver incorrect results.
“Can it actually monitor proactively, or does it just run on a timer?”
Today, Missions run on a time-based schedule. Every run analyzes current data from scratch, surfaces anomalies, identifies root causes, and flags what changed since the last run. Proactive in the sense that nobody has to remember to ask — the intelligence arrives.
Metric-triggered execution — where a condition like “NRx below threshold” or “pipeline coverage drops below 3x” activates the Mission automatically — is coming in a near-term update. The scheduled cadence already catches most business-critical changes within the monitoring window. Triggers tighten that window to real-time.
“Does it only work on structured data?”
No. Missions run across both structured and unstructured data. Kaiya can pull from your data warehouse (Snowflake, BigQuery, Redshift) alongside unstructured sources — Gong call transcripts, Salesforce CRM notes, support tickets, contract documents via Google Drive or S3. The knowledge graph links entities across both, so a single Mission can cross-reference revenue data with call sentiment or support ticket themes.
“What format does the output come in?”
PowerPoint with your uploaded corporate template (your fonts, colors, layout — Kaiya extracts brand specs from a PPTX you provide), PDF, or structured email with TL;DR summary and the full artifact attached. The output is storyline-driven: executive summary, key findings, supporting analysis, recommendations. You can reorder sections and modify the narrative in natural language. The goal is a polished presentation you’d forward to leadership without edits.
“We already have agentic workflows in Tellius. What’s new?”
Two things. First, scheduled execution — previously, agentic workflows ran on-demand inside a conversation. Now they run on a recurring cadence and deliver finished artifacts automatically. Second, the output format — Missions deliver storyline-driven PowerPoint, PDF, or structured email, not conversational thread output. Same analytical engine. Now it runs on your schedule and delivers to your inbox.
What comes next
Missions ship with time-based scheduling: daily, weekly, monthly, custom cadence. Each run performs a full investigation against current data — anomalies, root causes, recommendations, delivered as polished presentations.
Next: metric-triggered execution. Define a condition — NRx drops below threshold, pipeline coverage falls below 3x, market share moves more than 2 points — and the Mission activates automatically when the condition is met. No schedule required. The system watches, detects, investigates, and delivers.
Analytics that works while you sleep. That’s the direction.
Tellius is the agentic analytics platform purpose-built for teams that need recurring, deep analytical investigations — across structured and unstructured data — delivered automatically as polished presentations.
Not dashboards that refresh. Not alerts that ping. Finished analysis that arrives ready to act on.
Get release updates delivered straight to your inbox.
No spam—we hate it as much as you do!

Introducing Kaiya Missions: objective-driven agentic workflows that deliver polished presentations on your schedule

Scheduled BI reports re-render a static dashboard that someone pre-built. Missions run a fresh investigation each time — determining which metrics to drill into, surfacing anomalies, identifying root causes, and packaging findings and recommendations. The output adapts to what the current data shows.
PowerPoint (using your uploaded corporate template), PDF, or structured email with TL;DR summary and full artifact attached. Outputs follow a storyline structure: executive summary, key findings, supporting analysis, and recommendations.
Yes. Missions work across structured warehouse data and unstructured sources like Gong call transcripts, Salesforce CRM notes, support tickets, and contract documents. The knowledge graph links entities across both, so a single Mission can cross-reference revenue numbers with call sentiment or support ticket themes.
At launch, Missions run on a time-based schedule: daily, weekly, or monthly. Each run analyzes current data from scratch and flags what changed. Metric-triggered execution, where a condition like “NRx below threshold” activates the Mission automatically, is coming in a near-term update.
Every Mission inherits the full semantic stack: centralized metric definitions, ontological entity relationships, a knowledge graph linking structured and unstructured data, and a context layer with accumulated corrections. This means Missions use the same governed business logic as every other Tellius interaction.
Pre-flight validation runs before every execution. If a column was renamed, a table dropped, or a metric formula references something that no longer exists, the Mission aborts before compute, marks the run as failed with specific error context, and notifies the owner. No silent delivery of incorrect results.
Yes. The owner creates and schedules the Mission. Others subscribe. Row-level security is preserved in all delivered artifacts — two subscribers may see different data based on their access permissions. One investigation, many recipients.
You review and approve the full plan before the Mission ever runs: data sources, analyses, metrics, drill-down paths. Every run follows the approved plan. Every step is logged with queries executed, datasets accessed, and intermediate results.
Every correction and business rule your team teaches Kaiya — metric definitions, exclusion rules, entity synonyms, business preferences — applies automatically to every Mission run. No manual updates when definitions change. The intelligence compounds as your team uses the platform.
Tableau and Power BI schedule delivery of a pre-built dashboard — same view, no reasoning. Missions start from an objective, run a full multi-step investigation with root cause analysis and anomaly detection, and deliver storyline-driven artifacts with findings and recommendations. The difference is the difference between a screenshot and an investigation.
A few things separate real agentic analytics from rebranded dashboards: can it run multi-step investigations from an objective (not just answer a single question)? Does it have a governed semantic layer so definitions stay consistent? Can it work across structured and unstructured data? Does it deliver formatted artifacts suitable for leadership, or just raw data exports? And does the platform learn from corrections over time, or start from zero every session? If the platform schedules dashboard re-renders instead of investigations, it’s not agentic — it’s automation with better marketing.
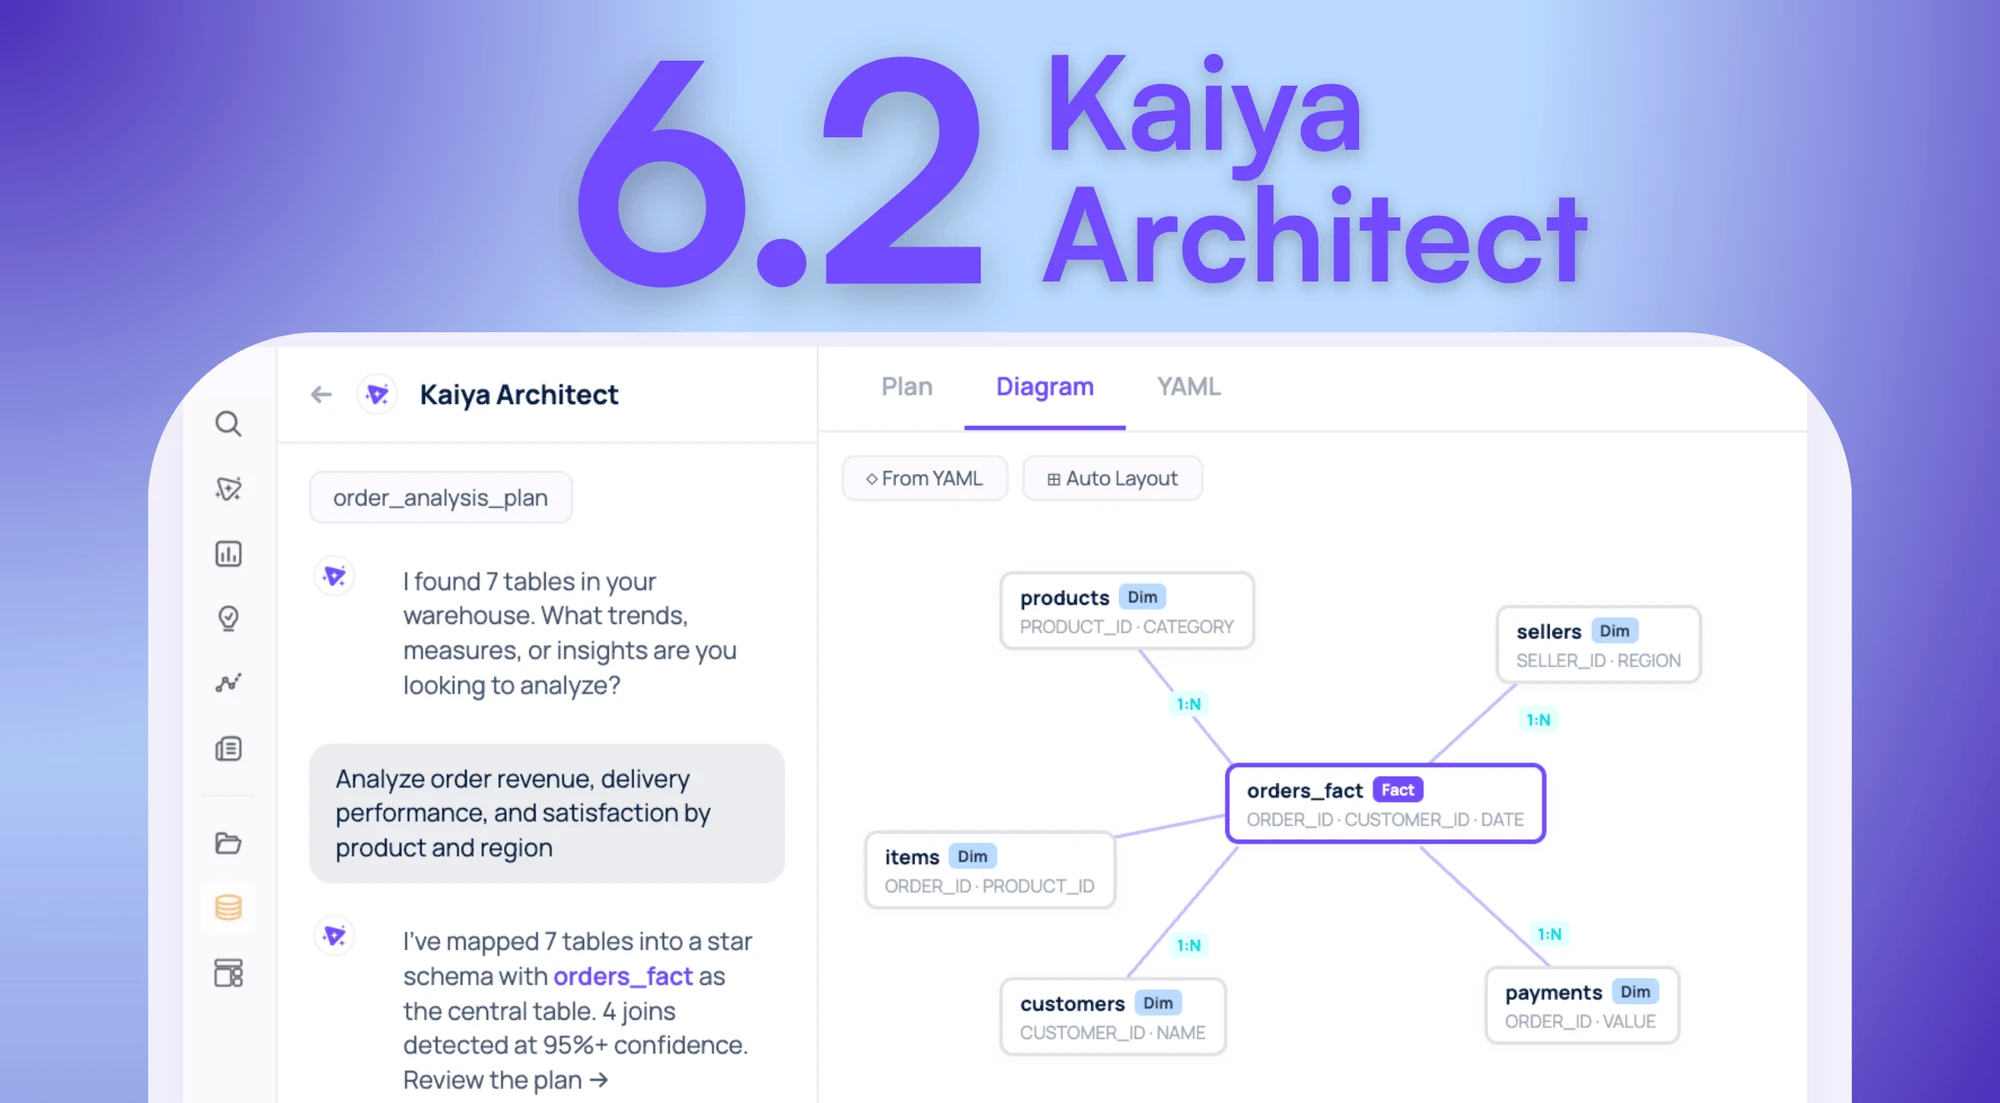
Your Data Is In The Warehouse. The Model That Makes It Useful Isn’t. Introducing Kaiya Architect.
Tellius introduces Kaiya Architect, an AI data modeling agent that builds governed semantic layers from raw warehouse data through a single conversation — eliminating the multi-week engineering bottleneck between business need and analysis.