Best Gross-to-Net (GTN) Platforms for Pharma in 2026: A Buyer's Guide by Job-to-Be-Done
.webp)

Gross-to-net (GTN) platforms are the software systems pharmaceutical and life-sciences companies use to calculate, forecast, and protect the difference between a drug's list price (WAC) and the net revenue the manufacturer actually keeps after wholesaler chargebacks, commercial rebates, Medicaid and Medicare Part D obligations, 340B discounts, and copay support. In US pharma, that gap is enormous — the gross-to-net "bubble" reached an estimated $356 billion in 2024 (Drug Channels Institute) — and it is widening in complexity: in a 2026 Model N survey, 99% of life-sciences leaders said gross-to-net has become more complex, with PBMs named the leading contributor (Model N).
No single platform is "best" at all of this, because GTN is really five different jobs. This guide compares the best platforms across all five:
- GTN system of record / transactional compliance — calculating and adjudicating rebates, chargebacks, Medicaid, 340B, and government pricing (AMP, Best Price, ASP), audit-ready.
- GTN data foundation — mastering channel, contract, patient, and pricing data into one trusted source the rest of the stack runs on.
- GTN forecasting & scenario planning — modeling the waterfall forward and running what-if scenarios across payer mix and contract changes.
- GTN intelligence & early-warning — detecting when the net-revenue mix is moving and explaining why, before quarter-close.
- GTN revenue-leakage protection — stopping copay, accumulator, and alternative-funding leakage in real time before money goes out the door.
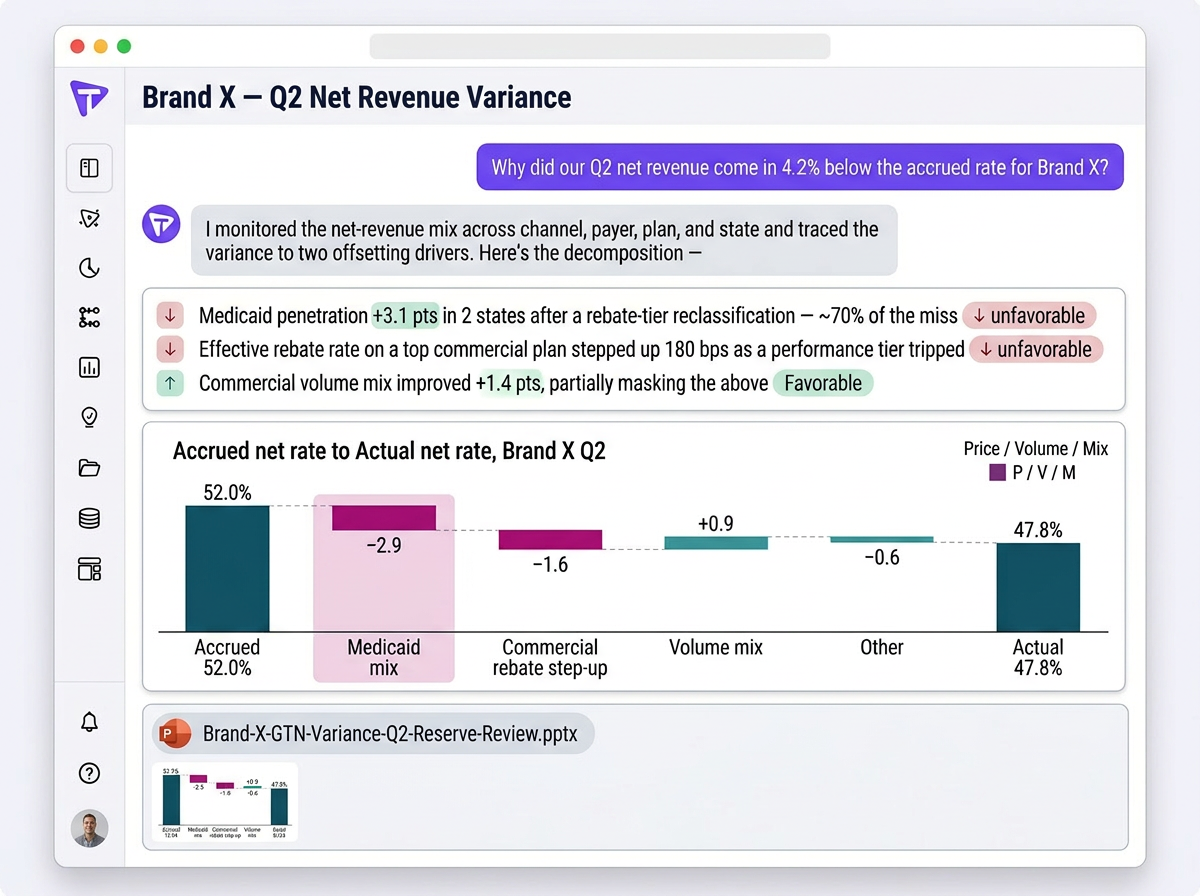
Most enterprises run more than one. Within this landscape, Tellius is the explainable early-warning layer — Decision AI that reasons like a seasoned GTN analyst. When the net-revenue mix starts to drift — Medicaid utilization running ahead of accrual, a commercial plan stepping up its effective rebate rate, a brand slipping from tier 2 to tier 3 on a major formulary — Tellius catches it without being asked, because its agents watch the GTN metrics around the clock. It then runs the full investigation the way a seasoned analyst would: planning the multi-step decomposition, working the accrual-to-actual variance into its price, volume, and mix drivers across the channel/payer/plan grid, and pinning the movement to the contracts and events behind it. Because the math runs on a deterministic reasoning engine rather than an LLM guessing at SQL, every figure reconciles in the close and traces in the audit. And it returns the answer as finished work — a brief the GTN and finance teams can take straight into the reserve review, not a chart to interpret. It is the only platform in this comparison built to answer the why behind a gross-to-net movement, in plain language and before the quarter closes — rather than to calculate, store, or forecast the waterfall itself.
Who Needs a GTN Diagnosis Layer
GTN looks different from every seat, but the pain rhymes: a number moves, and someone has to explain it fast. These are the roles that feel it.
- GTN forecasting lead — owns the accrual and the reserve. The variance that surfaces at close, when the explanation is an autopsy instead of a course correction.
- Market-access finance — lives in effective-rebate-rate detail. Contract-level moves that hide inside an aggregate net number until they're big enough to hurt.
- Brand finance — reconciles what the brand booked against what the channel paid. The three-day wait between "why did Northeast Part D net fall" and an answer.
- FP&A director / controller — defends the reserve to auditors and the board. A narrative that sounds right but can't be reproduced.
- Commercial ops / analytics — fields every "can you pull this." A team assembling variance explanations by hand instead of acting on them.
- VP, commercial finance — owns the quarter, hates surprises. Learning about a material GTN miss in the meeting where they're expected to explain it.
Quick Reference: Best GTN Platform by Job
Use this table to jump to the platform built for your primary GTN job. It's ordered by the question GTN teams ask most often — why did the number move? — which is a diagnosis problem before it's a forecasting, processing, or data-mastering one. The deeper-stack jobs follow, each with the platform that owns it.
Most enterprises run a combination — for example, IntegriChain mastering the channel and contract data, Model N adjudicating rebates and government pricing on top of it, Anaplan modeling the forward waterfall for reserves, and Tellius reasoning across all of them to flag and explain an accrual-to-actual variance before it surfaces at close. These are complementary layers, not substitutes — which is why the rest of this guide is organized by job, not by a single ranking.
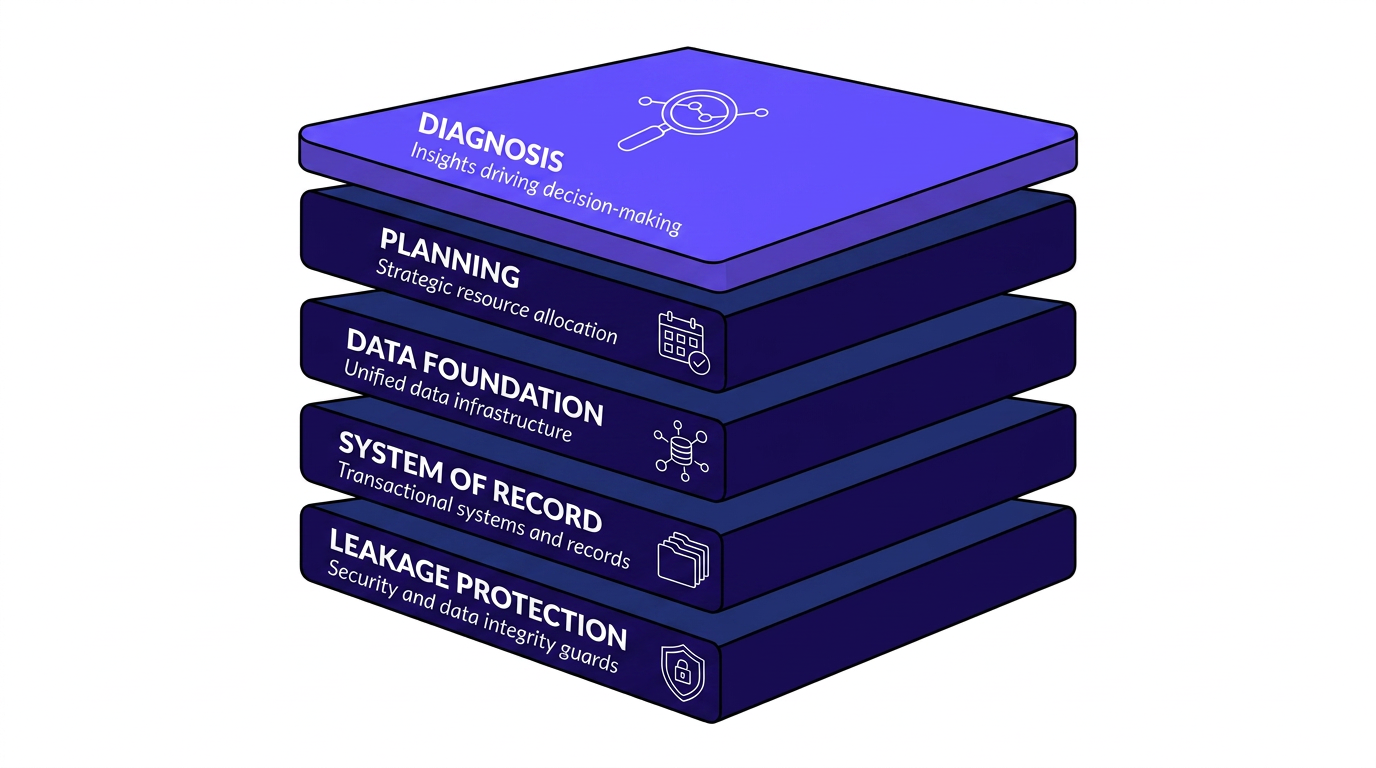
The Five Categories of GTN Platform
The eleven platforms in this guide aren't interchangeable. They occupy five functional categories, each doing a distinct job in the gross-to-net stack. Understanding the categories matters more than memorizing the vendors, because the most common buying mistake in GTN is evaluating a platform from one category against a need that belongs to another — judging a forecasting tool by its compliance depth, or a system of record by how well it explains a variance.
The categories below are ordered the way a GTN question actually travels: it starts as "why is the number moving?" (diagnosis), becomes "what will it be?" (planning), and rests on the data and transactional systems underneath (data foundation, system of record), with leakage protection guarding the patient-facing edge.
Three distinctions are where buyers most often conflate categories — and each one hides a costly assumption.
Owning a forecasting platform doesn't cover the diagnosis job — and most teams assume it does. Anaplan or Pigment will tell you what net revenue should be next quarter under your assumptions. Neither one notices, three weeks into the quarter, that Medicaid utilization is running 8 points ahead of the accrual basis because a single state reclassified your product's rebate tier — then traces the miss to that contract and quantifies the exposure before close. That gap between the modeled forecast and the live signal against it is where reserve surprises are born, and it's nobody's job in the planning stack to watch it. Structured reserve what-if lives in planning; ad-hoc pressure-testing of an emerging rebate trend lives in diagnosis.
Mastering the data and adjudicating against it are two different systems — and buying one expecting the other is a common, expensive surprise. Resolving a plan into one governed entity across IQVIA, claims, and chargeback feeds (the data foundation job) does not calculate what you owe that plan under contract and government-pricing rules (the system-of-record job). IntegriChain and IQVIA build the trusted data layer; Model N and IMA360 run the compliance engines on top of it. Teams that assume their data-aggregation platform will also adjudicate Best Price or produce an audit-ready Medicaid CMS-64 reconciliation discover the gap late, usually mid-implementation.
Leakage protection is a category most stacks don't yet have a slot for. Copay maximizers, accumulator adjustment programs, and alternative funding programs (AFPs) emerged as a distinct GTN threat only over the last few years — siphoning manufacturer copay dollars without moving net script volume. The back-office system of record books that spend after the fact; it can't stop it. A purpose-built protection category formed to intervene in real time, before the claim is paid — which is why it sits apart from every other layer here.
These categories are complementary, not competitive substitutes. The strongest GTN operations run one platform from several of them, layered. The evaluation that follows covers all five groups, with the deepest treatment reserved for the diagnosis layer — the dimension this guide weights most heavily, and the one most GTN stacks are missing.
GTN Platform Comparison — 11 Capabilities Scored
Here's how the eleven platforms score across eleven GTN capabilities. Diagnosis capabilities run first; the market-presence column sits last, so you can weigh adoption against capability yourself.
No platform owns the whole row, and that's the point of running the comparison by job. Model N and IMA360 hold the compliance and adjudication columns. IntegriChain and IQVIA hold mastered data. Anaplan and Pigment hold forward forecasting and structured reserve scenarios. ConnectiveRx and RIS Rx hold the patient-facing edge. Tellius leads the left side — spotting the drift, monitoring continuously, running the agentic decomposition of why across the channel/payer/plan grid, and letting a finance or market-access user dig in without writing a query — and posts ✗ on adjudication, data mastering, and leakage, because that work belongs to the platforms built for it.
How We Evaluated GTN Platforms
Ten dimensions shaped the scoring. They run in the order a GTN problem tends to surface — the early signal first, the back-office systems that book the deductions last.
1. Early-warning diagnosis and explainability (the dimension we weight most heavily). When net revenue diverges from the accrual basis mid-quarter, does the platform catch it on its own — and can it decompose that variance into price, volume, and mix, then pin the movement to the specific contracts, channels, and market-access events behind it? A number on a dashboard is not a diagnosis. The test is whether the platform explains why the GTN moved, in terms a reserve review can act on, before the quarter closes.
2. Proactive monitoring. Does the platform watch the GTN metrics continuously and surface a variance the moment it emerges — a Medicaid utilization spike, an effective-rebate-rate step-up on a major plan — or does someone have to remember to run the report? The difference is whether the signal finds the team or the team goes looking for it.
3. Agentic multi-step workflows. When something moves, can the platform plan and run the whole investigation — pull the channel and contract data, decompose the variance, test the candidate drivers, draft the writeup — as one orchestrated workflow? Or does it answer a single question and stop, leaving the analyst to chain the next ten steps by hand?
4. Explainable root-cause decomposition. Can the platform break a net-revenue movement into price, volume, and mix and attribute each piece to the contracts, channels, and events responsible — with the work shown, not asserted?
5. Self-service conversational analysis. Can a brand-finance analyst or market-access lead ask a GTN question in plain language — "why did our Part D net drop in the Northeast last month?" — and get a governed answer without routing it through a data team? Tolerance for how people actually type matters: misspellings, synonyms, a drug's brand and molecule name used interchangeably.
6. Ad-hoc predictive what-if. Distinct from formal reserve planning: can the platform read the latest channel-mix and rebate signals and pressure-test where they're heading — a Medicaid penetration trend, effective-rebate-rate creep on a key commercial plan — without standing up a modeling project?
7. Forward forecasting and reserve planning. The structured job: modeling the forward waterfall, setting accruals, running reserve scenarios across payer mix and contract terms, feeding the quarterly reforecast.
8. GTN data mastering. Aggregating and resolving channel, contract, patient, and pricing data — 867/852 wholesaler feeds, claims, chargeback detail, plan-level identifiers — into one governed source the rest of the stack can trust.
9. Transactional adjudication and government-pricing compliance. Calculating and paying rebates and chargebacks; managing AMP, Best Price, and ASP; producing audit-ready Medicaid, Medicare Part D, 340B, and FSS/Tricare compliance.
10. Real-time leakage protection. Catching copay, accumulator, maximizer, and alternative-funding leakage at the pharmacy — before the claim is paid, not after it's booked.
Underpinning all ten is governance and determinism: whether the numbers reconcile and reproduce — same question, same answer — with a traceable path from output back to source. For a function that defends its accruals to auditors and its reserves to the board, a platform that quietly guesses at the math is a liability, however fluent its narrative.
We weight the first four dimensions — the diagnosis cluster — most heavily, because they're what most GTN stacks are missing and what turns a quarter-close surprise into a mid-quarter adjustment. Teams whose first priority is forward planning, data mastering, or transactional compliance should read dimensions 7 through 9 most closely, and may rank these platforms differently as a result.
How to Choose a GTN Platform by Job
GTN platforms don't compete so much as stack, so the right question isn't "which one wins" but "which job is hurting right now." Match the pain to the starting point.
- If your reserves keep getting surprised at close and nobody can say why until the variance is already booked — Tellius is built for this. Its agents monitor the net-revenue mix continuously, catch the drift mid-quarter, and run the multi-step decomposition that traces the miss to the contracts and channels behind it.
- If finance and market-access keep waiting on the data team to answer GTN questions — Tellius is built for this too. Plain-language analysis lets a brand-finance lead ask why Part D net dropped in a region and get a governed, reconcilable answer, not a three-day ticket.
- If you need to model the forward waterfall and run structured reserve scenarios across payer mix and contract terms — Anaplan is the de facto answer. Connected planning is its home turf, and its GTN models are widely deployed across large pharma finance teams.
- If you want that planning depth in a faster, more modern modeling environment — Pigment owns the newer end of this lane, with Workday Adaptive Planning a strong fit for teams already standardized on Workday and willing to build GTN through a partner model.
- If your core problem is fragmented channel, contract, and patient data that never ties out — IntegriChain is the foundational data layer. It masters the feeds the rest of the stack runs on, and its GTN application set sits directly on top.
- If you want GTN operations bundled with market-access data and process expertise — IQVIA brings the managed-service depth, layering its proprietary data and reconciliation under a team that runs the process with you.
- If your pain is transactional — calculating and paying rebates and chargebacks, and staying audit-ready on Medicaid, 340B, and government pricing — Model N is the enterprise system of record, with IMA360 the cloud-native, ERP-agnostic alternative for teams that want a faster implementation and no SAP dependency.
- If manufacturer copay dollars are leaking to maximizers, accumulators, and alternative funding programs — ConnectiveRx owns the patient-facing edge, with RIS Rx the bolt-on option for stopping leakage in real time without ripping out your existing copay vendor.
Best GTN Platform by Category — Key Takeaways
Tellius — best for knowing why GTN moved, before the quarter closes.** Tellius is the only platform in this comparison whose agents monitor the net-revenue mix around the clock, catch the drift on their own, and run the full multi-step investigation a seasoned GTN analyst would — decomposing accrual-to-actual variance into price, volume, and mix across the channel/payer/plan grid and tracing each piece to the contracts and market-access events behind it. Finance and market-access users interrogate it in plain language; the deterministic reasoning engine means every figure reconciles in the close and traces in the audit; and the output lands as a finished brief, not a chart to read. It doesn't adjudicate rebates or master the channel feeds — it sits on top of the systems that do and explains the movement they can only record after the fact. Recognized as a four-time Gartner Magic Quadrant Visionary.
Anaplan — best for forward GTN forecasting and reserve planning.** The de facto connected-planning platform for modeling the waterfall forward and running structured reserve scenarios across payer mix and contract terms. Widely deployed across large pharma finance teams. Best for finance organizations that want one planning environment spanning GTN, demand, and the broader operating plan.
Pigment — best for modern, fast scenario modeling.** A newer EPM platform built for flexible what-if modeling and rolling reforecasts, with a faster, more intuitive modeling experience than legacy planning tools. Best for finance teams that want connected-planning depth without a heavyweight implementation, or that are standardizing net-new.
IntegriChain — best for the GTN data foundation.** The purpose-built net-revenue data platform that masters channel, contract, patient, and pricing data into one governed source, with a GTN application set on top. Best for manufacturers whose core problem is fragmented data that never ties out across feeds.
IQVIA — best for GTN operations with market-access depth.** Pairs a centralized GTN platform with IQVIA's proprietary data and a team that runs the process alongside you. Best for organizations that want managed-service support and market-access context bundled with the technology.
Model N — best enterprise GTN system of record.** One of the most established systems for life-sciences revenue management and compliance — rebates, chargebacks, and government pricing across Medicaid, Medicare, 340B, and FSS/Tricare, audit-ready at enterprise scale. Best for large manufacturers that need deep transactional compliance as the backbone of the stack.
IMA360 — best cloud-native system of record.** An agile, ERP-agnostic alternative for rebate and chargeback processing, with pre-built connectors, real-time deal profitability, and faster go-live. Best for manufacturers that want modern SOR capability without an SAP dependency or a multi-year implementation.
ConnectiveRx — best for real-time copay and patient-program leakage.** Intervenes in the pharmacy workflow to stop copay, accumulator, and misuse leakage before claims are paid, at scale across patient-support programs. Best for brands losing manufacturer copay dollars to maximizers and accumulators.
RIS Rx — best bolt-on leakage protection.** Real-time GTN revenue protection that layers onto existing copay vendors and hubs to catch affordability-program leakage before financial close. Best for teams that want to stop leakage without replacing their current copay infrastructure.
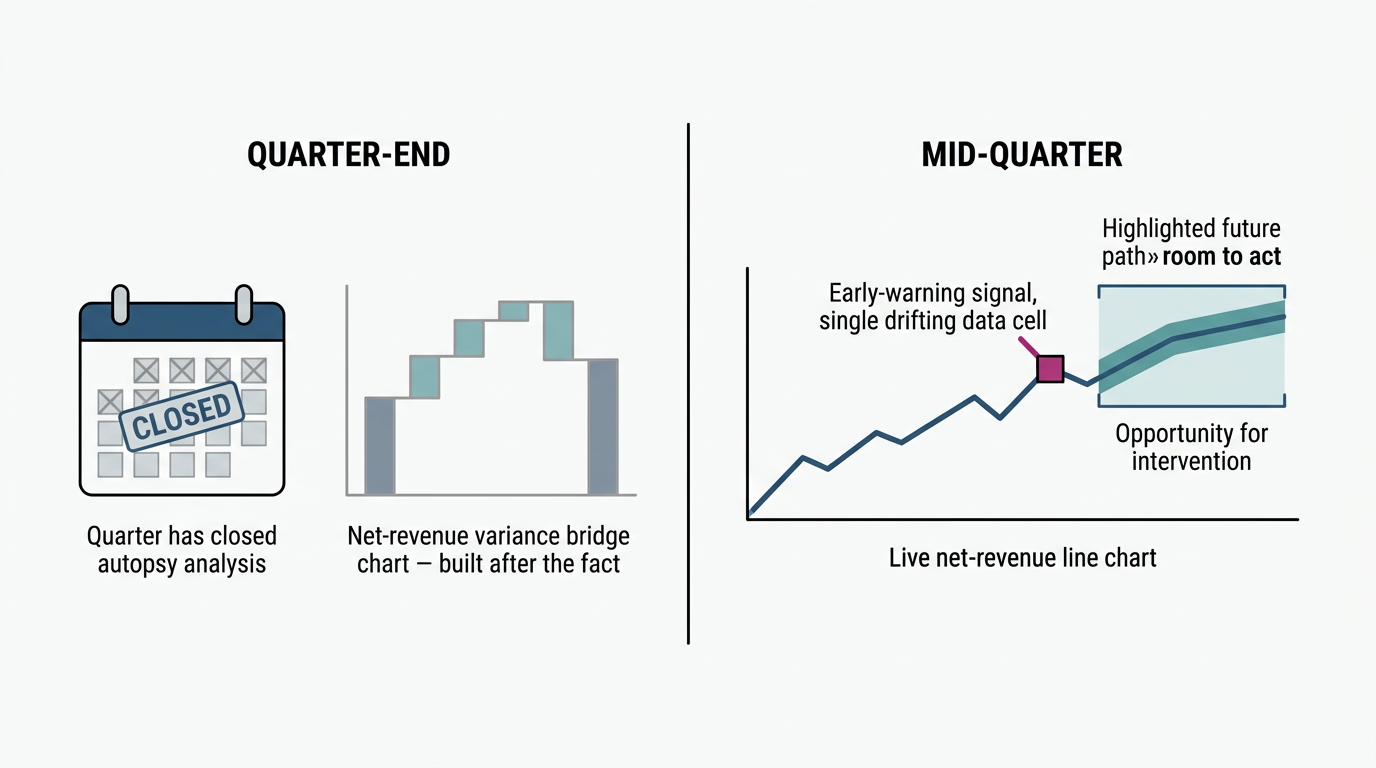
What Separates Early-Warning GTN Intelligence from Quarter-End Variance Reporting
Most GTN reporting is an autopsy. The quarter closes, actuals land, someone builds the bridge between what was accrued and what came in, and the finance team spends a week reconstructing why. By the time the explanation exists, the quarter it explains is over. The reserve was already booked. The adjustment that might have softened the miss was never made, because nobody saw the miss forming.
This is the gap between reporting what happened and catching it while it's happening — and in GTN it's an expensive gap, because the net-revenue mix moves continuously and the deductions that drive it arrive on a lag. A state reclassifies a product's Medicaid rebate tier. A commercial plan quietly steps up its effective rebate rate as a performance threshold trips. Utilization shifts from a commercial book to a government channel where the net is half. None of these announces itself. Each one bleeds into the net number gradually, and on a quarterly cadence it surfaces as a single unwelcome variance with a dozen tangled causes.
Three things make GTN especially unforgiving here. The first is dimensionality: net revenue is a function of brand by channel by payer by plan by state by time, and a movement in any cell can offset or compound a movement in another. A flat aggregate net rate can hide a Medicaid surge cancelling out a commercial improvement — two large, opposite signals that net to "nothing changed." The second is latency: claims, chargebacks, and rebate data arrive weeks after the scripts they describe, so the team is always reconciling a past it can no longer influence. The third is non-linearity: channel mix, access, pricing, and policy interact, and forecast error compounds when those signals move at different speeds. Static assumptions set at the start of the year can't keep up with a system that revises itself monthly.
Early-warning intelligence inverts the cadence. Instead of waiting for the quarter to close and then asking why, it watches the net-revenue mix continuously and raises the signal when a cell starts to drift — then does the decomposition immediately, while there's still room to act. The hard part isn't the alert; a threshold can throw an alert. The hard part is the explanation: separating the movement into price, volume, and mix, attributing each piece to the specific contracts and events behind it, and ranking what actually mattered against what's noise. That's the work a senior GTN analyst does, and it's the work that's hard to scale, because there's never enough analyst time to run it across every brand, channel, and plan, every week.
The dividing line between the two tiers is whether a platform can do that decomposition on its own, continuously, and show its reasoning. A reporting tool tells you the net rate moved. An intelligence layer tells you Medicaid penetration rose three points in two states after a tier reclassification, that it explains most of the variance, that the commercial improvement partly masked it, and that the exposure is material enough to revisit the accrual now. One is a record. The other is a decision you can still make in time.
And the explanation has to be reproducible, not just plausible. A GTN number that can't be traced back to its sources and methods is a liability in a function that defends its reserves to auditors and its accruals to the board. Fluency without traceability is the failure mode worth naming — a narrative that sounds right, can't be reproduced, and doesn't survive the first hard question in the review. The tier that matters is the one that catches the movement early, explains it in terms a reserve review can act on, and shows the work.
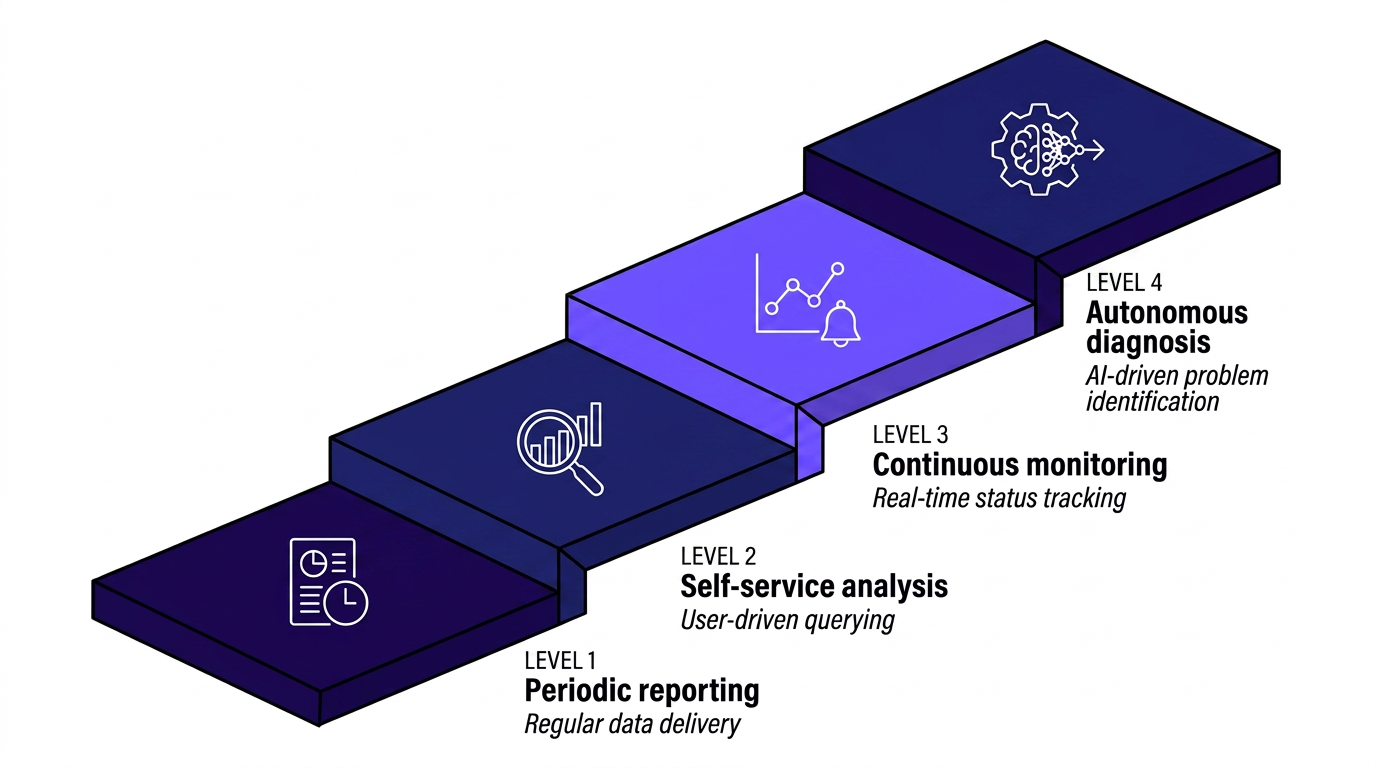
The GTN Analytics Maturity Model
GTN analytics tends to mature in four stages. Each is a legitimate operating posture — plenty of well-run manufacturers sit at Level 2 and close their books cleanly every quarter. The levels describe how early a team can see a movement and how much of the explanation it can produce without a person assembling it by hand.
Level 1 — Periodic reporting. GTN actuals and accruals live in spreadsheets and a BI dashboard, reconciled on a monthly or quarterly cadence. The team can see what the net rate did and build a variance bridge after the fact. This is a real, functioning setup — it just operates on a backward-looking clock, so the explanation always trails the quarter it describes.
Level 2 — Centralized and automated. The GTN data is consolidated off the spreadsheets into a governed platform, refreshed automatically, with consistent definitions across brands and channels. Reporting is faster and more trustworthy, and reserve scenarios can be modeled forward. The team still has to go looking for a problem, but it can find one in hours instead of days, and the numbers tie out.
Level 3 — Proactive detection. The platform watches the net-revenue mix continuously and surfaces a drift the moment it emerges, rather than waiting for someone to run the report. A Medicaid utilization spike or an effective-rebate-rate step-up raises a signal on its own. The team shifts from scheduled review to event-driven response — catching the movement while there's still room to adjust the accrual.
Level 4 — Autonomous diagnosis. The platform doesn't just flag the drift; it runs the investigation. It plans the multi-step decomposition, separates the variance into price, volume, and mix, attributes each piece to the contracts and events behind it, ranks what mattered, and delivers the explanation as finished work a reserve review can act on — with the reasoning traceable back to source. A person reviews and decides; the legwork that doesn't scale is done.
The jump that matters most is from Level 2 to Level 3 — from a team that can answer fast once it knows to look, to a system that knows to look on its own. Most GTN stacks are strong on the right side of this guide's comparison (Levels 1–2 capability, plus deep transactional and planning depth) and have no owner for Levels 3–4. That's the gap the diagnosis layer fills.
Tellius — The GTN Early-Warning & Diagnosis Layer
Tellius — best for knowing why GTN moved, before the quarter closes.
Tellius is Decision AI for the enterprise — the intelligence layer that connects your GTN data to your GTN decisions. It doesn't replace the system of record, the data foundation, or the planning platform. It sits on top of them and does the work those systems can't: reasoning across the net-revenue mix the way a seasoned GTN analyst would, and explaining what moved the number while there's still time to act on it.
The work starts before anyone asks a question. Tellius agents monitor the GTN metrics continuously — net rate by brand, channel, payer, plan, and state — and raise a signal the moment a cell starts to drift from the accrual basis. When one does, Tellius runs the full investigation as an agentic, multi-step workflow: it plans the decomposition, pulls the channel and contract data, separates the accrual-to-actual variance into its price, volume, and mix components, tests the candidate drivers, and ranks what actually moved the number against what's noise. A flat aggregate net rate that's hiding a Medicaid surge behind a commercial improvement gets pulled apart into its real, opposing signals — the kind of offset that a single quarterly variance number conceals.
Three things make that diagnosis trustworthy rather than merely fast:
- It reasons across all the data, read as one. The why rarely lives in a single source. Tellius reasons across the structured GTN data — claims, chargebacks, 867/852 feeds, plan-level detail — alongside the unstructured context that explains it, like payer contract terms and market-access notes. The effective-rebate-rate step-up in the data and the contract clause that triggered it get read together.
- The math is deterministic. Tellius separates language from calculation: the model interprets the question, but a deterministic reasoning engine computes the dimensional math — no LLM guessing at SQL, no silently double-counted rebates from a bad join. The same question yields the same answer every time, and every figure traces back to the sources and methods that produced it. For a function defending accruals to auditors and reserves to the board, that reconciliation and traceability is the difference between an explanation that holds and a narrative that collapses under the first hard question.
- Anyone can interrogate it, in plain language. A brand-finance analyst or a market-access lead can ask why Part D net dropped in the Northeast last month — typos, synonyms, brand-or-molecule names and all — and get a governed answer, not a three-day data-team ticket. The same engine runs ad-hoc predictive what-if, so a team can pressure-test where a Medicaid penetration trend or a rebate-rate creep is heading without standing up a modeling project.
And the output is finished work. Not a chart to interpret or a query result to translate — a brief the GTN and finance teams can take straight into the reserve review, in their template, routed to the right person before the meeting. Tellius is recognized as a four-time Gartner Magic Quadrant Visionary.
Where Tellius falls short. Tellius is not a GTN system of record, and it isn't trying to be. It doesn't adjudicate rebates or chargebacks, and it doesn't run government-pricing compliance — no AMP, Best Price, or audit-ready Medicaid CMS-64 reconciliation. That work belongs to a purpose-built SOR like Model N or IMA360, and to a data foundation like IntegriChain. The common and intended pattern is to run Tellius on top of those systems: they book and master the numbers, and Tellius explains what moved them. A manufacturer looking for one platform to both process the deductions and diagnose them won't find it here — Tellius is the diagnosis layer, deliberately.
You can read more on the Tellius AI agents platform and the pharmaceutical and life sciences pages.
GTN Platform Profiles — Anaplan, IntegriChain, Model N & More
Anaplan — best for forward GTN forecasting and reserve planning
Anaplan is the connected-planning platform most large pharma finance teams reach for to model the GTN waterfall forward. Its GTN solution links deal evaluation, pricing, demand forecasting, accruals, and reserves, with a calc engine that cascades a contract or pricing change down into the reserve number.
Key capabilities: multi-dimensional what-if across payer mix, contract terms, and channel volume; a real-time engine that cascades shifts through the full waterfall, including retroactive impacts; AI-infused planning analytics; connected planning spanning GTN, demand, and the operating plan.
Where Anaplan excels: It's widely adopted for connected planning across large life-sciences finance teams, with named pharma references reporting materially improved forecast accuracy and faster reserve scenarios.
Where Anaplan falls short: It models the forecast but doesn't watch the live signal against it — no autonomous detection of a mid-quarter Medicaid spike, no variance decomposition without someone building it. Anaplan itself notes that AI on fragmented data amplifies inconsistencies, so it leans on a clean upstream data foundation.
Pricing: Enterprise subscription by workspace and model capacity; implementation via Anaplan or a partner.
Consider if your primary need is forward GTN forecasting and structured reserve planning in one environment spanning GTN, demand, and the operating plan.
Pigment — best for modern, fast scenario modeling
Pigment is a newer EPM platform consultancies increasingly pair with GTN models, valued for a faster, more flexible modeling experience than legacy tools.
Key capabilities: dynamic scenario modeling and real-time what-if; automated data integration; agentic AI features for planning; a modeling environment quicker to stand up than legacy EPM.
Where Pigment excels: It's recognized as a leader in modern enterprise planning, built for speed and flexibility. For GTN it's delivered through partner-built models, which suits teams that want connected-planning power without a heavyweight legacy implementation.
Where Pigment falls short: GTN is a consultancy-built model, not a packaged pharma solution, so government-pricing and compliance depth is thinner. Like any planning tool, it models forward rather than diagnosing a live variance.
Pricing: Subscription by workspace and user; GTN modeling typically via a partner.
Consider if your primary need is fast, flexible scenario modeling and you're standardizing net-new. (Workday Adaptive Planning fits teams already on Workday, with GTN built through a partner model.)
IntegriChain — best for the GTN data foundation
IntegriChain markets ICyte as a data and application platform built specifically for net-revenue optimization, aggregating channel, contract, patient, and pricing data and layering GTN accruals, forecasts, and government-pricing applications on top.
Key capabilities: data aggregation across PBMs, states, 3PLs, distributors, pharmacies, and patient-service providers; bottoms-up accrual management and GTN forecasting; what-if for WAC changes, contract terms, and IRA implications; government rebate and chargeback management, audit-ready.
Where IntegriChain excels: It's widely used for net-revenue data aggregation and is trusted across hundreds of biopharma organizations, from emerging biotech to Top 50 manufacturers. When the core problem is fragmented data that never ties out across feeds, it's the foundation the rest of the stack can sit on.
Where IntegriChain falls short: Its analytics are operational rather than agentic. It manages GTN data well, but it isn't built to monitor the net-revenue mix autonomously, run a multi-step diagnostic investigation, or support conversational analysis.
Pricing: Enterprise subscription scoped to data volume, applications, and trading-partner connections.
Consider if your primary need is a mastered GTN data foundation with built-in accrual and government-pricing applications.
IQVIA — best for GTN operations with market-access depth
IQVIA positions Orchestrated Gross-to-Net as a centralized financial-optimization platform, pairing the technology with its proprietary data and a team that runs the process with you.
Key capabilities: centralized financial optimization, contract management, and scenario optimization; automated monthly reconciliation across source systems; accrual and reserve analytics with claim-level variance analysis; conversational AI analytics following the WhizAI acquisition.
Where IQVIA excels: Few vendors match its combination of proprietary data, GTN process expertise, and market-access context. For organizations wanting a managed-service partner that brings both platform and people, its scale and data assets are a genuine advantage.
Where IQVIA falls short: The model is services-heavy and IQVIA-data-centric — a strength for some, a constraint for others. It's less a self-service modern analytics layer, and its conversational capability is newer.
Pricing: Enterprise engagement blending platform subscription with managed services.
Consider if your primary need is GTN operations bundled with market-access data and a partner running the process with you.
Model N — best enterprise GTN system of record
Model N is one of the most established systems for transactional GTN, with 25+ years in market. Revenue Cloud for Pharma covers pricing, contracting, rebates, chargebacks, and government pricing.
Key capabilities: rebate and chargeback adjudication; government pricing across Medicaid, Medicare, 340B, and FSS/Tricare (AMP, Best Price, ASP); contracting, pricing, and channel management; expanding AI and integrated data (Data nSights).
Where Model N excels: It serves many of the largest pharma manufacturers, with broad compliance and government-pricing coverage. For audit-ready transactional accuracy at scale, it's an established system of record.
Where Model N falls short: It records and adjudicates deductions but isn't built to explain a variance. Its early-warning and analytics capabilities are emerging, and deep diagnostic or conversational analysis has historically required separate tooling.
Pricing: Enterprise subscription scoped to modules and revenue under management; significant implementation.
Consider if your primary need is enterprise-grade transactional compliance as the backbone of your stack.
IMA360 — best cloud-native system of record
IMA360 is a cloud-native, ERP-agnostic option for rebate and chargeback processing, positioned as a modern alternative for teams moving off legacy systems.
Key capabilities: rebate and chargeback processing (EDI 844/845/849) and GTN calculations; 340B compliance and Medicaid rebate calculation (AMP/Best Price); GPO roster management, CPQ, real-time deal profitability; pre-built SAP S/4HANA connectors.
Where IMA360 excels: It offers modern SOR capability without ERP lock-in or a multi-year build, with go-live typically measured in months. For manufacturers wanting transactional depth in a faster, more flexible package — and explicitly off legacy systems — it's worth evaluating.
Where IMA360 falls short: It's younger and smaller than Model N, with less recognition at the largest enterprises and a shorter track record. Like any SOR, it processes transactions rather than diagnosing the net-revenue movement.
Pricing: Cloud subscription scoped to modules and transaction volume; faster implementation than legacy peers.
Consider if your primary need is modern, cloud-native rebate and chargeback processing without an SAP dependency.
ConnectiveRx — best for real-time copay and patient-program leakage
ConnectiveRx protects revenue at the patient-facing edge, intervening in the pharmacy workflow to stop copay, accumulator, and misuse leakage before claims are paid.
Key capabilities: copay program design and real-time adjudication; pharmacy monitoring at scale; ShieldRx, which applies real-time risk scoring on pharmacy, patient, prescriber, and claims data with pass/fail decisions before payment; affordability-program integrity.
Where ConnectiveRx excels: It operates at scale across copay and patient-support programs; a 2025 McKinsey assessment ranked it first in copay services and highest in NPS across patient-support services. For brands losing copay dollars to maximizers and accumulators, its embedded pharmacy workflows are an advantage.
Where ConnectiveRx falls short: Its scope is copay and affordability leakage — an important slice of GTN, not the forecasting, data, or transactional layers. It addresses where money leaks at the edge, not why the broader mix is moving.
Pricing: Program-based, scoped to copay and patient-support volume.
Consider if your primary need is stopping copay leakage to maximizers, accumulators, and misuse in real time.
RIS Rx — best bolt-on leakage protection
RIS Rx pioneered the "real-time GTN revenue protection" framing, layering onto existing copay vendors and hubs to catch affordability-program leakage before financial close.
Key capabilities: real-time detection of maximizer, accumulator (AAP), and alternative-funding (AFP) leakage; real-time eligibility and benefit verification across a wide share of covered lives; bolt-on deployment; real-time adjudication.
Where RIS Rx excels: It's a focused, real-time protection layer that deploys without replacing existing copay infrastructure, and the company reports protecting $1B+ in annual revenue for customers. For teams wanting leakage protection as an overlay rather than a rip-and-replace, the bolt-on model is the draw.
Where RIS Rx falls short: It's a young, narrow specialist focused on affordability-program leakage, with largely self-reported metrics. Like ConnectiveRx, it guards the patient-facing edge rather than the broader waterfall.
Pricing: Subscription scoped to covered lives and programs monitored; deployed as a bolt-on.
Consider if your primary need is stopping affordability-program leakage before financial close without replacing your copay vendor.
A Buyer's Checklist for GTN Diagnosis
Most GTN platforms can show you a dashboard and tell you the net rate moved. Far fewer can explain why, on their own, in time to act. If diagnosis and early warning are what your stack is missing, take this checklist into the evaluation — it separates a platform that catches and explains a variance from one that only reports it.
- Have the vendor diagnose a real variance live. Hand them a quarter where your net came in off the accrual and ask them to decompose it into price, volume, and mix on the spot. If the demo needs an analyst to build the analysis first, you're looking at a reporting tool, not a diagnosis layer.
- Check whether it watches on its own. Ask what happens when nobody logs in. If the answer is "a user runs a report" or "a chatbot waits for a question," there's no proactive monitoring — the signal still depends on someone remembering to look.
- Test the multi-step investigation. Ask the platform to take one question — "why did net drop on this brand in this region" — and carry it all the way through: pull the data, decompose the variance, test the drivers, draft the writeup. See whether it runs the chain or stops after the first answer.
- Probe how it handles the channel/payer/plan grid. A flat net rate can hide a Medicaid surge offsetting a commercial gain. Ask the platform to separate two opposing signals that net to roughly zero — if it only shows the aggregate, it'll miss the movements that matter most.
- Verify the math reconciles and reproduces. Ask the same question twice and confirm you get the same answer. Then ask to trace one figure back to its source data and method. A platform that can't reproduce or trace its own numbers won't survive an audit or a board question.
- Confirm a finance user can drive it without the data team. Have someone from brand finance or market access ask a GTN question in their own words — misspellings, brand-or-molecule names, and all — and see whether they get a governed answer or a ticket.
- Look at what it delivers, not just what it surfaces. Ask to see the output. A finished, reserve-review-ready brief is a different deliverable than a chart you still have to write up.
- Request named references at GTN scale. Ask for manufacturers running the platform on live GTN data, at comparable brand and channel complexity — and what the diagnosis actually caught.
What About Spreadsheets and ChatGPT?
Two cheaper options come up in every GTN evaluation, and both deserve a straight answer rather than a dismissal.
Excel. Most GTN forecasting still lives in spreadsheets, and for good reason — they're flexible, everyone knows them, and a skilled analyst can build a waterfall model that does real work. The trouble starts at scale. A model spanning brand × channel × payer × plan × state, refreshed monthly against lagged claims and chargeback data, becomes a web of linked workbooks that only one or two people fully understand. Version control breaks, the logic isn't auditable, and when the net rate moves, finding out why means a person manually tracing it through tabs. Spreadsheets are fine for a single brand or a one-off scenario. They don't hold up as the system that's supposed to catch a variance forming across hundreds of cells while there's still time to act.
ChatGPT or Claude on an exported file. Dropping a GTN extract into a general-purpose LLM and asking "why did net revenue drop" gets a fast, plausible-sounding narrative — useful for a quick gut-check. But it's reading a static snapshot, not a live connection to your channel and contract data. There's no semantic layer that knows what your accrual basis means or how your Medicaid rebate is calculated, no audit trail, and no guarantee the math is right — ask the same question twice and you can get two different answers, because the model is generating language, not computing deterministic dimensional math. For personal exploration on a static file, it's a fine tool. For a number you'll defend to an auditor or take into a reserve review, it isn't.
The shared gap is governance. Neither a spreadsheet nor a general LLM gives you reproducible, traceable, continuously-monitored GTN analysis — and in a function that answers to compliance and the board, that's the part that can't be optional.
Where GTN Analytics Is Heading
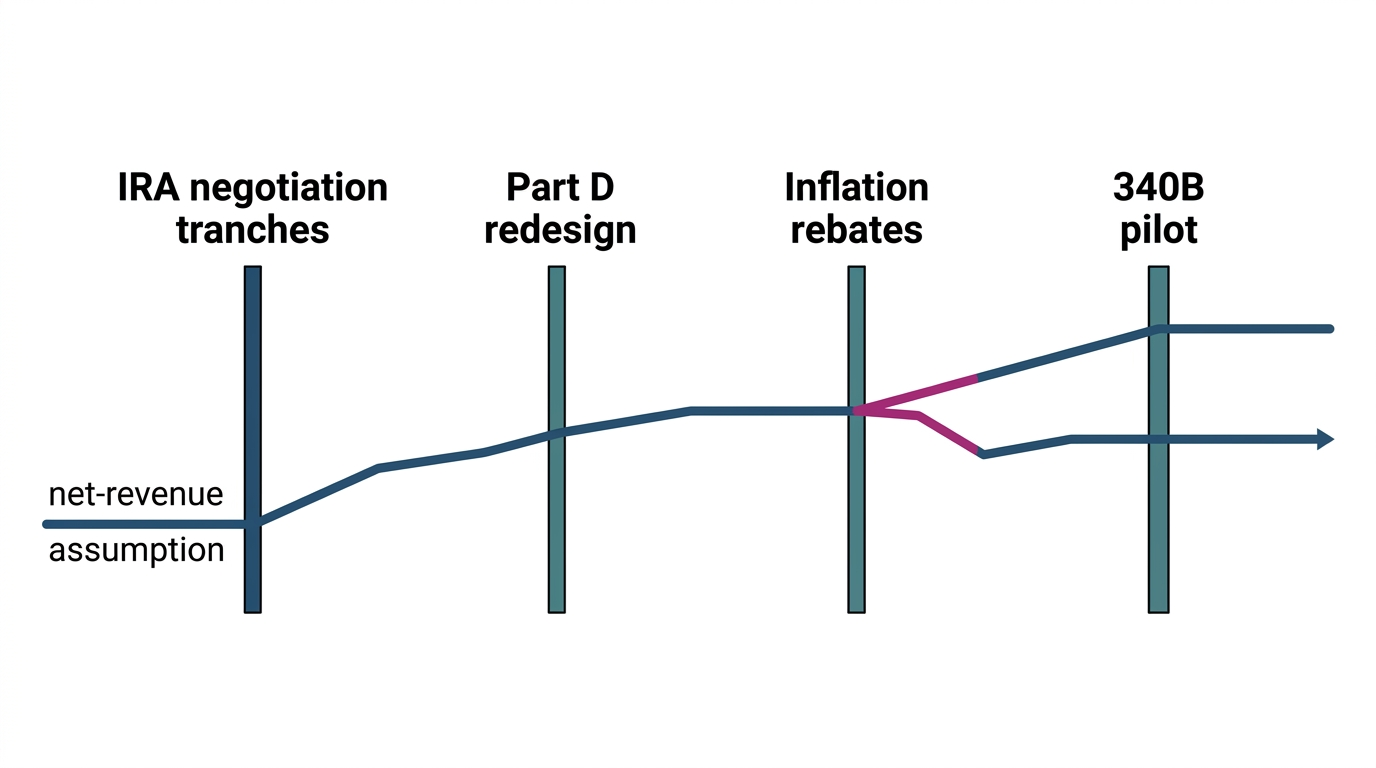
The pressure on gross-to-net forecasting is getting worse, not better, and the reason is structural. The deductions that drive net revenue are increasingly set by policy that changes on its own clock, and the policy is moving fast.
The Inflation Reduction Act's Medicare drug price negotiation took effect for its first tranche of drugs in 2026, with more added each year through the end of the decade. The Part D redesign capped beneficiary out-of-pocket costs and shifted a large share of catastrophic-phase liability onto plan sponsors, changing utilization patterns and the economics underneath them. Inflation rebates, most-favored-nation pressure, a 340B rebate-model pilot, and continued PBM consolidation each add new structural breaks — events with hard effective dates that a static, annually-set assumption simply can't anticipate. In the 2026 Model N survey, 99% of life-sciences leaders said GTN had grown more complex, and PBMs were named the leading contributor.
Two things follow for how teams will evaluate GTN platforms over the next few years.
First, the premium shifts from calculating the waterfall to catching it move. When the rules were stable, an accurate annual model got you most of the way. When a state can reclassify a rebate tier mid-year and a negotiated price can reset the economics of a whole channel, the value moves to seeing the shift early — while the accrual can still be adjusted — rather than reconstructing it at close. Detection and diagnosis become the capabilities that separate a stack that copes from one that's always a quarter behind.
Second, explainability stops being a nice-to-have. As more of the net number is driven by legislated and negotiated mechanics, finance teams have to show their work — to auditors scrutinizing AI outputs, to boards approving reserves, to their own leadership asking why the forecast moved. A model that produces a number it can't trace back to a cause won't clear those bars. The platforms that win will be the ones that encode the known structural breaks as inputs, decompose a movement into causes a person can follow, and reproduce the same answer every time.
Neither shift is about adding more dashboards. Both point the same direction: toward systems that watch the mix continuously, explain what moved it, and do it in a way that holds up under questioning.
Tellius vs. Anaplan, IntegriChain & Model N
Tellius vs. Anaplan
Anaplan and Tellius solve different halves of the GTN problem, and plenty of finance teams run both. Anaplan builds the forward model — the waterfall, the accruals, the reserve scenarios across payer mix and contract terms — and it's deployed widely across large pharma finance organizations for exactly that. Tellius doesn't build the forward plan. It watches the live result against it.
When a quarter's actuals start diverging from the accrued rate, Anaplan can show you the model and let an analyst rework the assumptions; what it won't do is notice the divergence on its own or decompose it into the contracts and channels behind it. That's the work Tellius runs — monitoring the net-revenue mix continuously, catching the drift, and tracing it to a Medicaid tier reclassification or an effective-rebate-rate step-up before close. Anaplan owns the forward forecast and the structured reserve scenario. Tellius owns the question of why the live number is moving against it. The common pattern is Anaplan setting and reforecasting the plan, with Tellius diagnosing the variances the plan can't see coming.
Tellius vs. IntegriChain
IntegriChain and Tellius sit at different layers of the stack, and the cleanest deployments use them together. IntegriChain aggregates and manages the GTN data — the channel feeds, claims, chargebacks, contract and pricing detail — and runs accrual and government-pricing applications on top of a governed foundation. That foundation is exactly what a diagnosis layer needs underneath it.
Tellius isn't a data-aggregation platform and doesn't replace one. Where IntegriChain assembles and governs the net-revenue data, Tellius reasons across it — detecting drift, decomposing variance into price/volume/mix, and letting a finance user interrogate the result in plain language. The distinction is between the system that masters and manages the data and the layer that explains what the data is doing. A manufacturer running IntegriChain for its data foundation and government-pricing applications can run Tellius on top to monitor and diagnose the movements in that data — the two are complementary, not competing.
Tellius vs. Model N
Model N and Tellius do genuinely different jobs, and a team that owns one often still needs the other. Model N is the transactional system of record — it calculates and adjudicates rebates and chargebacks and manages government pricing across Medicaid, Medicare, 340B, and FSS/Tricare. It's where the deductions are booked, accurately and audit-ready, at enterprise scale.
What a system of record does by design is record. It captures what the net came out to; it isn't built to explain why it moved or to flag the movement while there's still time to adjust. Tellius reads the output of systems like Model N and answers that question — running the decomposition, attributing the variance, and delivering the explanation as finished work for the reserve review. Model N books the deductions; Tellius explains what moved them. For most large manufacturers the two coexist, with Tellius as the diagnosis layer sitting on top of the system of record.
A Note on This Comparison
This guide is published by Tellius, and Tellius is one of the eleven platforms in it. We've positioned ourselves favorably — every vendor comparison does — and we've also worked to make this an accurate, useful map of a fragmented category. Each platform was profiled from public sources: vendor sites, analyst and survey material, press releases, and pricing information, cross-referenced against our own competitive research. This evaluation weights early-warning diagnosis and explainability most heavily, because we think it's the capability most GTN stacks are missing — and we say so plainly rather than hiding the bias. Teams that weight transactional compliance, data mastering, or forward planning most heavily will reasonably rank these platforms differently, and the guide is built to help with that too. If you represent a platform here and believe we've mischaracterized your capabilities, tell us and we'll review and update the relevant section.
See It on Your GTN Data
Tellius is the intelligence layer that catches a gross-to-net movement and explains it — across the channel, payer, and plan grid — before the quarter closes. If reserve surprises and three-day variance investigations sound familiar, the fastest way to judge whether that's solvable is to watch it run on a real GTN scenario.
Get release updates delivered straight to your inbox.
No spam—we hate it as much as you do!

See how Tellius helps pharmaceutical and life sciences companies get faster business insights from patient, clinical, and real world data.

It's software that helps a pharma manufacturer calculate, forecast, or protect the difference between a drug's list price and the net revenue it keeps after rebates, chargebacks, discounts, and government-pricing obligations. In practice "GTN platform" spans five different jobs — transactional adjudication, data foundation, forward forecasting, early-warning diagnosis, and leakage protection — which is why no single product is best at all of them.
It depends on which job is hurting. For transactional adjudication and government-pricing compliance, Model N is the established enterprise system of record, with IMA360 a cloud-native alternative. For a mastered data foundation, IntegriChain; for managed-service operations with market-access depth, IQVIA. For forward forecasting and reserve planning, Anaplan, with Pigment or Workday Adaptive for modern modeling. For detecting and explaining why net revenue moved before quarter-close, Tellius. For real-time copay-leakage protection, ConnectiveRx or RIS Rx. Most enterprises run several, layered.
Three reasons compound. Net revenue is a function of brand × channel × payer × plan × state × time, so a movement in one cell can mask or amplify a movement in another. The deduction data — claims, chargebacks, rebates — arrives weeks after the scripts it describes, so teams are always reconciling a past they can no longer change. And channel mix, access, pricing, and policy interact non-linearly, so static annual assumptions fall behind a system that revises itself monthly.
A forecasting platform tells you what net revenue should be under your assumptions; it doesn't watch the live result and explain a divergence on its own. Teams that assume their planning tool covers diagnosis tend to discover the gap at close, when the explanation arrives too late to act on. If reserve surprises are a recurring problem, diagnosis is a separate capability worth evaluating on its own.
Medicare drug price negotiation, the Part D redesign, and inflation rebates introduce structural breaks with hard effective dates — points where the economics of a channel reset on a schedule set by policy, not by the manufacturer. That raises the premium on platforms that encode known events as inputs and catch the resulting shifts early, rather than reconstructing them after the quarter closes.
They cover different halves. Anaplan builds the forward forecast and reserve scenarios; Tellius monitors the live result against the plan, catches drift, and decomposes the variance into its drivers. Anaplan won't detect a mid-quarter Medicaid spike on its own; that's Tellius's job. Many teams run both — Anaplan for the plan, Tellius for the diagnosis.
IntegriChain aggregates and governs the GTN data and runs accrual and government-pricing applications; Tellius reasons across that data to detect and explain movements. They sit at different layers and are commonly deployed together, with Tellius on top of the data foundation. Tellius doesn't replace data aggregation, and IntegriChain isn't built for autonomous, conversational diagnosis.
Model N is the transactional system of record that books rebates, chargebacks, and government pricing; Tellius is the diagnosis layer that explains what moved the net number. A system of record records the result; it isn't built to explain or flag the movement. The two typically coexist, with Tellius reading the output of the system of record.
No. Tellius isn't a system of record and doesn't adjudicate rebates or chargebacks, calculate AMP or Best Price, or produce audit-ready Medicaid or 340B compliance. That work belongs to a purpose-built SOR like Model N or IMA360. Tellius sits on top of those systems and explains the movements in the numbers they produce.
A dashboard shows you the net rate moved; you still need an analyst to investigate why. Tellius runs that investigation itself — monitoring the mix, decomposing the variance, and delivering the explanation as finished work. The dashboard reports the what; the diagnosis layer explains the why and does it before someone goes looking.
No. Tellius is the intelligence layer that sits on top of your existing GTN stack — the system of record, the data foundation, the planning platform — and reasons across their output. It's designed to complement those systems, not replace them.
Both feel it. The forecasting lead and controller own the accrual and the reserve; market-access finance owns the contract- and plan-level rebate detail. A diagnosis layer serves both, which is part of why it's evaluated as a shared capability rather than a single team's tool.
Because it runs on top of your existing data rather than replacing it, deployment is measured in weeks rather than the multi-quarter timelines typical of a system-of-record or planning implementation. The main work is connecting the GTN data sources and encoding what the metrics mean.
Yes — it's built to sit on top of the warehouse, data foundation, system of record, and planning tools already in place, reasoning across their data. You can read more on the Tellius platform and AI agents page and the pharmaceutical and life sciences page.
Have them decompose a real variance live, check whether the platform monitors on its own, test whether it runs a multi-step investigation end to end, confirm the math reconciles and traces to source, and verify a finance user can drive it in plain language. The verification checklist earlier in this guide covers the full list.
GTN diagnosis is one slice of a wider market-access analytics picture that also includes formulary intelligence, coverage, and pull-through. For that broader landscape, see our guide to the best pharma market-access analytics platforms.

AI Agents for Pharma Commercial Teams: The 2026 Field Guide to Use Cases, Vendors, and What's Actually Real
This field guide examines the AI agent use cases that are actually being deployed across brand analytics, field sales, market access, forecasting, omnichannel engagement, incentive compensation, and commercial operations. The guide compares leading vendors and deployment approaches, highlighting the differences between AI copilots, agent frameworks, agentic analytics platforms, and purpose-built commercial AI solutions.