Best CPG Category Management Software (2026): The 6 Platforms Category Teams Actually Shortlist
.webp)

Category management software is the set of platforms CPG brands and retailers use to decide what to carry, how to price and promote it, where it goes on the shelf, and why category performance changes. A modern category stack usually spans three jobs: syndicated and market measurement (NielsenIQ, Circana), category management AI insights that automate the category review and explain why the category moved (Tellius, AnswerRocket, and now Circana's Complete Why), and assortment, planogram, and space planning (SymphonyAI, Blue Yonder, DotActiv, and others). No single platform does all of it well, and treating these tools as interchangeable is the most common reason category teams pay for overlap and still leave gaps in between.
Category management isn't one job. It's a workflow: measure what sold, work out why the numbers moved and prep the line review, then decide what goes on the shelf and build the planogram. Each job has its own software, and the platform that leads one rarely leads the next.
By the end of this guide you'll know which platform owns each job in the category stack, where the lines between them blur, and how to build a shortlist that fits the jobs in front of you rather than chasing a single "best overall" tool. It covers the six platforms that show up on most category management shortlists in depth, plus the specialist planogram, predictive, and execution tools worth knowing once the core stack is set.
One of those three jobs is newer than the rest and easy to miss: category management AI insights, the layer that automates the category review and explains why the category moved, rather than measuring what sold or building the shelf. Most teams still do this work by hand, an analyst pulling sources into a spreadsheet and reasoning through them one at a time. The trouble is the number of variables in play, every retailer, region, price tier, pack size, promotion, and competitor, and when you can't account for all of them, the explanation that ends up in the deck is often the wrong one. A syndicated subscription and a wall of dashboards can look like analysis, but they mostly describe what happened rather than work out why.
Quick reference by primary need
A useful way in is to start from the job you most need done rather than from which tool is best overall. The table below pairs the common primary needs with the platform that tends to fit each one; the comparison and profiles further down fill in the reasoning.
Most enterprise category teams run a combination, for example, NielsenIQ or Circana measurement flowing into the company's own warehouse, a planogram tool like Blue Yonder for the shelf, and Tellius running the category-review automation and the "why" across all of it.
The category management tool stack
Here's that workflow as a buying map: each job in the order it happens, what it covers, and the platforms that lead it.
Most category teams are well covered on measurement and the shelf. The thin spot sits in the middle: automating the review and explaining why a category moved, fast enough to act on, across every source that holds a piece of the answer. Industry maturity models place most CPG brands at the descriptive stage, able to report last week's numbers but not reliably explain them, which is the gap the category management AI insights layer exists to close. These jobs are complementary, not competing versions of the same one. The comparison below covers all of them and names where each platform leads.
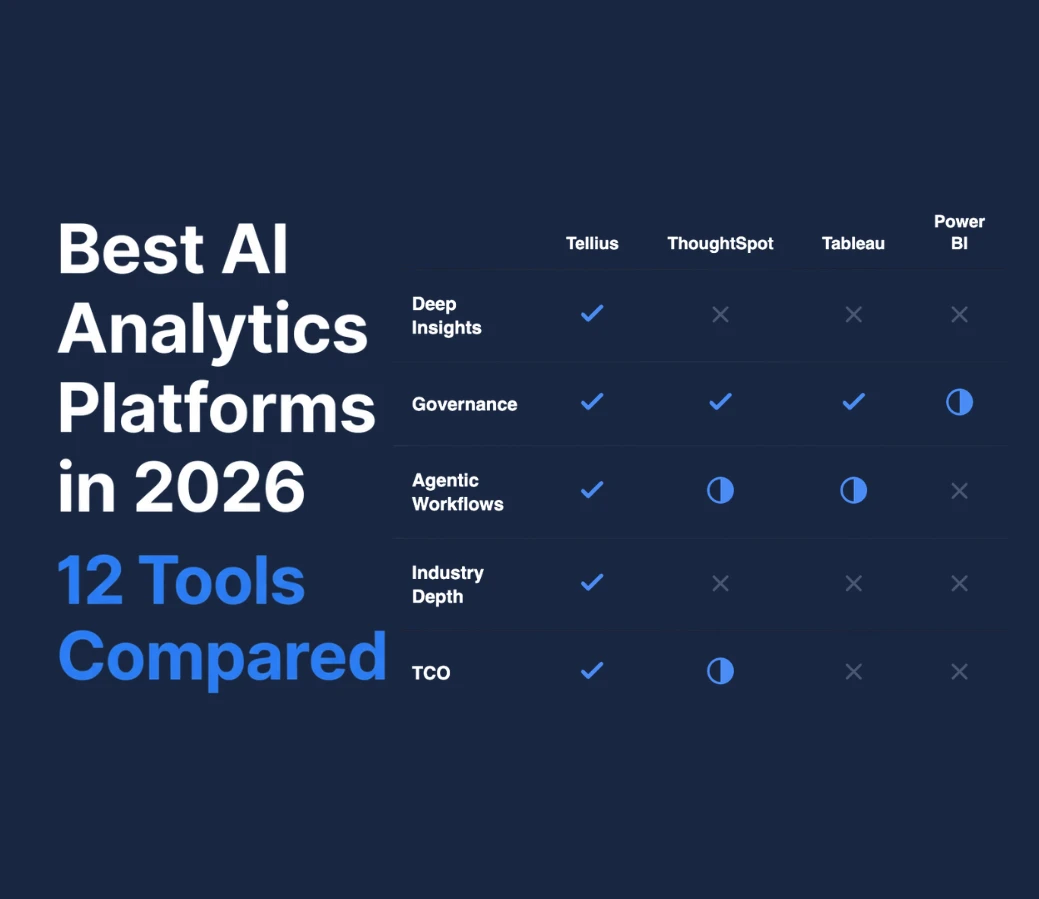
The platforms compared
This table rates the six featured platforms across the capabilities a category management buyer evaluates. Specialist planogram, predictive, and execution tools are covered in their own compressed section further down rather than graded row-by-row here.
How this table is ordered. NielsenIQ and Circana rank first and second on market presence: they are the two most widely used measurement sources in CPG, and their numbers are what retail buyers expect to see in a line review. Tellius ranks third because it leads the dimension this evaluation weights most heavily (category management AI insights that automate the review and explain the "why") while carrying less market presence than several incumbents below it. The remaining platforms follow by market presence and breadth within their own domains. The same order holds in the Key Takeaways, the How to Choose framework, and the deep dives.
Tellius shows ✗ on syndicated data because it analyzes that data rather than selling it, and ✗ on assortment, planogram, and verification because it explains the "why" and feeds the assortment decision rather than building or auditing shelves. Its ◐ on predictive reflects real forecasting and what-if modeling that isn't its lead, and its ◐ on retailer-POS reflects integration through its own connectors rather than being a native POS platform. AnswerRocket earns ✓ on category-review automation, the "why," and structured-plus-unstructured (it is a genuine peer in this lane, not a checkbox) and ◐ on "reasons like an analyst + governed engine" because it configures GPT over your data through Skills rather than running a deterministic engine. SymphonyAI and Blue Yonder lead assortment and space, where Tellius does not compete. Circana earns ✓ on the "why" on the strength of Complete Why, which works inside Circana's own data.
How we evaluated these platforms
Eight dimensions shaped the assessment. They map to the workflow a category team runs, from sourcing data to confirming a reset on the shelf.
- Category-review automation. Does the platform run the recurring category review (growth decomposition, fair-share scorecards, void rankings) and hand back finished prep, or does it leave the assembly to an analyst in Excel?
- Growth decomposition and the "why." Does it explain why a category or brand moved (splitting a share change into distribution, price, rate-of-sale, and NPD, and ranking the drivers) or does it stop at showing what changed?
- Reasons like a CPG analyst, on a governed engine. Does it already know how a category analyst works (the KPIs, the decomposition methods, the vocabulary) and compute the dimensional math reproducibly, or does it improvise queries that can quietly mis-aggregate across joins?
- Structured and unstructured reach. Can it investigate scan data, retailer POS, and panel alongside consumer reviews, retailer feedback, and the category-review documents themselves, in one analysis?
- Data foundation. Connectors, pipelining, harmonization, and whether the platform runs on the data the customer already has.
- Assortment, space, and execution coverage. Does it model assortment scenarios, build planograms, and verify in-store compliance?
- Predictive demand. Does it forecast forward demand and whitespace ahead of the scan?
- Market presence, deployment, and governance. Adoption, deployment model, and whether outputs are reproducible and auditable.
How to choose, by primary need
The right starting point depends on the job in front of you. Each recommendation below points to the platform built for that specific need.
- If your primary need is measuring what sold and your share (category share, pricing, and promo benchmarks retailers recognize) NielsenIQ and Circana are the foundational data layer. Most CPG analytics stacks start here, and Circana's Complete Why adds a "why" layer native to Circana data for a Circana-centric brand.
- If your primary need is automating the category review and answering why the category moved across Nielsen, Circana, retailer POS, panel, and unstructured data, Tellius is built specifically for this, the analytics layer that reasons like a category analyst on a governed, deterministic engine and ships the finished review on top of your existing stack. AnswerRocket is the other conversational option in this lane, but it answers on demand rather than running the review autonomously, and it doesn't compute on a deterministic, category-method engine the way Tellius does.
- If your primary need is assortment, planogram, and space planning, Blue Yonder leads for complex, multi-format retail, with SymphonyAI as the broad enterprise suite spanning assortment, space, and shelf, DotActiv for mid-market planograms, Spaceman inside the NielsenIQ ecosystem, and Oracle Retail for Oracle-standardized enterprises.
Key takeaways
NielsenIQ is one of the two market-measurement standards in CPG, with its Connect platform and Cornerstone for price and promo. Best for the foundational share and measurement layer, annual line reviews, and whitespace sizing.
Circana combines syndicated measurement (MULO+, Unify+, Liquid AI) with its analytics products, including the March 2026 Complete Why for store-and-week-level "why" modeling, and holds exclusive Kroger coverage. Best for brands that want measurement and a native diagnostic layer from one provider with deep grocery reach.
Tellius is the best category management AI insights platform in this comparison for category teams that need to automate the category review, understand why category and brand performance changed, and get a read on what to do next. It reasons over your data conversationally, the way an analyst would, but on a governed, deterministic engine: growth decomposition (distribution, price, rate-of-sale, NPD), fair-share indexing, void and distribution-gap analysis, SKU rationalization, and shopper segmentation, computed the same way every run. It works across structured and unstructured data in one pass and doesn't only answer when asked, watching the categories that matter, triggering a root-cause investigation the moment share or velocity moves, and running recurring workflows that assemble the full review (pull the sources, decompose the change, rank the drivers, surface the voids, draft the narrative) before the line review. It runs on the brand's own cloud and shows up inside Slack and Teams and over an existing BI or category tool, with an MCP server for more technically minded teams. Recognized as a Gartner Magic Quadrant Visionary five years running (2022–2026).
SymphonyAI runs the CINDE Connected Retail Platform on its EurekaAI engine, with Category Manager Copilot and the June 2026 CINDE Assortment & Space release connecting clustering, assortment, planogram, and shelf. Best for large enterprise CPGs and grocers that want one AI suite across the full category process in a single workflow.
Blue Yonder provides enterprise category management and space planning, including store clustering, Strategic Assortment with consumer decision trees, and a 2026 Cognitive Solutions release with natural-language planogram edits. Best for enterprise-grade space and floor planning across complex store formats.
AnswerRocket is a conversational GenAI analytics assistant, Max, used in CPG, that combines structured and unstructured data into narrative answers. Best for insights teams that want to chat with their brand, category, and syndicated data and get driver analysis fast.
The specialist tools around the featured set (Crisp for ingesting and harmonizing fragmented retailer and POS feeds, DotActiv for mid-market planograms and SKU rationalization, Spaceman for planograms inside the NielsenIQ ecosystem, Vision Group Retail for the plan-to-shelf-to-verification loop, Oracle Retail for Oracle-standardized global enterprises, and Tastewise for forward-looking demand signals) each lead a narrower job and are covered in the specialist section below.
Who benefits most
Category management software is bought and used by people with different jobs and the same underlying frustration: the data is there, but the review takes weeks and the why takes days.
- Category Manager / Category Director. Walks into a line review needing a defensible story, with the driver behind every share move ready to discuss. The "let me get back to you" moment happens when prep runs four to six weeks and a buyer asks why private label is taking share in the Midwest.
- Shopper / Consumer Insights Manager. Sits on syndicated data, household panel, retailer feeds, and a pile of reviews and research, but shopper segmentation takes months, and by the time the insight lands the market has moved.
- Key Account Manager. Heads into joint business planning with a scorecard that's already stale, while the analysts who could refresh it are backlogged two weeks.
- Category Strategy / Insights Director. Has to explain share shifts to leadership in a way that holds up to questions, when real growth decomposition is still a slow quarterly exercise across siloed sources.
- Revenue Growth Manager / Trade lead. Needs to tie category movement to the price and promo drivers behind it, and can't isolate the driver fast enough to change the next plan.
- VP Commercial / Category Leadership. Wants the team on strategy rather than firefighting, with no analyst bottleneck in front of every "why did this happen" question.
The thread connecting them is the same: a fast, trustworthy answer to why category performance changed, and a finished review, without a queue in front of it.
What separates category management AI insights from a syndicated dashboard
Most CPG analytics answers one question well: what happened. Share fell two points in the Northeast. A subcategory slipped. Promo lift came in under plan. That kind of description is necessary, and most CPG tools deliver it well.
category management AI insights answer the next two questions: why, and what to do about it. Not "share fell," but "share fell because two regional chains cut facings during a reset, a competitor's price gap widened past ten percent, and loyal buyers traded down to private label, so the move is to win back the facings and close the gap on the two hero SKUs." The difference between those answers is the difference between a statistic and a plan. As one industry framing puts it, a sales drop is a number; a sales drop because loyal buyers switched to private label over a price gap is something you can act on.
The gap is well documented. Analytics maturity models describe four stages, from reactive to descriptive to diagnostic to predictive, and place most CPG brands in the first two: they can report last week's numbers but not reliably explain them or say what to do next (LatentView, 2026). The jump to the diagnostic stage is where competitive advantage starts, and it's the stage most teams haven't reached. SymphonyAI's own 2026 launch material makes a similar point from the vendor side, arguing that roughly four in five CPG headquarters lack the analytics to make confident category decisions and still run reviews on stale data.
Reaching the diagnostic stage takes three things a syndicated dashboard doesn't have. First, the analysis has to run across every source that holds a piece of the answer, including unstructured ones like retailer feedback, consumer reviews, and the category-review documents themselves, because the why rarely lives in scan data alone. Second, the reasoning has to be reliable, which means the dimensional math is computed by something that knows the data relationships (distribution against velocity, fair share against total market) rather than guessed by a model that can silently double-count across a join. Third, it has to be fast enough to matter, which in practice means it can't sit behind an analyst queue. Increasingly there's a fourth: the analysis doesn't wait to be asked. It watches the categories that matter, triggers a root-cause investigation when share or velocity moves, and runs the recurring review on a schedule. A platform that does this crosses from reporting into analysis, and runs the review instead of feeding it.
A maturity model for category analytics
Four levels describe how far a category team's analytics have moved from reporting toward automated review. Each level is a legitimate place to operate, and a platform built for one level isn't a deficient version of a platform built for another, they differ in how much of the "why" the software handles versus the analyst.
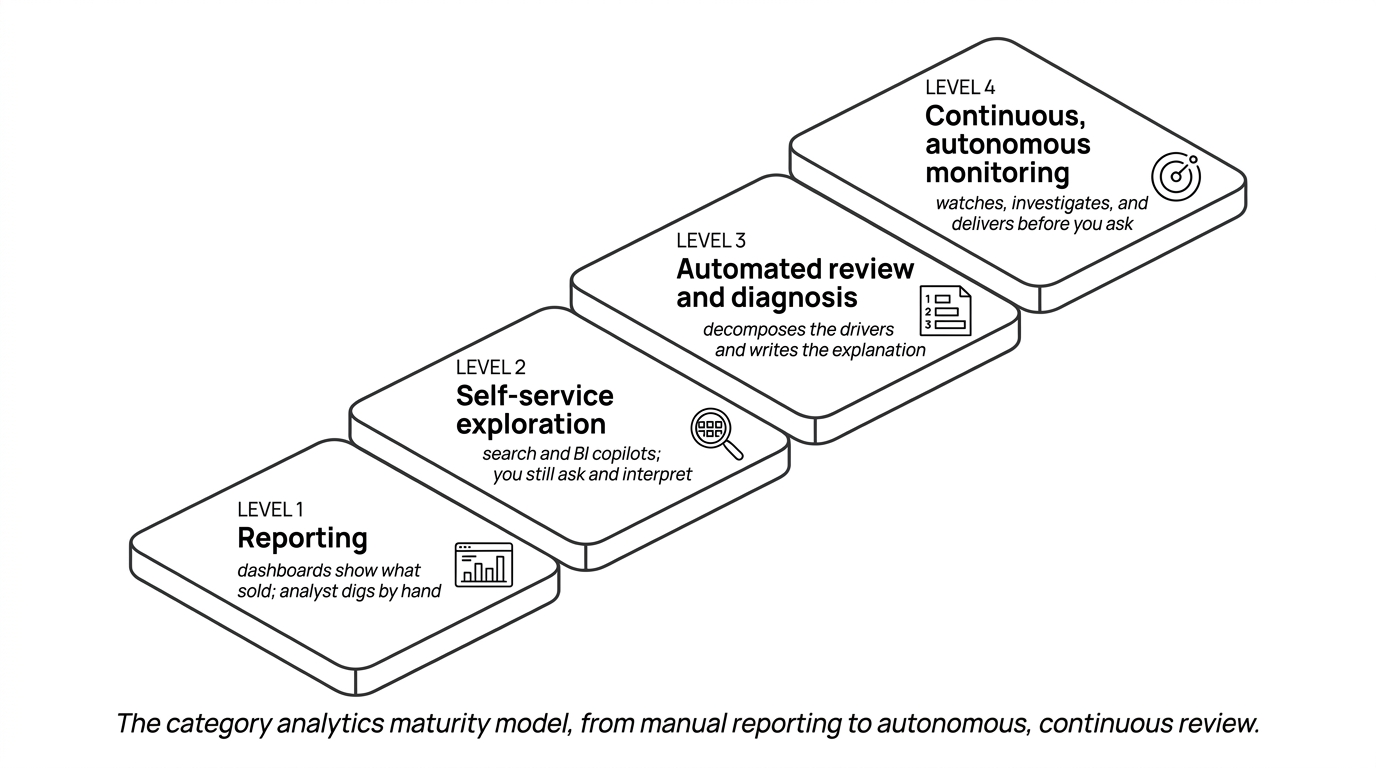
Level 1: Reporting. Dashboards and syndicated scorecards show what sold, by whom, where. The work is real and the data is trustworthy; this is the foundation every category team needs. The analyst does the investigation by hand, exporting and pivoting to chase a driver. Most line-review prep lives here.
Level 2: Self-service exploration. Search and BI copilots let users slice the data themselves and ask questions in plain language. Faster than Level 1, and genuinely useful, but the user still has to know which question to ask and still has to interpret the chart that comes back. The platform retrieves; it doesn't run the review.
Level 3: Automated review and diagnosis. The platform decomposes a category move into ranked drivers on its own, across multiple sources, and writes the explanation, growth decomposition, fair-share scorecards, void rankings, all assembled. The analyst reviews and decides rather than builds. This is where category-review prep stops being a multi-week task.
Level 4: Continuous, autonomous monitoring. The platform watches the categories that matter, investigates the moment something moves, and delivers the finished review or alert to the right person before they ask, across structured and unstructured data, on a schedule. The analyst is in command; the recurring legwork runs without them driving it.
Tellius operates at Levels 3 and 4. Much of the category stack (the syndicated providers, the planogram tools, the verification platforms) operates at Levels 1 and 2 by design, because their job is to measure, build, or confirm rather than to run the review. The levels aren't a quality ranking of vendors; they're a map of how much of the "why" the software does for you.
How Tellius runs the category review
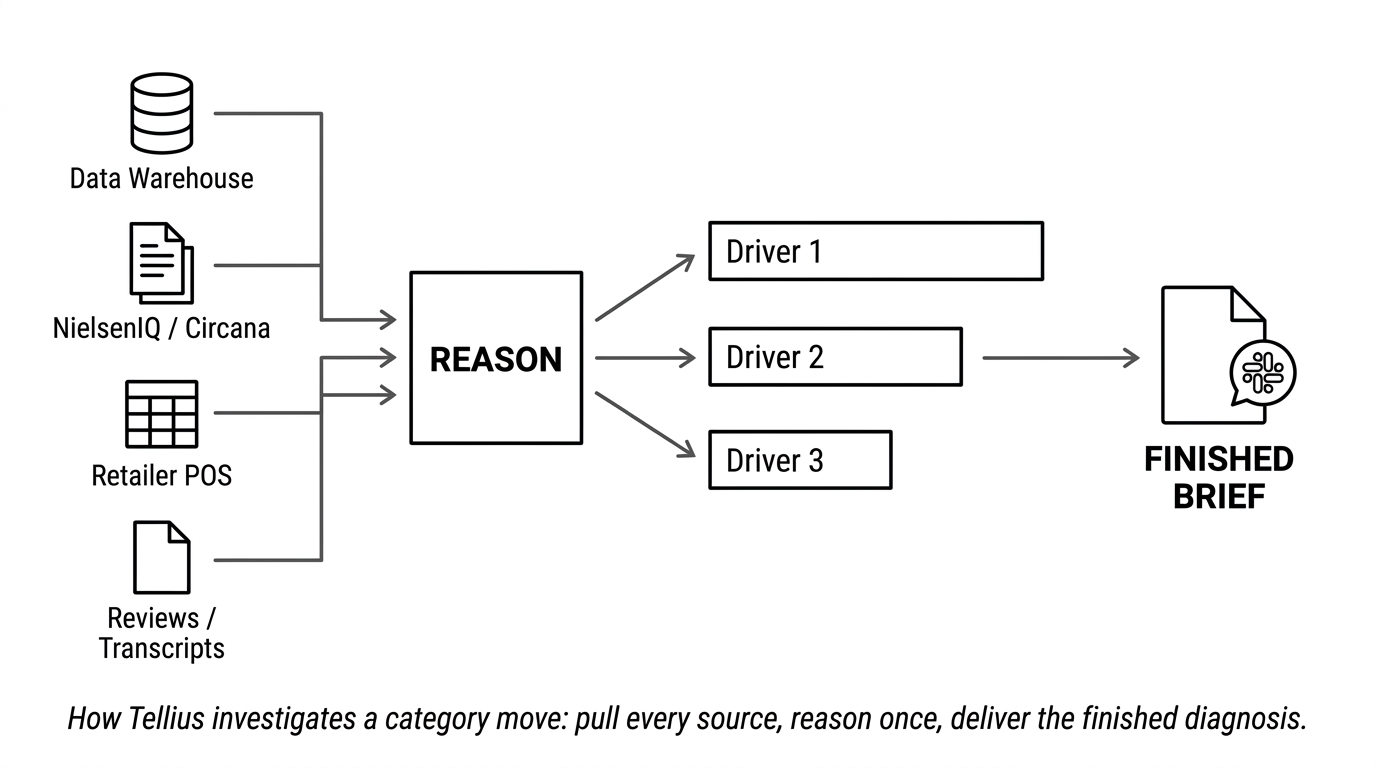
Tellius automates the category review and explains why category and brand performance changed, then turns that into a recommendation and delivers it as finished work. You ask the questions a category manager actually fields, in plain language: "What drove the snack decline in Q3 Northeast?", "Why did our share drop at Walmart the last four weeks?", "Where are we under-indexed versus fair share?", "Rank the top void opportunities by sales potential." It answers across syndicated data (NielsenIQ, Circana), household panel, retailer POS (Walmart Luminate and Retail Link, Kroger 84.51°), internal warehouse data, and unstructured sources, in one pass.
Like AnswerRocket, it reasons conversationally over your data and reads structured and unstructured sources together, so an explanation can draw on a competitor's pricing note or a shift in review sentiment, not just the scan. What's different is how the math gets computed. A category analyst's methods are encoded into the platform, growth decomposition (distribution, price, rate-of-sale, NPD), fair-share indexing, void and distribution-gap analysis, SKU rationalization, and shopper segmentation, and they run on a governed, deterministic engine rather than SQL a model improvises each time. The language model interprets the question; the engine computes the dimensional math the same way every run, with the steps traceable. For a team that has to defend a number to a retail buyer or to finance, that reproducibility is the difference between an interesting chart and one you can take into the room.
It also doesn't wait to be asked. Tellius watches the categories that matter and triggers a root-cause investigation the moment share, velocity, or distribution moves, then runs recurring workflows that assemble the whole review on a schedule, pulling the sources, decomposing the change, ranking the drivers, surfacing the voids, and drafting the narrative before the line review or JBP. It shows up inside Slack and Teams and over an existing BI or category tool, with an MCP server for more technically minded teams, and runs on the brand's own cloud warehouse (Snowflake, Databricks, BigQuery) with its own connectors and data prep, so it works with the stack a brand already has rather than replacing it.
Where Tellius falls short. It is not a planogram, space-planning, or shelf-execution tool. It doesn't build retailer-ready shelf sets or verify in-store compliance, and Blue Yonder, DotActiv, and SymphonyAI have years of planogram depth it doesn't attempt. The pattern is complementary: Tellius produces the why, the voids, and the assortment direction, then feeds the decision to a space tool that builds it and a verification tool that confirms the reset.
The featured platforms, in depth
Each profile below covers what the platform does, where it leads, where it stops, and who it's the right call for. The order follows the comparison table: market-measurement leaders first, then Tellius (covered above), then the enterprise suite and space leaders, then the closest analytics peer and the data-foundation layer. Capability marks from the table are explained here in plain language, and every gap named is a gap within the category-management AI insights dimension this evaluation weights most heavily, not a knock on what each platform was built to do.
NielsenIQ, best for syndicated measurement and retailer-recognized share
NielsenIQ is one of the two syndicated-data standards in CPG. Its Connect platform delivers market measurement, category share, and the price-and-promo view (Cornerstone) that brands and retailers use as common ground in line reviews.
Key capabilities:
- Syndicated retail measurement across channels, with broad category and market coverage.
- Connect platform for analytics, reporting, and collaboration.
- Cornerstone for pricing, promotion, and revenue-growth analysis.
Where NielsenIQ excels: It is one of the most widely deployed market-measurement sources in the industry, and its numbers carry weight with retail buyers because both sides of a negotiation recognize them. Coverage spans channels and categories at a depth most alternatives can't match, and the Connect platform adds collaboration and reporting on top of the raw measurement. For brands that need a trusted, retailer-accepted view of what sold and how share is moving, it sits at the base of the stack and tends to stay there for years.
Where NielsenIQ falls short: Its strength is measurement, not the category review. It reports what sold and how share moved; it doesn't automatically decompose why, and it doesn't read unstructured sources like reviews or retailer feedback alongside the scan data. The review and the "why" still fall to the analyst.
Pricing: Enterprise, subscription-based, scoped by category and market coverage. Contact for a quote.
Consider if your primary need is a trusted, retailer-recognized measurement and share foundation, and you have, or plan to add, a separate layer for the review and the "why."
Circana, best for measurement plus a native "why" layer
Circana (formed from IRI and NPD) pairs syndicated measurement with a growing analytics portfolio: MULO+ coverage, Unify+, Liquid AI, and the March 2026 Complete Why. It holds exclusive Kroger coverage and has folded in Nielsen's marketing-mix and NCSolutions assets.
Key capabilities:
- Syndicated measurement with strong grocery and MULO+ reach, including exclusive Kroger data.
- Complete Why: store-and-week-level modeling that quantifies the factors influencing sales performance, built into the Unify+ platform.
- Liquid AI and Unify+ for analytics and data access across Circana's universe.
Where Circana excels: It is one of the two measurement leaders, and Complete Why is a real move into the "why" from inside the data provider, which is appealing for brands that would rather get diagnosis natively than stand up a separate platform. Its Kroger exclusivity gives it coverage competitors can't match, and its portfolio (MULO+, Unify+, Liquid AI, plus the folded-in marketing-mix and NCSolutions assets) lets a brand keep measurement, modeling, and now diagnosis under one provider. For a team that values that consolidation, the breadth is a genuine draw.
Where Circana falls short: Complete Why is bound to Circana's own data universe. It diagnoses within Circana's sources rather than across a brand's full estate of warehouse, retailer POS, internal, and unstructured data, and it doesn't extend to the documents and reviews where much of the "why" sits. It's the review and the "why" inside one provider's walls.
Pricing: Enterprise, subscription-based, scoped by coverage and products. Contact for a quote.
Consider if your primary need is measurement and you want a diagnostic layer native to your syndicated provider, with Kroger coverage as a priority.
SymphonyAI, best for one enterprise suite across assortment, space, and shelf
SymphonyAI (Symphony RetailAI) is the most complete enterprise end-to-end category platform in this comparison. Its CINDE Connected Retail Platform runs on the EurekaAI engine, with Transferable Demand AI, a Category Manager Copilot, and a June 2026 CINDE Assortment & Space release that connects clustering, assortment, planogram, and shelf intelligence in one flow.
Key capabilities:
- End-to-end category management spanning assortment, space, and shelf in a single suite.
- Category Manager Copilot for generative, conversational category work.
- Transferable Demand AI and predictive capabilities built on a long data history.
Where SymphonyAI excels: It serves a large share of the world's biggest grocers and CPGs, with a published retailer result of 5.2% category sales uplift at a co-op grocer (per the same June 2026 launch announcement cited in the framing section above). The breadth is the point: assortment, space, and shelf live in one connected suite rather than as integrations a team has to maintain, and the Category Manager Copilot and Merchandising Agents bring a conversational, agentic layer over that depth. For an enterprise that wants the whole category process in one place at large-grocer or large-CPG scale, it is the strongest single-suite option here, and the closest enterprise competitor on the review-and-"why" question.
Where SymphonyAI falls short: Its "why" story is framed mostly in supply-chain and assortment terms and lives inside the Symphony suite and its data. It is less oriented toward open, warehouse-native category analytics across a brand's full estate, including unstructured sources, and less designed to work across whatever stack a brand already runs. It's a full suite you commit to and run the category process inside, rather than something that reasons across the data and tools you already have.
Pricing: Enterprise, custom. Contact for a quote.
Consider if your primary need is a single AI suite spanning assortment, space, and shelf at large-grocer or large-CPG scale, and you have the appetite for a full platform commitment.
Blue Yonder, best for enterprise planogram and space planning
Blue Yonder (formerly JDA) is the long-standing space-and-assortment incumbent. Its Category Management Suite covers store clustering, Strategic Assortment with consumer decision trees, and a Planogram Generator, and its 2026 Cognitive Solutions release (ICON 2026) adds natural-language, agentic planogram edits.
Key capabilities:
- Enterprise space and floor planning with 3D visualization and complex store clustering.
- Strategic Assortment driven by consumer decision trees.
- Natural-language, agentic planogram editing in the newest release.
Where Blue Yonder excels: It is widely regarded as the enterprise standard for space and category management at scale, with deep strength in complex, multi-format planogram and floor planning, and published operational-efficiency and profit-improvement figures from its broader supply-chain AI. Its 2026 Cognitive Solutions release pushes into natural-language planogram editing, which keeps it current as buyers expect conversational interfaces on top of space tools. For large retailers and suppliers that live in planograms, it's the reference point the rest of the category measures against.
Where Blue Yonder falls short: It assumes the assortment and "why" decisions are already made; its job begins at translating those decisions into shelves. It doesn't run the category review or decompose why a category moved across structured and unstructured data, and its natural-language features are aimed at editing planograms rather than investigating performance.
Pricing: Enterprise, custom. Contact for a quote.
Consider if your primary need is enterprise-grade planogram and space planning across complex store formats at scale.
AnswerRocket, best for a conversational CPG GenAI analyst
AnswerRocket's Max is a GenAI conversational analytics assistant used in CPG. Users chat with their brand, category, and syndicated data, ask why performance changed, and get a narrative answer that combines structured and unstructured inputs. Skill Studio lets teams build custom assistants.
Key capabilities:
- Conversational, natural-language analytics over brand, category, and syndicated data.
- Combines structured data with unstructured sources (research, playbooks, presentations) into narrative answers.
- Statistical, diagnostic, predictive, and prescriptive analysis, with configurable Skills.
Where AnswerRocket excels: Its narrative synthesis is a real strength. Max reads structured and unstructured inputs together and writes a driver analysis a category manager can take into a meeting, and Skill Studio lets teams encode their own recurring analyses. Like Tellius, it reasons conversationally over your brand, category, and syndicated data and explains why performance changed, which puts the two in the same lane on category management AI insights. For an insights team whose main need is to ask questions of its data and get a fast, readable answer, Max fits well.
Where AnswerRocket falls short: Max reasons as a GPT assistant over your data. It's configurable through Skills, but it doesn't run on a deterministic engine with encoded category methods, so two runs of the same question can come back worded or framed differently, which matters when a number has to hold up under audit. It's also built mainly to answer when asked: it does less of the proactive, scheduled work, watching categories and delivering the finished review without prompting, and it doesn't build planograms or verify execution.
Pricing: Enterprise, custom. Contact for a quote.
Consider if your primary need is a conversational GenAI analyst over your CPG data, and on-demand investigation matters more to you than governed, scheduled, autonomous delivery.
Specialist and adjacent tools
Beyond the featured set, several platforms lead a narrower job. They're worth knowing, but a category management buyer usually evaluates them after the core stack is set, so this section keeps them brief, what each is best at, in a sentence.
- Crisp, best for ingesting and harmonizing dozens of fragmented retailer and distributor feeds into one clean model via its vertical retail data platform, with AI Master Data for product classification, strongest for mid-market and DTC brands.
- DotActiv, best for mid-market, data-driven planogram building and SKU rationalization, connecting POS directly to shelf layouts.
- Spaceman, best for planogram and space tooling inside the NielsenIQ data ecosystem, for teams already standardized there.
- Vision Group Retail, best for the plan-to-shelf-to-verification loop via Curate, EZPOG, and Store360, with AI image recognition; serves 340+ brands and publishes a 22% average out-of-stock reduction.
- Oracle Retail, best for very large global retailers and suppliers already standardized on Oracle Retail, wanting category planning inside the existing suite.
- Tastewise, best for forward-looking demand and whitespace signals, strongest in food and beverage.
A note on what we left out: JAGGAER sometimes appears in "category management" searches, but it addresses procurement category management, sourcing and supplier strategy, which is a different discipline from the retail and CPG merchandising category management this comparison covers. It's a strong procurement platform; it just isn't in this category.
A buyer's checklist for evaluating category-review automation
Most category platforms can show you a chart. Far fewer can run the review. Use this checklist in a demo to tell the difference, whichever vendors you're evaluating.
- Have the vendor run a real growth-decomposition scenario. Give them a category move you already understand and ask the platform to split it into distribution, price, rate-of-sale, and NPD, and rank the drivers. Watch whether it produces a decomposition or just a filtered view.
- Verify the platform runs on the data you already have (your warehouse, your Nielsen or Circana feeds, your retailer POS) without forcing a migration.
- Test whether it reads structured and unstructured data in the same investigation. Ask it to factor retailer feedback or a research document into the "why" alongside the scan data.
- Probe how the math is computed. Ask whether the dimensional calculations are deterministic and reproducible or generated by a model each time, and ask to see the same question return the same answer twice.
- Look at what it delivers, not just what it surfaces. A finished category-review deck or fair-share scorecard routed to a stakeholder is different from a dashboard someone still has to read and write up.
- Check whether it runs without being asked. Confirm whether it monitors categories and investigates on a schedule, or only responds to a prompt.
- Confirm where the answer shows up. Ask whether it can appear inside the tools the team already uses (Slack, Teams, or over an existing category or BI tool) rather than as one more login.
- Request named or anonymized references at your scale, in your channel, and ask what the deployment timeline looked like.
What about ChatGPT, Claude, or a BI dashboard?
It's a fair question to ask why not just drop a syndicated extract into a general-purpose model, or lean harder on the dashboards you already have.
For personal, one-off exploration, general models are useful. Drop a CSV into ChatGPT or Claude and ask why a category slipped, and you'll get a plausible narrative from that snapshot in seconds. It's a fine way for an analyst to think out loud. The limits show up at production scale: there's no live connection to your Nielsen, Circana, or retailer data, no semantic layer that understands your category and KPI definitions or what a fair-share index means against your market, no audit trail (ask the same question twice and you can get two answers), and no monitoring that runs on its own. They're personal productivity tools, not governed analytics platforms.
BI dashboards have the opposite shape. They're governed, connected, and trustworthy for what they do, which is show known metrics on known dimensions. But they were built to display, not to run the review. When a number moves in a way nobody anticipated, the dashboard shows the move; an analyst still has to chase the cause across panel, POS, and the retailer scorecard. For organization-wide reporting, keep the dashboards. For the specific job of automating the category review and explaining why a category moved across all the data, on a schedule, neither the free model nor the dashboard is built for it.
Where category analytics is heading
For most of the last decade, the competitive edge in category management came from having better data. The brands that could afford the deepest syndicated coverage and the best planogram tools had an advantage. That edge is eroding, because the data layer is increasingly a commodity: most serious players can get to clean, harmonized, well-measured data.
The next edge is speed and depth of explanation. When every competitor can see the same share move at the same time, the advantage goes to the team that understands why first and walks into the buyer meeting with the review already done. That shifts the criteria buyers use. A few years ago, a category-platform evaluation led with data coverage and planogram features. Increasingly it will lead with questions about the review itself: can the platform run the growth decomposition on its own, across every source, reproducibly, and deliver the finished prep before the JBP. The maturity models tracking this, and the vendors racing to add "why" capabilities, both point the same direction.
The likely end state isn't one platform that does everything. It's a stack where the data layer, the analytics layer, and the execution layer each do their job well and pass work between them, with the analytics layer doing more of the thinking that used to sit with an overloaded analyst team. Two forces will push the criteria there faster than most roadmaps expect. The first is governance: as more category decisions get made with AI in the loop, "can you show me how the system got that number" stops being a nice-to-have and becomes a buying requirement, which favors platforms that compute reproducibly and keep an audit trail. The second is the move from answering to acting, buyers are already asking not just whether a platform can explain a move but whether it can watch for the move, run the review, and deliver the finding without being asked. Those two forces, reproducibility and autonomy, are exactly the dimensions a 2026 evaluation should weight even if last year's didn't.
Tellius vs AnswerRocket
Tellius and AnswerRocket are the two platforms most often shortlisted for category management AI insights, and the straight answer is that Tellius does everything AnswerRocket does and more. Both let you ask, in plain language, why category performance changed, and both read structured and unstructured sources into one answer. Tellius matches AnswerRocket's conversational analytics, then adds two things AnswerRocket doesn't have: category-analyst methods codified on a governed, deterministic engine, and agentic workflows that run the review on their own.
Conversational analytics, everything AnswerRocket has. Anything teams value in Max, asking questions of brand, category, and syndicated data in plain language, getting a narrative driver analysis, blending structured scan data with unstructured research and documents, Tellius does too. There is no conversational capability AnswerRocket offers that Tellius lacks.
A governed engine AnswerRocket doesn't have. Max is a GPT assistant writing SQL over your data, which is flexible but non-deterministic: ask the same question twice and the wording, framing, and sometimes the number can shift. Tellius reasons conversationally too, but the dimensional math runs on a deterministic engine that encodes category-analyst methods (growth decomposition across distribution, price, rate-of-sale, and NPD; fair-share indexing; void and distribution-gap analysis; SKU rationalization) and computes them the same way every run, with traceable steps. When a number has to hold up in front of a retail buyer or finance, that reproducibility is the difference between an interesting chart and one you can defend.
Agentic workflows that run the review; AnswerRocket waits to be asked. Max answers when prompted. Tellius also runs on its own, watching the categories that matter, triggering a root-cause investigation the moment share or velocity moves, and assembling the recurring review (decompose the change, rank the drivers, surface the voids, draft the narrative) before the line review or JBP, then delivering it inside Slack, Teams, or an existing BI or category tool. Say share in a household-care subcategory drops three points across two regional chains: with Max, an analyst opens a session and works toward a narrative; with Tellius, that investigation has typically already run and landed with the category manager before the analyst sits down.
The practical read: AnswerRocket is a capable conversational GenAI analyst. Tellius is that same conversational analyst plus a governed category-analytics engine and the agentic workflows that automate the review, the codified CPG category-analyst methods running end to end, which is why a team weighing the two on the full job, conversational analysis, reproducible reasoning, and autonomous delivery, lands on Tellius.
Tellius vs SymphonyAI
SymphonyAI and Tellius come at category management from different starting points, and plenty of large CPGs will run both. SymphonyAI is an end-to-end enterprise suite that owns the category process from data through shelf. Tellius is the category management AI insights layer that sits on top of whatever stack a brand already has. They overlap on the word "AI" and on the question of why a category moved, but they're built to do different jobs, and seeing that clearly makes the choice straightforward.
SymphonyAI's CINDE Connected Retail Platform spans assortment, space, and shelf in one connected workflow, running on its EurekaAI engine with a Category Manager Copilot and Transferable Demand AI built on a long data history. Its 2026 CINDE Assortment & Space release ties clustering, assortment, planogram, and shelf intelligence into a single flow. The scale behind it is real: a large share of the world's biggest grocers and a long roster of CPG deployments, with published retailer results like low-single-digit category sales uplift. For a large grocer or CPG that wants one AI suite to run the category process end to end, rather than stitching point tools together, SymphonyAI is the most complete enterprise option in this comparison.
Tellius does something different, and narrower. It runs the category review and explains why a category moved across a brand's full data estate, including the unstructured sources and the systems that sit outside Symphony's walls, on the customer's own warehouse, and delivers that explanation as finished work wherever the team works. SymphonyAI's "why" story is framed largely in assortment and supply-chain terms and lives inside its own platform and data model. That's a strength when the question is contained within the suite, and a limit when the answer depends on data the suite doesn't hold, a competitor's pricing move captured in a retailer note, a shift in review sentiment, a category-review document, an internal finance file. Tellius's reasoning is source-agnostic by design.
There's also a deployment difference worth naming. SymphonyAI is a suite a brand adopts, with the commitment that implies. Tellius runs on the warehouse a brand already has and shows up in Slack, Teams, and the BI or category tool the team already uses, with an MCP server for more technically minded teams, and typically reaches first value inside four to six weeks because there's no migration. That makes the two easy to run side by side: a team can keep its existing assortment-to-shelf workflow, whether that's SymphonyAI or something else, and run Tellius across everything for the review and the why. Consider a quarterly review where a category misses plan across several banners. SymphonyAI is strong at the forward decision, modeling the assortment and space changes that should follow. Tellius is strong at the backward question that has to come first, why did the miss happen, decomposed across every source including the ones outside the suite, with the math reproducible enough to put in front of leadership. One platform helps decide what to do next; the other runs the review that explains what already happened and why. In a mature category organization, both questions get asked every cycle, which is why the realistic relationship is complementary, not competitive.
Tellius vs Circana Complete Why
Circana's Complete Why and Tellius both target the same question, why did category performance change, which makes the comparison a useful one for any brand trying to reach the diagnostic stage. The distinction isn't whether each can explain a move. Both can. It's how far the explanation can reach.
Complete Why, launched in 2026, uses store-and-week-level modeling to identify the factors influencing sales performance. For a Circana customer it carries a real advantage: it works natively inside Circana's data, including MULO+ coverage and exclusive Kroger access, with no separate platform to stand up and no integration project. The "why" comes from the same provider as the "what," in the same environment the team already uses for measurement. For a brand whose analytical world is mostly Circana data, that coherence is valuable, and it means a diagnostic capability available the moment Circana turns it on.
Tellius approaches the same question from outside any single data provider. It runs the category review across the brand's full estate (syndicated data from any provider, retailer POS, household panel, internal warehouse tables, and unstructured sources like consumer reviews, retailer feedback, and category-review documents) on the brand's own cloud, delivered through the tools the team already uses. It reasons on encoded category methods and a deterministic engine rather than inside one vendor's modeling environment, so the same investigation can pull a NielsenIQ feed, a Circana feed, a Walmart Luminate export, and a stack of qualitative notes into one ranked set of drivers. That difference matters most when the answer doesn't live in one provider's data: a category softens because a competitor's promotional push shows up in one retailer's portal, a sentiment shift appears in reviews, and a price gap sits in internal data. A tool bound to a single syndicated universe can explain the part of the story its data contains; a source-agnostic layer can assemble the whole story.
There's also the governance dimension. Complete Why's modeling lives inside Circana's platform, which is fine for Circana-native work. Tellius computes its dimensional math on a deterministic engine and runs on the brand's own governed warehouse, so outputs are reproducible and the audit trail belongs to the brand. For organizations where a category number has to reconcile with finance, that ownership of the reasoning and the data perimeter can be a requirement rather than a preference. The trade-off is clean: Complete Why is the review and the "why" bound to Circana's data universe, convenient and coherent for a Circana-centric brand. Tellius is category analytics across all of a brand's data, wherever it lives, for a brand that reasons across multiple providers plus its own internal and unstructured sources. And the two can coexist, Circana, including Complete Why's outputs, can be one of the sources feeding a broader Tellius review across the rest of the estate.
Where the category review connects to the rest of your CPG analytics
The category review doesn't sit on its own. The "why" it produces feeds the decisions a category team makes everywhere else, and the topics below each go a layer deeper than this comparison does. They're worth bookmarking as the sub-topics behind the platform choice.
- Assortment and SKU decisions. Once the review explains why a category moved, the next question is which SKUs to add, keep, or cut, and what the volume transfer looks like before a delist. That modeling sits right alongside the review in AI category management.
- Distribution and void analysis. The void and distribution-gap work in a review points to where authorized SKUs aren't selling and where whitespace is worth chasing. Ranking voids and on-shelf gaps by revenue is a related, recurring job.
- Trade promotion analytics. Category movement and promo movement are tangled together; isolating promotional lift and incrementality is a separate discipline with its own vendor set. More on measuring trade ROI.
- Brand and market-share performance. Growth decomposition, splitting a share change into distribution, price, rate-of-sale, and NPD, is the methodology underneath the review. It's the core of brand and market-share analysis.
- Retailer and JBP analytics. The review is what a key account manager carries into joint business planning. Keeping the retailer scorecard current for those meetings is a related, recurring job.
These are sub-topics of the same workflow, not competing platform categories.
A note on this comparison
This article is published by Tellius. We're a vendor in this category, and we've positioned ourselves favorably, as every vendor comparison guide does. We've also put real effort into making this the most accurate and useful CPG category management comparison available. Every profile was researched from public sources, analyst material, vendor sites, press releases, and product pages, and cross-referenced against our competitive intelligence. The category moves quickly, with new "why" and agentic capabilities shipping across several of these platforms in 2026, so capability marks reflect what was public at the time of writing and are worth re-verifying in a live demo. This evaluation weights category management AI insights, automating the category review and explaining why a category moved, with governed, reproducible reasoning, as the primary differentiator, which is the dimension Tellius is built for. Teams that prioritize syndicated-data breadth, planogram depth, predictive demand, or shelf-execution verification may reasonably rank these platforms differently. If you represent a platform listed here and believe we've mischaracterized your capabilities, reach out and we'll review and update the section.
See Tellius on your own category
Tellius runs the category review (growth decomposition, fair-share scorecards, void rankings) and explains why your category and brand performance changed across syndicated, retailer, panel, internal, and unstructured data, then delivers the finished work before the review. It runs on your own cloud warehouse and shows up inside the tools your team already uses.
Sources
External figures and product claims cited above are drawn from the following primary and independent sources, current as of June 2026:
- SymphonyAI, "SymphonyAI Brings AI-Powered Assortment and Space Platform to Global CPGs," BusinessWire, June 2, 2026, the ~80% statistic, co-op retailer 5.2% category sales uplift, 500+ global CPG deployments, and review-cycle compression claims.
- Circana, "Circana Launches Complete Why Solution with AI-Enabled Insights," March 2026, and the Complete Why product page; independent coverage in Supermarket News, store-and-week-level modeling and Unify+ integration.
- AnswerRocket, "AnswerRocket's GenAI Assistant Revolutionizes Enterprise Data Analysis" and Clients, the ~80% time-to-insight reduction at a Fortune 500 beverage leader and named CPG customers.
- Vision Group Retail, "How to Reduce Out-of-Stocks with AI", the 22% average out-of-stock reduction and 340+ customer figures.
- LatentView Analytics, "What Is CPG Analytics?" (2026), the analytics maturity model and the observation that most CPG brands sit at the reactive or descriptive stage.
- Gartner, Magic Quadrant for Analytics and Business Intelligence Platforms, June 2025, in which Tellius is positioned as a Visionary; summarized in CXToday's 2025 MQ rundown. Gartner does not endorse any vendor, product, or service depicted in its research and does not advise technology users to select only the vendors with the highest ratings or other designation.
Tellius performance figures (root-cause and growth-decomposition time reduction, category-review prep compression, time-to-insight gains, analyst hours saved) are from anonymized and aggregate Tellius customer deployments. Vendor capabilities and pricing change frequently; verify current details with each provider.
Get release updates delivered straight to your inbox.
No spam—we hate it as much as you do!


Category management software helps CPG brands and retailers decide what products to carry, how to price and promote them, where to place them on the shelf, and why category performance changes. It spans several jobs (from syndicated measurement through the category review and the "why" to assortment, planogram, and space planning) and most platforms specialize in one or two.
There isn't a single best platform, because the category spans different jobs. For measuring what sold and your share, NielsenIQ and Circana lead. For automating the category review and answering why a category moved, Tellius leads, with AnswerRocket as the other conversational option. For assortment, planogram, and space planning, Blue Yonder and SymphonyAI lead. Most enterprise teams run a combination, with Tellius as the category management AI insights layer across all of it.
Category management AI insights are the layer that automates the category review and explains why category and brand performance changed, running growth decomposition, fair-share analysis, void identification, and SKU rationalization across syndicated, retailer, panel, and unstructured data, conversationally and on a schedule. It's distinct from measurement (what sold) and from assortment and planogram tools (what goes on the shelf). Tellius, AnswerRocket, and Circana's Complete Why all compete here.
Descriptive analytics tells you what happened: share fell, lift came in under plan. Diagnostic analytics tells you why: which retailers, SKUs, price gaps, or shopper segments drove the move. Most CPG teams are well equipped for description and under-equipped for diagnosis, which is the gap category management AI insights platforms address.
They're close competitors, and many brands use both to cross-validate share. NielsenIQ is one of the two measurement standards with broad coverage; Circana has exclusive Kroger coverage and has moved into native diagnosis with Complete Why. Both are measurement foundations rather than category-review platforms, so the choice often comes down to coverage and existing relationships.
Tellius and AnswerRocket are the two closest peers on category management AI insights. Both combine structured and unstructured data conversationally and explain why performance changed. Tellius differs in reasoning like a category analyst on a deterministic engine (growth decomposition, fair share, void, SKU rationalization) for reproducible, auditable math, delivering the finished review autonomously through Kaiya Missions, and embedding inside existing tools. AnswerRocket is a strong conversational GenAI analyst with a long CPG customer base. Tellius leans toward governed, scheduled, embedded review automation.
Tellius is an category management AI insights layer; SymphonyAI is an end-to-end enterprise suite spanning assortment, space, and shelf. SymphonyAI is the more complete single-suite platform for the category process; Tellius runs the review and explains why a category moved across a brand's full data estate, on its own warehouse, and embeds on top of any stack. Many large CPGs run both, with Tellius as the open analytics layer.
Both run the review and explain why performance changed. Complete Why works natively inside Circana's data and coverage; Tellius reasons across a brand's full estate from any provider plus internal and unstructured data, on the brand's own cloud. A Circana-centric brand may find Complete Why sufficient; a brand reasoning across multiple sources will want Tellius's source-agnostic reach. The two can coexist.
No. Tellius is not a planogram, space-planning, or execution tool. It runs the category review and explains why a category moved, then feeds that into the assortment and planogram decision, which a dedicated tool like Blue Yonder, DotActiv, or SymphonyAI executes. The common pattern is to pair Tellius's analysis with a space tool for layout.
Yes. Tellius analyzes syndicated data from any provider alongside retailer POS, household panel, internal warehouse data, and unstructured sources, on the brand's own cloud warehouse. It has its own connectors, pipelining, and data prep, so it can build the data foundation itself or run on already-harmonized or third-party sources.
Usually, yes. Syndicated providers measure what sold; analytics platforms automate the review and explain why. They do different jobs, and most enterprise teams combine a measurement foundation, a harmonization layer, and an analytics layer rather than expecting one tool to cover all of it.
Tellius and AnswerRocket both read unstructured sources (reviews, retailer feedback, research documents) alongside structured data in the same analysis. Most measurement, planogram, and verification platforms work on structured data only, which is part of why running the review across all sources is a distinct capability.
It depends on what you want the AI to do. To automate the category review and explain why performance changed across all your data, on a schedule, Tellius is built specifically for that. For conversational analysis over your CPG data, AnswerRocket. For generative assortment and space work in one enterprise suite, SymphonyAI. For diagnosis native to your syndicated provider, Circana Complete Why.
Tellius is enterprise software, priced by the scope of the deployment rather than per seat. It typically delivers first value within four to six weeks on top of existing infrastructure. Contact Tellius for a scoped quote.
NielsenIQ and Circana dashboards report what sold and how share moved, which is essential and trustworthy. Tellius sits a layer above that: it takes syndicated data, along with retailer POS, panel, internal, and unstructured data, runs the review, and explains why the numbers moved, then delivers the finished analysis. The providers measure; Tellius runs the review across their data and everything around it. Most teams use both.
They do opposite ends of the workflow. Blue Yonder turns assortment decisions into retailer-ready shelf layouts and is the enterprise standard for space planning. Tellius runs the review and explains why a category moved, so the team knows what the assortment decision should be in the first place. Tellius doesn't build planograms; Blue Yonder doesn't run the category review. They're complementary, not alternatives.
Some can. Tellius surfaces through an MCP server, a browser extension over a legacy category or BI tool, and Slack and Teams, so the answer shows up where the team already works. Most measurement and planogram platforms are accessed through their own interface.
For personal, one-off exploration on a data snapshot, general models are useful. For production use they lack a live data connection, a semantic layer that understands your category and KPI definitions, an audit trail, and autonomous monitoring. They're personal productivity tools rather than governed analytics platforms.
Mid-market brands often start with harmonization (Crisp) to get clean data, accessible planogram software (DotActiv) for shelf work, and an category management AI insights capability for the review and the "why." The full enterprise suites are usually scoped and priced for the largest grocers and CPGs.
It varies by platform and scope. Analytics layers that run on existing data, like Tellius, can deliver first value in weeks because there's no migration. Full enterprise suites that span assortment, space, and shelf typically take longer to roll out across formats and stores.
Whether the platform runs the category review and explains why a number moved on its own, across all your data, reproducibly, and delivers the finished prep without an analyst driving the investigation. Most platforms can show what changed. Far fewer can run the review, which is the capability that separates reporting from analysis.
Best AI Analytics Platforms in 2026: 12 Tools Compared for Deep Insights, Governance, and Agentic Capabilities
This guide compares 12 AI analytics platforms in 2026 across the capabilities that actually separate “chat with your warehouse” from real analytical automation: governed conversational analytics, automated deep insights (root cause decomposition + ranked drivers), proactive monitoring, persistent business knowledge and context, industry specificity, agentic workflow orchestration, and total cost of ownership. It explains the maturity ladder from reactive Q&A to always-on agents that detect anomalies, investigate why metrics changed, and deliver executive-ready narratives and recommendations—then profiles where each platform fits (and where “agentic” claims don’t match reality).