AI-Powered Category Management Analytics for CPG: Same-Day Reviews, Quantified Decisions
Category reviews shouldn't require a data science project. AI-powered category analytics delivers assortment recommendations, shelf insights, and competitive intelligence in natural language, on demand.Body CPG category teams spend 4-6 weeks preparing each retailer review—pulling syndicated data, building PowerPoints, and defending recommendations they can't fully quantify. Meanwhile, category dynamics shift faster than your analysis cycle. Assortment decisions rely on intuition because the data is too fragmented to model properly. And when retailers ask "why should I add this SKU?", the answer is a story, not a number.
What is AI-Powered Category Management Analytics?
Category management analytics is an AI-powered approach that unifies point-of-sale data, panel data, and retailer-specific insights to help CPG commercial teams optimize assortment, shelf strategy, and category performance—reducing review prep time from 6 weeks to under 3 days.
Unlike traditional category management tools that require analysts to manually pull and reconcile Nielsen, Circana, and retailer data for each review, AI-powered category analytics delivers instant answers to assortment questions, automatically quantifies SKU rationalization impact, and generates retailer-ready insights on demand. It connects shopper behavior to shelf performance, identifying which products drive category growth versus which cannibalize existing sales.
Tellius is a category management analytics platform purpose-built for CPG teams—combining conversational analytics for instant category insights with agentic analytics that monitors share shifts, competitive threats, and assortment opportunities continuously.
The Problem
Your category reviews are obsolete before you finish them
Six weeks to build a category review. Two weeks of back-and-forth on data pulls. By the time you present to the retailer, the competitive landscape has shifted, new products have launched, and your recommendations are based on data that's already stale. And still, the hardest question—"What's the incremental sales impact of adding this SKU?"—gets answered with a guess.
Category managers operate without incrementality proof, competitive visibility, or time to quantify anything

Category reviews take 4-6 weeks because syndicated data, retailer data, and panel data live in separate systems that require manual reconciliation before analysis can even begin.
Assortment recommendations are gut-feel because modeling incrementality across hundreds of SKUs at dozens of retailers is too complex for spreadsheets, so decisions default to intuition.
SKU rationalization can't be quantified because predicting what happens when you delist a product—will shoppers switch to another of your SKUs, or walk to a competitor?—requires analysis no one has time to do.
Shelf and space analytics are disconnected from sales because planogram data and POS data don't talk to each other, so you can't prove that better placement drives better results.
Competitive threats surface too late because tracking share shifts, new product launches, and distribution gains across categories and retailers requires constant manual monitoring.
Shopper insights don't connect to category decisions because panel data and behavioral research sit in separate systems from sales data, making it impossible to translate shopper understanding into assortment action.

What good category management looks like (without the 6-week prep cycle)

AI-Powered Category Performance: Unified data from Nielsen, Circana, and retailer sources with automated refresh—category reviews generated in hours, not weeks.
Quantified Assortment Optimization: AI models incrementality, cannibalization, and switching behavior across your full portfolio—every SKU recommendation backed by projected impact.
SKU Rationalization Modeling: Predict volume transfer before delisting—which SKUs absorb demand, which lose it to competitors, and what's the net P&L impact.
Shelf-to-Sales Connection: Link space, placement, and adjacency data to actual sales performance—quantify the ROI of shelf investments.
Agentic Competitive Intelligence: AI agents monitor share movements, new item velocity, and distribution changes continuously—alerts surface threats before quarterly reviews.
Shopper-Informed Category Strategy: Panel data, loyalty insights, and purchase behavior connected to category performance—understand who buys, why they switch, and what drives basket size.
The results
The ROI of category intelligence that moves at retail speed
80
%+
5%+

$4M+
15%+
Why tellius
How AI Transforms Category Management

Unify
Connect syndicated data (Nielsen, Circana), retailer data (Walmart Luminate, Kroger 84.51°), panel data (Numerator), and internal shipment data into one governed layer. Harmonize hierarchies automatically.

Explain
AI analyzes category performance, decomposes share shifts into drivers, models assortment scenarios, and explains why metrics changed. Ask "Why did we lose share at Kroger?" and get root cause analysis, not just charts.

Act
Agentic workflows monitor category dynamics continuously—flagging competitive distribution gains, share erosion, new item performance, and assortment opportunities before your next scheduled review.
Questions & Answers
Real Questions from CPG Category Teams
Part 1: Category Management Fundamentals
Understand what category management analytics is, why it matters, and what problems it solves.
1. What is category management analytics and how does AI change it?
Category management analytics applies data analysis to optimize product assortment, shelf placement, pricing, and promotion strategy within retail categories. Traditionally, this work required analysts to manually pull syndicated data, reconcile it with retailer-specific data, build Excel models, and create PowerPoint presentations—a process that takes 4-6 weeks per category review.
AI changes category management in three ways. First, it automates data integration and reconciliation, eliminating weeks of prep work. Second, it enables complex analysis that wasn't previously feasible—like modeling incrementality across hundreds of SKUs or predicting switching behavior when products are delisted. Third, it provides continuous monitoring rather than periodic reviews, surfacing competitive threats and opportunities in real-time.
The shift is from category management as a quarterly project to category intelligence as a continuous capability.
2. Why do category reviews take 4-6 weeks to complete?
Category reviews consume weeks because of data fragmentation and manual reconciliation. Syndicated data from Nielsen or Circana uses one product hierarchy and time period definition. Retailer-specific data from Walmart Luminate or Kroger 84.51° uses another. Panel data from Numerator adds a third perspective. Internal shipment and inventory data adds a fourth.
Before any analysis can happen, someone must pull data from each source, map products across different hierarchies, align time periods, resolve discrepancies, and validate that the numbers make sense. This data wrangling consumes 60-70% of the total review cycle.
Then comes the actual analysis, followed by building presentations that translate insights into retailer-ready recommendations. Each step is manual, and any data refresh requires starting over.
3. What decisions does AI-powered category management analytics inform?
AI-powered category management analytics informs four primary decision areas. First, assortment optimization: which products should be added, which should be delisted, and how should the mix vary by retailer, region, or store cluster? Second, shelf and space strategy: how much space should each product receive, where should it be placed, and what adjacencies drive the best performance?
Third, pricing and promotion coordination: how do everyday prices, promotional depths, and competitive price gaps affect category performance? Fourth, new product placement: where should new items be distributed, which existing products might they cannibalize, and what's the realistic sales potential?
Each decision has traditionally relied on a mix of data and intuition. AI-powered analytics shifts the balance toward quantified recommendations backed by incrementality modeling and predictive analytics.
4. What's the difference between category management and category analytics?
Category management is the broader discipline—a collaborative process between CPG manufacturers and retailers to manage product categories as strategic business units. It encompasses assortment, pricing, promotion, and shelf strategy, and involves ongoing retailer relationships, joint business planning, and category captain responsibilities.
Category analytics is the analytical foundation that supports category management decisions. It's the data, models, and insights that inform what assortment to recommend, what shelf changes to propose, and how to measure category performance.
You can do category management without sophisticated analytics—many teams still rely on basic reports and intuition. But AI-powered category analytics dramatically improves the quality and speed of category management decisions by quantifying what was previously unquantifiable.
5. How is category management different at category captains versus other suppliers?
Category captains have broader responsibility and data access. As the designated category advisor to a retailer, category captains see data across all suppliers in the category, not just their own products. This creates both opportunity and obligation—captains must make recommendations that benefit the total category, not just their own share.
For category captains, analytics must support total-category optimization: identifying white space opportunities regardless of which supplier fills them, recommending assortment changes that might reduce their own facings, and demonstrating objectivity to maintain retailer trust.
Non-captain suppliers focus primarily on their own portfolio within the category—making the case for their products, defending against rationalization, and identifying opportunities to gain distribution. Their analytics needs are narrower but no less important.
6. Who uses category management analytics and what questions do they ask?
Category Directors and Category Managers use analytics to develop assortment recommendations, prepare retailer reviews, and track competitive dynamics. Their questions include "What's driving share change at Target?" and "Which SKUs should we propose adding at Walmart?"
Shopper Insights teams use analytics to connect purchase behavior to category performance. They ask "Who's buying our new items?" and "What's the switching pattern when our product is out of stock?"
Sales and Key Account Managers use analytics to support Joint Business Planning (JBP) conversations. They need retailer-specific category views and answers to questions like "How does our assortment at Kroger compare to our assortment at Albertsons?"
Revenue Growth Management uses category analytics to understand how pricing, promotion, and assortment interact. They ask "What's the incrementality of adding a premium tier SKU?"
7. What data sources feed category management analytics?
Category management analytics integrates multiple data sources that traditionally live in silos.
Syndicated POS data from Nielsen or Circana provides market-level sales, share, and distribution metrics across retailers and geographies. Retailer-specific data from platforms like Walmart Luminate, Kroger 84.51°, and Target Roundel offers store-level granularity and retailer-proprietary insights.
Panel data from Numerator or NIQ Homescan reveals shopper behavior—who buys, how often, what else is in their basket, and how purchase patterns differ across segments. Internal data includes shipments, inventory, trade spend, and promotional calendars.
The challenge is that each source uses different product hierarchies, time periods, and definitions. AI-powered category analytics automates the harmonization of these sources, eliminating the manual reconciliation that consumes most review prep time.
8. How is category data different from trade promotion data and why does it matter?
Category and trade promotion analytics use overlapping but distinct data sources—and misunderstanding the differences leads to incomplete analysis.
Trade promotion analytics centers on event-level data: which promotions ran, what they cost, and what lift they generated. The primary sources are Trade Promotion Management (TPM) systems (event calendars, spend) and high-frequency point-of-sale (POS) data aligned to promotion windows.
Category management analytics requires broader context. Beyond POS sales, it needs panel data (Numerator, NIQ Homescan) to understand shopper behavior—who buys, what else is in their basket, and how purchase patterns differ across segments. It needs competitive assortment data to track distribution gaps and new item launches. And it needs retailer-specific hierarchies that may differ from syndicated category definitions.
The key difference: promotion analytics asks "Did this event work?" Category analytics asks "What should our assortment look like and why?" The first is tactical and time-bound. The second is strategic and ongoing. Effective CPG analytics platforms connect both.
Part 2: Assortment, Shelf & SKU Analytics
Deep dive into assortment optimization, SKU rationalization, shelf analytics, and competitive intelligence.
9. How does AI help CPG companies approach assortment optimization?
AI-powered assortment optimization balances three competing objectives: maximizing category sales, maximizing your share within the category, and minimizing complexity costs. The challenge is that these objectives often conflict—adding more SKUs might increase your share but cannibalize existing products or add supply chain costs.
Effective assortment optimization starts with incrementality analysis: for each potential SKU addition or deletion, what's the true incremental impact after accounting for switching, cannibalization, and halo effects? This requires modeling shopper behavior—understanding who buys each product, what they'd buy instead, and whether they'd leave the category or retailer entirely.
AI enables assortment optimization at scale by modeling these dynamics across hundreds of SKUs and dozens of retailers simultaneously—something that's impossible with manual analysis. Machine learning identifies patterns in historical data that predict how shoppers will respond to assortment changes.
10. How does AI model assortment incrementality?
AI models assortment incrementality by analyzing historical patterns of substitution, cannibalization, and category switching. When a product is added or removed, what happens to sales of related products? When a product is out of stock, what do shoppers buy instead? Do they trade up, trade down, switch brands, or leave the category?
Machine learning models learn these patterns from historical data across thousands of store-item-week combinations. They incorporate product attributes (size, flavor, price tier), shopper segments (loyalty, demographics, trip type), and competitive dynamics (relative pricing, promotion activity, distribution overlap).
The output is incrementality estimates for each potential assortment change: "Adding SKU X would generate $500K incremental category sales, but $200K would come from cannibalization of SKU Y, resulting in $300K net incrementality and $150K additional contribution margin."
11. How does AI quantify SKU rationalization impact before delisting?
AI-powered SKU rationalization predicts what happens when a product is removed. Will shoppers switch to another of your products (good), switch to a competitor (bad), leave the category entirely (worse), or leave the store (worst)? The answer depends on shopper loyalty, substitutability, and competitive alternatives.
AI models predict volume transfer by analyzing historical out-of-stock patterns and discontinued items. When a product was unavailable, what did shoppers do? This provides empirical evidence for switching behavior that can be applied to rationalization scenarios.
The output quantifies net impact: "Delisting SKU A would shift 40% of volume to SKU B, 25% to competitor products, and 35% would leave the category. Net impact: -$300K annual category sales, but +$50K contribution margin due to complexity reduction." This enables informed trade-off decisions rather than gut-feel rationalization.
12. What is assortment productivity and how should I measure it?
Assortment productivity measures how efficiently each SKU uses its shelf space and distribution to generate sales. Common metrics include Sales Per Point of Distribution (SPPD), sales per linear foot, contribution margin per facing, and velocity relative to category average.
Simple productivity metrics identify obvious underperformers—the SKU with 10% of average velocity is a rationalization candidate. But they miss important nuances: a low-velocity SKU might serve a loyal shopper segment that over-indexes on basket size, or it might be essential for competitive positioning even if it doesn't pull its weight individually.
AI-powered productivity analysis incorporates these factors—measuring not just individual SKU performance but each SKU's role in the total assortment. Some products are traffic drivers, some are margin builders, some are segment defenders. Productivity metrics should reflect these roles.
13. How do I connect shelf and space data to sales performance?
Connecting shelf data to sales requires linking planogram information (facings, shelf position, adjacencies) to POS performance at the store level. This is technically challenging because planogram data and sales data typically live in separate systems with different store identifiers and update frequencies.
Once connected, the analysis examines how space allocation and placement correlate with sales. Do additional facings drive proportional sales increases, or are there diminishing returns? Does eye-level placement significantly outperform bottom shelf? Do certain adjacencies drive cross-purchase?
AI can identify patterns across thousands of stores with different configurations—determining the shelf conditions that optimize performance. The insights inform space negotiations with retailers: "Stores with 6+ facings generate 40% higher velocity than stores with 4 facings, and the incrementality justifies the space investment."
14. What is AI-powered shelf analytics and why does it matter for category management?
AI-powered shelf analytics examines how physical shelf conditions—space allocation, placement, adjacencies, pricing, and availability—affect product and category performance. It answers questions like "How much does placement matter?" and "What's the ROI of additional shelf space?" by analyzing patterns across thousands of store configurations that would be impossible to detect manually.
Shelf analytics matters because shelf is the final battleground for shopper attention. Optimal assortment decisions are worthless if products aren't findable, shoppable, and available on shelf. And shelf negotiations with retailers require evidence—quantified proof that better placement drives better results.
Advanced AI-powered shelf analytics incorporates shopper behavior (eye tracking, path analysis), competitive positioning (relative placement, price gaps), and execution compliance (actual shelf conditions versus planned planograms). This comprehensive view connects shelf strategy to business results.
15. How do I identify and prioritize void opportunities?
A void is a store where your product has authorized distribution but isn't actually selling—either because it never reached the shelf, went out of stock, or was discontinued locally. Voids represent immediate revenue opportunity: the product is already approved, you just need to fix execution.
Identifying voids requires comparing authorized distribution (what should be selling) to actual distribution (what is selling). This seems simple but requires reconciling different data sources with different store identifiers and timing.
Prioritizing voids requires estimating the sales opportunity each void represents. A void in a high-volume store for a high-velocity SKU is more valuable than a void in a low-volume store for a slow mover. AI can rank voids by estimated weekly sales potential, enabling focused execution efforts.
16. How do competitors' category captain recommendations affect my shelf position?
When a competitor serves as category captain, their recommendations may systematically disadvantage your products even without explicit bias. Category captains naturally understand their own products' performance better and may unknowingly overlook your portfolio's strengths. Their recommendations optimize for their definition of category success—which may not align with your growth objectives.
To defend against potential disadvantage: maintain independent category analysis that validates or challenges captain recommendations, identify decisions that disproportionately benefit the captain's portfolio, and ensure retailers see total-category analysis—not just the captain's perspective. Some teams request access to captain recommendations before implementation to prepare counter-arguments where recommendations demonstrably harm the category.
The most effective defense is superior analytics. When you can demonstrate that a recommendation reduces category incrementality—with data the retailer trusts—you shift from complaining about bias to providing better insight.
17. How does AI help assess fair shelf consideration for new items versus competitors?
AI-powered analysis tracks four dimensions of shelf consideration to determine if your new items receive space proportional to their demonstrated performance.
First, authorization rate—are retailers listing your new items at expected rates compared to competitive launches with similar attributes? Second, store execution—once authorized, are products reaching shelf at target velocity, or are you losing to execution gaps while competitors' items appear faster?
Third, space allocation—are you receiving facings consistent with velocity performance, or are competitors with similar or lower velocity getting more facings? Fourth, placement quality—is your new item positioned advantageously (eye level, high traffic adjacencies) or buried where shoppers won't find it while competitive launches get prime real estate?
If competitors consistently outperform on these metrics despite similar product performance, you have a shelf consideration problem—possibly related to category captain influence, retailer relationships, or trade investment gaps. AI quantifies the gap to create the fact base for retailer conversations.
18. How does AI connect shopper data to category decisions?
Shopper data—from panels, loyalty programs, and behavioral research—reveals who buys your products, what else is in their basket, how often they purchase, and what triggers switching. This complements sales data, which shows what sold but not who bought or why.
AI connects shopper insights to category decisions by linking behavioral patterns to assortment and shelf strategy at scale. Which shopper segments are under-served by current assortment? Which products are basket builders that drive incremental trips? Which items are vulnerable to competitive switching?
AI analyzes shopper data across millions of households and connects patterns to store-level sales performance. This enables shopper-informed assortment—not just optimizing for sales, but optimizing for the shoppers you most want to serve.
Part 3: Platform Evaluation & Implementation
adsdf
19. How do I prioritize which categories to onboard first?
Focus on categories where you have strongest data coverage across syndicated and retailer sources, where business pressure is highest (category review deadlines, retailer negotiations), and where you have engaged category managers ready to use insights. Start with 2-3 pilot categories representing different complexity levels.
Choose one core category you know well to validate accuracy—you'll quickly spot if the platform's numbers don't match your institutional knowledge. Add one strategic growth category where insights would change decisions—this demonstrates the platform can surface new opportunities, not just confirm what you already know. Optionally include one category captain responsibility to test total-category analytics capabilities.
Expanding to additional categories typically takes 2-3 weeks per category once the platform is established—primarily configuration and validation work rather than full reimplementation.
20. How does category management analytics integrate with existing tools?
Category analytics complements rather than replaces existing tools. Nielsen Connect, Circana Unify, and retailer portals remain the sources of record for syndicated and retailer data. Trade promotion systems, ERP, and demand planning tools continue their operational roles.
Integration works through data flows: category analytics pulls from syndicated platforms, retailer data sources, and internal systems to create a unified analytical layer. It doesn't replace those sources but makes them more usable by eliminating manual reconciliation.
Some organizations embed category analytics insights into existing workflows—pushing alerts to Slack, exporting recommendations to PowerPoint templates, or feeding assortment scores into retailer collaboration platforms. The goal is augmentation, not replacement.
21. Can non-technical users generate AI-powered category reviews without analysts?
Yes, if the platform includes conversational analytics built for CPG terminology. Category Managers should be able to ask "Show me share trends for salty snacks at Kroger over the past 12 weeks" or "Which SKUs are underperforming versus category average?" and get immediate answers.
This requires a semantic layer that understands category management vocabulary—product hierarchies, retailer names, standard metrics (All Commodity Volume/ACV, Total Distribution Points/TDP, Sales Per Point of Distribution/SPPD), and time period definitions. Generic AI tools fail because they don't understand how CPG category data is structured.
Tellius conversational AI is configured with CPG-specific understanding, enabling Category Managers to self-serve insights for retailer meetings, competitive analysis, and assortment reviews without waiting for analyst support.
22. What's the ROI of AI-powered category management analytics?
AI-powered category management analytics delivers ROI across three dimensions: time savings, decision quality, and continuous intelligence.
Time savings: Category review prep drops from 4-6 weeks to 2-3 days—an 80%+ reduction. For teams managing 10+ categories with quarterly reviews, this frees hundreds of analyst hours annually for strategic work instead of data wrangling.
Decision quality: A single SKU addition or deletion decision typically affects $500K-$2M in annual category sales. With intuition-based decisions, accuracy rates are around 60%. Incrementality-informed decisions improve accuracy to 80%+. Across 50 annual assortment decisions, that translates to $2-4M in captured opportunity or avoided mistakes.
Continuous intelligence: Agentic monitoring surfaces competitive threats and distribution gaps in real-time rather than waiting for the next quarterly review—catching issues weeks earlier.
23. What's the value of a single assortment decision made with incrementality data instead of gut feel?
A single SKU addition or deletion decision typically affects $500K-$2M in annual category sales. With intuition-based decisions, accuracy rates are around 60%—meaning 40% of assortment changes either underperform expectations or create unintended consequences like cannibalization.
Incrementality-informed decisions improve accuracy to 80%+. On a portfolio of 50 annual assortment decisions across categories, that translates to 10+ better outcomes per year. If each improved outcome saves $200K in avoided mistakes or captures $200K in incremental opportunity, that's $2M+ annual value from decision quality alone—before counting time savings from automated category reviews.
The less obvious value: incrementality data changes how retailers respond to your recommendations. "We should add this SKU" invites debate. "This SKU generates $1.2M net incrementality with 15% cannibalization, here's the analysis" invites approval.
24. Who needs to approve a category analytics investment and what do they care about?
Approval typically requires alignment from three stakeholders with different priorities.
Category Leadership cares about review prep time, recommendation quality, and retailer relationship strength—frame around analyst productivity (80% reduction in review prep), win rates in category captain competitions, and retailer feedback on analytical rigor.
Finance cares about measurable returns—frame around quantified assortment decisions ($2-4M per category from better decisions) and reduced SKU complexity costs. Finance wants to see the math, not just the vision.
IT/Data cares about integration complexity and maintenance burden—frame around pre-built connectors to existing syndicated subscriptions and vendor-managed infrastructure that doesn't add to their support queue.
The common mistake is building a one-size-fits-all business case. Customize the narrative for each audience. The CFO doesn't care about faster category reviews; they care about $8M in annual assortment value across four categories.
25. What is the best AI platform for category management analytics?
The best AI platform for category management analytics needs five capabilities most tools lack.
First, multi-source data integration: seamless connection to Nielsen, Circana, retailer portals (Walmart Luminate, Kroger 84.51°), panel data, and internal systems—with automated hierarchy harmonization.
Second, incrementality modeling: AI that can predict assortment impact, not just report historical performance. Answering "What happens if we add this SKU?" requires modeling capability, not just visualization.
Third, continuous monitoring: agentic workflows that track share shifts, competitive moves, and distribution changes continuously—not just when analysts remember to check.
Fourth, conversational access: business users asking questions in plain English and getting instant answers, without waiting for analyst reports or learning complex interfaces.
Fifth, retailer-ready outputs: insights that translate directly into category review presentations and JBP conversations, not raw data that requires additional processing.
Tellius is purpose-built for CPG category management and delivers all five capabilities.
26. How is AI-powered category analytics different from Nielsen Connect or Circana Unify?
Nielsen Connect and Circana Unify are data platforms that provide access to syndicated POS data with visualization and reporting capabilities. They're essential sources but have limitations for comprehensive category management.
First, they contain only syndicated data—retailer-specific data, panel data, and internal data must be analyzed separately. Second, they're reporting-focused rather than analysis-focused—they show what happened but don't model what would happen if you changed assortment. Third, they require manual work to extract insights—users must build reports, export data, and reconcile with other sources.
AI-powered category analytics integrates syndicated data with other sources, adds predictive modeling capability, and delivers insights through natural language—turning weeks of manual work into instant answers.
27. What is the best AI platform for CPG category reviews and retailer presentations?
The best AI platform for category reviews automates the 4-6 week preparation cycle and generates retailer-ready insights on demand.
Tellius unifies syndicated, retailer, and panel data automatically—eliminating the data wrangling that consumes most review prep time. Category Managers can ask "Build me a category review for salty snacks at Target" and get comprehensive performance analysis, competitive dynamics, and assortment recommendations.
The platform generates outputs in presentation-ready formats, not just raw data dumps. Share trends, growth decomposition, assortment productivity, and recommendations flow directly into retailer conversations. What took 6 weeks of analyst work becomes same-day delivery.
28. How do I run an effective proof-of-concept for category analytics before committing?
Structure a 4-6 week POC around your actual data and actual users—not vendor demos with sample data.
Phase 1 (weeks 1-2): Connect your Nielsen or Circana feed plus one retailer source—just enough to prove data integration works. The vendor should demonstrate that your product hierarchies align and your metrics match source systems.
Phase 2 (weeks 3-4): Have 2-3 category managers use the platform for real work—a category review, a competitive analysis, an assortment question they're actually trying to answer. Observe whether they can self-serve or constantly need help.
Phase 3 (weeks 5-6): Evaluate based on three criteria: accuracy (do the numbers match your source systems?), usability (did category managers actually use it without hand-holding?), and value (did it change any decisions or save meaningful time?).
The vendor should demonstrate with your data, not generic demos. If they can't or won't connect your feeds during a POC, that's a signal about implementation complexity or confidence in their connectors.
29. Which category should I pilot first, and why does it matter?
Pilot category selection determines whether your initiative gains organizational momentum or stalls. Choose based on three factors:
Data quality: Select a category with strong syndicated coverage and at least 2-3 retailer data sources. Data gaps create frustrating workarounds that undermine confidence in the platform. If your pilot category has spotty Walmart Luminate coverage, every insight will come with caveats.
Business pressure: Select a category facing imminent category reviews, retailer negotiations, or competitive threats. Urgency drives adoption. A pilot with no pressing deadline generates no urgency to learn the platform—and months later, no one has used it.
Champion availability: Select a category where the category manager is analytically curious and willing to provide feedback. Indifferent users generate indifferent results. The wrong pilot (weak data, no urgency, skeptical users) creates a negative reference that makes broader rollout harder.
The right pilot creates internal advocates who pull the platform into additional categories.
30. How does Tellius compare to building category analytics internally?
Building category analytics internally faces three challenges that extend timelines and costs beyond initial estimates.
Syndicated data APIs (Nielsen Connect API, Circana Unify API) present underestimated complexity: product hierarchy mapping between syndicated UPCs, internal SKUs, and retailer item numbers requires ongoing maintenance. Market definitions don't map cleanly to sales territories. Data latency and restatements require versioning logic. Teams typically underestimate these challenges by 6+ months.
Analytics capability requires not just data integration but incrementality modeling, scenario planning, and natural language interfaces—each a substantial engineering investment. Most internal builds plateau at reporting rather than reaching predictive analytics.
Maintenance burden compounds over time. As APIs evolve, retailer data sources change, and business requirements expand, internal teams must continuously reinvest in the platform. Purpose-built platforms like Tellius have solved these integrations across dozens of CPG deployments and maintain them as part of the service.
31. How do I know if my SKU rationalization prediction was right?
Track post-rationalization outcomes against predictions. When the platform predicted "delisting SKU A will shift 40% of volume to SKU B, 25% to competitors, and 35% will leave category," compare to actual results 8-12 weeks after delisting.
Pull the data: What happened to SKU B sales? Did they increase by the predicted 40% of SKU A's former volume? What happened to competitor products in that segment—did they capture the predicted 25%? What happened to total category sales—did they decline by the predicted 35% leakage?
This creates a feedback loop that improves future predictions—and builds organizational confidence in incrementality modeling. The first 2-3 rationalization validations are learning opportunities; by rationalization 5-10, you should see prediction accuracy above 80%.
If predictions consistently miss, investigate whether the model is miscalibrated for your category dynamics, whether execution factors (shelf reset timing, substitute availability) differ from assumptions, or whether shopper behavior in your categories follows different patterns than the model expects.
"We used to spend six weeks preparing each category review. Now we walk into retailer meetings with current data and quantified recommendations. The conversation changed from 'we think you should add this SKU' to 'here's the $2M incremental opportunity and here's exactly why.' "

Stop Building Category Reviews. Start Delivering Category Intelligence.
Your competitors are spending 6 weeks on reviews you can generate in a day. See how AI-powered category analytics changes the game.
The Challenge Every Pharma Commercial Leader Faces
You're drowning in data from IQVIA, claims databases, CRM systems, and competitive intelligence platforms—yet when executives ask "Why did our numbers change?" the answer is always: "We'll need a few days to investigate."
The Problem Isn't Lack of Data — It's Lack of Insights
Traditional dashboards show what happened, not why
Root cause analysis takes days or weeks of manual investigation
Non-technical users can't explore data without submitting IT requests
Insights arrive too late to prevent revenue loss
Multiple tools and data sources create fragmented views
Field teams spend 40% of their time preparing reports instead of selling
Agentic Analytics Changes Everything
Deploy AI agents that work 24/7—continuously monitoring your business, automatically investigating changes, and proactively alerting you to risks and opportunities. From weeks of manual analysis to seconds of AI-generated insights. From reactive reporting to agentic intelligence. From data silos to unified, self-operating analytics.
Introducing Pharma Intelligence
Unified decision intelligence across your entire commercial operation
Pharma teams depend on fast, accurate insights across HCP targeting, field execution, market access, contracting, brand growth, patient services, and incentive compensation. Pharma Intelligence brings all these capabilities together—powered by AI analytics and agentic workflows—to help organizations unify data, explain performance, detect risks, and drive next-best actions across every commercial function.
📊 Analytics Solutions for Every Commercial Function
📊
Analytics Solutions for Every Commercial Function
Each hub addresses critical challenges with unified data, instant root cause analysis, and AI-powered insights. Choose your area to explore how we solve your specific pain points.

Field Force Sales Effectiveness
📝
34 Questions
⏱️
6,000 words
Pharma teams depend on fast, accurate insights across HCP targeting, field execution, market access, contracting, brand growth, patient services, and incentive compensation. Pharma Intelligence brings all these capabilities together—powered by AI analytics and agentic workflows—to help organizations unify data, explain performance, detect risks, and drive next-best actions across every commercial function.
Critical Capabilities:
HCP targeting & segmentation (AI-powered scoring)
Territory performance vs. potential (real-time)
Call quality & message effectiveness (NLP analysis)
Prescriber churn prediction (early warning alerts)
Pre-call planning (automated contextual briefs)

Brand Performance & KPIs
📝
31 Questions
⏱️
6,500 words
Transform business reviews and root cause analysis with instant TRx/NBRx explanations, automated market share decomposition, and complete narrative generation. Uncover hidden opportunities worth millions while reducing prep time from 2 weeks to 2 days—eliminating the endless Excel work and manual investigation cycle.
Critical Capabilities:
TRx/NBRx anomaly detection & auto-explanation
Market share decomposition (instant driver analysis)
Root cause analysis (multi-variable, seconds not days)
Business review automation (narrative + visuals)
Competitive intelligence (continuous tracking)

Market Access Performance
📝
30 Questions
⏱️
5,500 words
Track formulary changes, prior auth approval rates, and payer mix shifts with unified access intelligence—identifying exactly where coverage restrictions cost you scripts before they impact revenue. Get automated alerts on formulary movements, access barriers, and abandonment patterns with recommended interventions.
Critical Capabilities:
Formulary impact alerts (position change detection)
Prior authorization tracking (approval rate trends)
Payer mix dynamics (coverage shift analysis)
Abandonment prediction (access barrier identification)
Copay program ROI (effectiveness measurement)

Contracting & Payer Strategy
📝
30 Questions
⏱️
5,500 words
Optimize contract performance with unified tracking of rebate effectiveness, volume commitments, and ROI across all payer agreements. Model negotiation scenarios, measure contract impact in real-time, and identify which agreements deliver value and which underperform—with recommended actions before renewals.
Critical Capabilities:
Performance vs. expectations (continuous tracking)
Rebate effectiveness (automated optimization)
Scenario modeling (what-if negotiations)
Gross-to-net decomposition (contract-level)
Value-based outcomes (automated tracking)

HCP Targeting & Segmentation
📝
30 Questions
⏱️
5,500 words
Identify high-potential prescribers with AI-powered lookalike modeling, calculate physician lifetime value in real-time, and dynamically adjust segmentation as market conditions change. Find opportunities before competitors while optimizing targeting continuously—without manual deciling or static segment updates.
Critical Capabilities:
High-potential identification (AI-powered scoring)
Lookalike modeling (predictive targeting)
Prescriber LTV calculation (real-time updates)
Dynamic micro-segmentation (adaptive)
Acquisition optimization (prescriber journey)
⚡
Two Powerful Approaches to Analytics Transformation
⚡ Two Powerful Approaches to Analytics Transformation
Combine conversational interfaces for instant answers with agentic intelligence that works proactively—solving both immediate needs and long-term efficiency.

Conversational Analytics & AI Foundations
📝
25 Questions
⏱️
4,500 words
The foundation: Ask questions in plain English and get instant answers. Conversational interfaces democratize data access, automated root cause analysis explains why metrics moved, and predictive models forecast future performance. Essential AI capabilities that transform static dashboards into interactive intelligence.
Foundational AI Capabilities:
Conversational analytics (natural language queries)
Automated root cause analysis (driver decomposition)
Predictive modeling (prescription trend forecasting)
Machine learning (segmentation & targeting)
Unified data integration (IQVIA, CRM, claims, digital)

Agentic Analytics: AI Agents That Work 24/7
📝
25 Questions
⏱️
4,500 words
The evolution: AI agents work continuously 24/7—monitoring your business, automatically investigating anomalies, and proactively alerting you to risks and opportunities before you ask. Move from asking questions to receiving answers you didn't know you needed. This is what separates reactive analytics from agentic intelligence.
Agentic Capabilities:
24/7 monitoring (continuous surveillance)
Automatic anomaly investigation (self-initiated RCA)
Proactive risk alerts (before revenue impact)
Self-optimizing workflows (adaptive intelligence)
Automated business narratives (review generation)
Platform & Technology Questions
Understanding Pharma Intelligence and agentic analytics at the platform level
What is agentic analytics for pharmaceutical commercial operations
Agentic analytics represents the evolution from reactive reporting to proactive intelligence. Unlike traditional analytics where users must ask questions and wait for answers, agentic analytics deploys AI agents that work continuously—monitoring your business 24/7, automatically investigating anomalies, and proactively alerting you to risks and opportunities before you ask. In pharmaceutical commercial operations, this means AI agents track hundreds of metrics across brand performance, field execution, market access, and HCP engagement simultaneously. When meaningful changes occur—like a TRx decline, formulary restriction, or prescriber disengagement—agents automatically perform root cause analysis and deliver specific, actionable recommendations with full context.
How does Pharma Intelligence unify data across commercial functions?
Pharma Intelligence automatically integrates data from IQVIA (prescription trends, market share), Symphony (claims data), CRM systems (Veeva, Salesforce for field activity), payer databases (formulary status, prior auth rates), competitive intelligence, and internal systems. The platform creates a unified semantic layer that harmonizes these disparate sources, resolving HCP identities, aligning geographies, and standardizing metrics. This means field teams, brand managers, market access leaders, and contracting teams all work from the same single source of truth. When an AI agent detects a TRx decline, it can instantly correlate field activity, payer changes, competitive moves, and HCP prescribing patterns—insights impossible when data sits in silos.
What's the difference between AI analytics and agentic analytics?
AI analytics provides conversational interfaces and automated insights—you ask "Why did NBRx decline?" and get instant answers with root cause analysis. This is valuable and represents a major improvement over traditional BI. Agentic analytics goes further: AI agents work autonomously without human prompting. They continuously monitor your business, automatically detect meaningful changes, investigate root causes on their own, and proactively send you alerts with recommendations. Think of it as the difference between having a very smart assistant who answers your questions (AI analytics) versus having a team of analysts working 24/7 who investigate issues and bring you insights before you know to ask (agentic analytics). Most organizations need both layers working together.
What ROI can we expect from deploying agentic analytics?
Typical pharmaceutical companies see $10-17M in annual value creation per brand with 6-9 month payback periods and 1,700%+ first-year ROI. Value comes from four areas: analyst time savings (70-85% reduction, ~$645K annually), proactive issue detection (catching formulary changes, prescriber churn, access barriers 2-4 weeks earlier saves $3-4M), AI-identified opportunities (underserved segments, high-potential HCPs, contract optimization worth $5-10M), and improved forecasting accuracy ($2-3M in better resource allocation). Beyond quantifiable ROI, organizations report dramatically improved executive satisfaction, faster business reviews (2 weeks to 2 days), and field teams spending time selling instead of preparing reports. The platform essentially pays for itself within the first quarter through time savings alone.
How do AI agents work across field force, brand, and market access?
AI agents operate across all commercial functions simultaneously, detecting insights that span multiple teams. For example: an agent monitoring market access detects Aetna added step therapy requirements affecting 8,200 covered lives. It automatically investigates the brand impact (estimated -$2.3M TRx), identifies affected territories and HCPs, analyzes which field reps need to adjust messaging, and calculates the patient support program implications. Within minutes, the agent sends coordinated alerts to market access (escalate with payer), brand team (update forecasts), field leadership (prioritize affected HCPs), and patient services (expect abandonment increase). This cross-functional intelligence—impossible with siloed tools—enables coordinated responses that protect revenue.
How long does deployment take and what resources are needed?
Typical deployment takes 6-12 weeks from kickoff to full production. Week 1-3: Data integration (IQVIA, CRM, claims, payer sources). Week 4-6: Semantic layer configuration and pharma-specific metric definitions. Week 7-9: Agent deployment, alert configuration, and user training. Week 10-12: Optimization and rollout. Required resources: Executive sponsor (5% time), 2-3 business analysts (50% time during deployment), IT liaison (25% time for data access), and key business users for UAT. Post-deployment, platform is largely self-operating—AI agents handle monitoring and investigation automatically. Most organizations need only 1-2 FTEs for ongoing administration, far less than traditional BI platforms that require constant analyst support.
How does this compare to traditional pharma analytics platforms?
Traditional platforms (Tableau, Power BI, Qlik) require users to build dashboards, write SQL, and manually investigate every question. Pharma-specific platforms (IQVIA OCE, Veeva CRM Analytics) provide pre-built reports but still require manual analysis. Neither offers AI agents that work autonomously. With agentic analytics, AI agents continuously monitor and investigate automatically—no dashboard building, no SQL, no waiting. Conversational interfaces let anyone ask questions in plain English. Root cause analysis happens instantly, not in 3-5 days. Business reviews generate automatically. Most importantly: you receive insights proactively before issues impact revenue, rather than discovering problems in retrospective reports. Organizations typically keep existing platforms for specific use cases while Pharma Intelligence becomes the primary decision intelligence layer.
How Agentic Analytics Transforms Your Workflow
How Agentic Analytics Transforms Your Workflow
Unified Data Integration
Automatically connect and harmonize data from IQVIA, Symphony, CRM (Veeva, Salesforce), claims databases, competitive intelligence, and internal systems. No more manual data pulls or Excel wrestling.
Ask Questions in Plain English
Conversational analytics lets anyone ask questions like "Why did NBRx decline in the Northeast last month?" and receive instant answers with automated driver analysis. No SQL, no waiting for reports.
Deploy AI Agents
Agentic analytics agents work 24/7—continuously monitoring hundreds of metrics across all dimensions. When meaningful changes occur, agents automatically investigate root causes, quantify business impact, and send prioritized alerts with specific, actionable recommendations. No human prompting required.
Receive Proactive Insights & Recommendations
Get specific, prioritized alerts with context and next steps: "Prior auth denials increased 18% with Aetna in Q3. Estimated TRx impact: -$2.3M. Root cause: New step therapy requirement. Recommend: Escalate to market access team within 48 hours, review formulary status across all major payers." Know what to do, not just what happened.
Jump to Your Specific Challenge
AI agents answer your questions across three levels: foundational understanding, agentic capabilities, and business impact measurement.
🎯
Understanding Challenges & Best Practices
🎯 Understanding Challenges & Best Practices
🤖
AI Agents & Agentic Capabilities
🤖 AI Agents & Agentic Capabilities
💰
Platform Evaluation & Business Impact
💰 Platform Evaluation & Business Impact
Real Results from Deploying Agentic Analytics
How AI agents deliver measurable business impact across pharmaceutical commercial operations
Top 10 Pharma — Oncology Brand
85% reduction in monthly review prep with automated business narratives
AI agents identified $12M opportunity in underserved community oncology
Proactive formulary alerts detected risk 3 weeks earlier, saved $8M
ROI: 2,200% in first year with agentic monitoring
Specialty Pharma — Neurology
Analyst team reduced from 4 FTEs to 2 with agentic automation
15% NBRx improvement through AI-optimized HCP targeting
Agentic anomaly detection prevents $3-5M revenue loss annually
Payback period: 7 months from agent deployment
Mid-Size Pharma — Cardiovascular
AI agents generate weekly reviews in 2 hours vs. 2 days
Root cause analysis: instant vs. 3-5 days of manual investigation
Agents found $18M in hidden payer contract optimization opportunities
Executive satisfaction: 4.2 → 9.1/10 with agentic insights
Calculate Your ROI from Agentic Analytics
See what you could save by deploying AI agents across your commercial operations
Typical ROI from Agentic Analytics Deployment
Value from AI agents: Analyst time savings ($645K), proactive issue detection ($3-4M), AI-identified opportunities ($5-10M), improved forecasting ($2-3M), 24/7 monitoring & investigation (at fraction of human cost)
Breakthrough Ideas, Right at Your Fingertips
Dig into our latest guides, webinars, whitepapers, and best practices that help you leverage data for tangible, scalable results.
.webp)
Agentic AI in Supply Chain: Use Cases, Platforms, and What's Shipping (2026)
Supply chain leaders are moving beyond predictive dashboards and generative AI toward agentic systems that can monitor operations, investigate disruptions, recommend actions, and orchestrate workflows across the enterprise. This guide explores the state of agentic AI in supply chain management in 2026, comparing the leading platforms and highlighting the use cases that are delivering measurable business value today. Learn how organizations are deploying AI agents for demand sensing, inventory optimization, supplier risk monitoring, procurement intelligence, logistics planning, production scheduling, transportation optimization, and exception management.
.webp)
Best FP&A Software in 2026: The Tools That Plan, and the Layer That Explains Why
Modern FP&A teams need more than planning software—they need the ability to explain financial performance, identify the drivers behind change, and act faster on emerging risks and opportunities. This buyer's guide compares the leading FP&A platforms in 2026 across budgeting, forecasting, scenario modeling, financial consolidation, reporting, AI-assisted planning, and enterprise analytics. It also introduces a new evaluation framework: distinguishing the systems that plan from the intelligence layer that explains why.
.webp)
Best Pharma Launch Analytics Platforms in 2026: What Each One Does Best
Launching a new therapy has never been more data-intensive—or more complex. Commercial teams must coordinate brand strategy, field execution, HCP engagement, market access, patient adoption, omnichannel performance, and competitive intelligence while making decisions in near real time. This buyer's guide compares the leading pharma launch analytics platforms in 2026, evaluating what each solution does best across launch planning, forecasting, HCP targeting, territory performance, market access analytics, omnichannel measurement, patient journey insights, and AI-powered commercial intelligence.
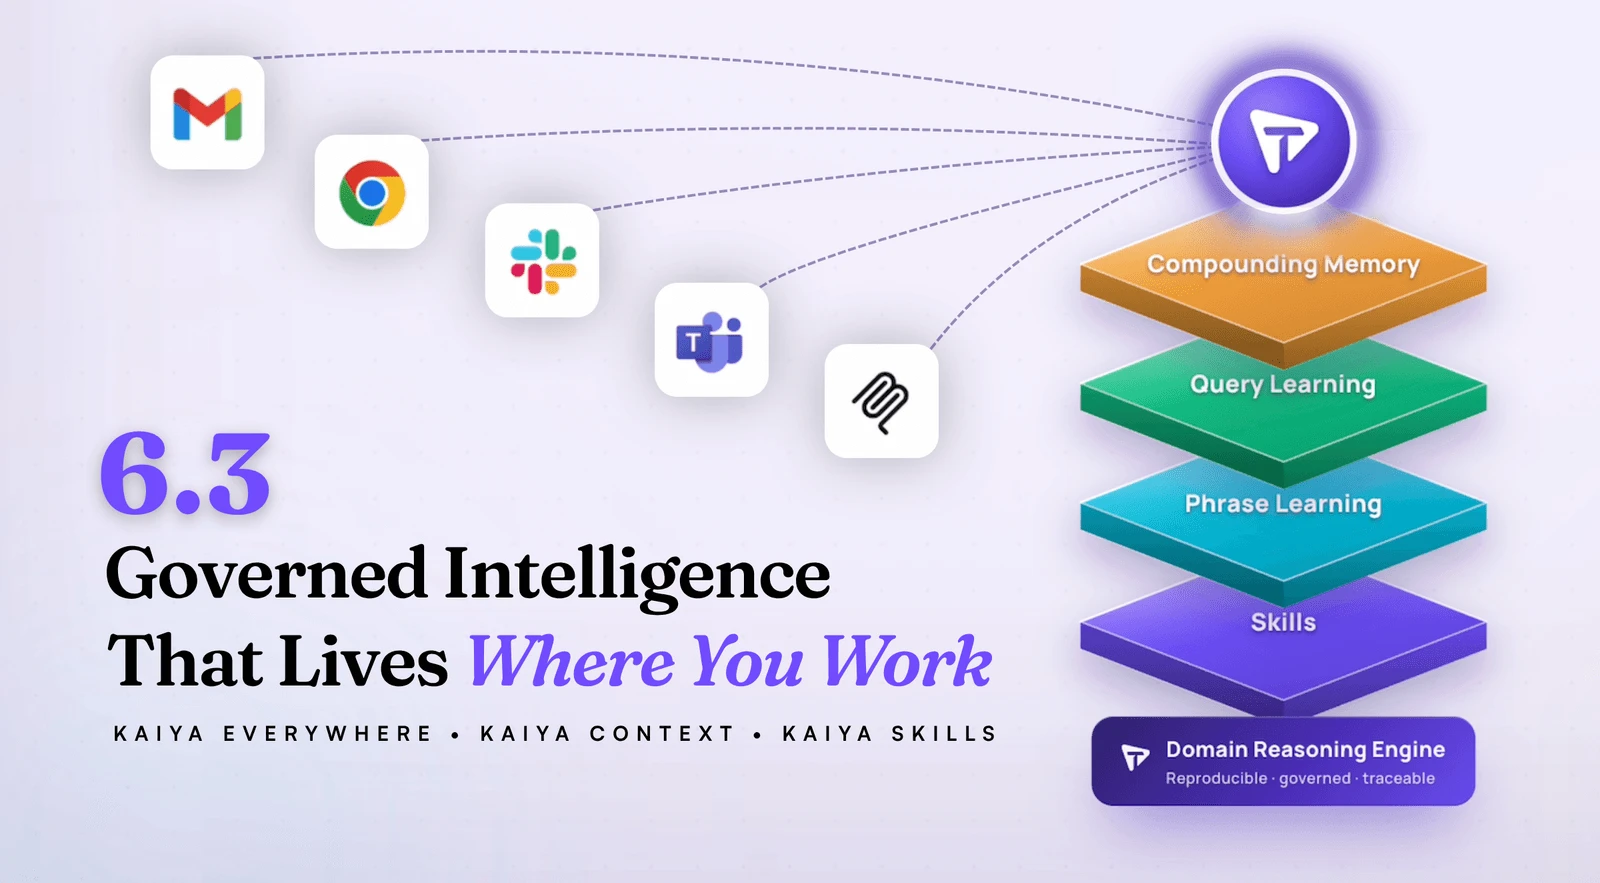
Tellius 6.3: Kaiya Everywhere, Grounded in Your Business
AI answers are only useful when they're grounded in your business and available where decisions actually happen. See how Tellius 6.3 delivers fast, traceable insights across pharma, CPG, RevOps, and FP&A — right in the tools your team already uses.


PMSA Fall Symposium 2025 in Boston
Join Tellius at PMSA Oct 2–3 for two can’t-miss sessions: Regeneron on how they’re scaling GenAI across the pharma brand lifecycle, and a hands-on workshop on AI Agents for sales, HCP targeting, and access wins. Discover how AI-powered analytics drives commercial success.
.webp)
Tellius AI Agents: Driving Real Analysis, Action, + Enterprise Intelligence
Tellius AI Agents transform business intelligence with dedicated AI squads that automate complex analysis workflows without coding. Join our April 17th webinar to discover how these agents can 100x enterprise productivity by turning questions into actionable insights, adapting to your unique business processes, and driving decisions with trustworthy, explainable intelligence.