AI-Powered Retailer Analytics for CPG: Walk Into Every Meeting With Better Data Than the Buyer
JBP prep shouldn't take three weeks. AI-powered retailer analytics delivers account-specific performance, competitive positioning, and growth opportunities in natural language, on demand.
Every retailer conversation requires custom analysis—performance at this account, competitive dynamics at this account, opportunities at this account. Your team spends weeks preparing for each JBP cycle, pulling the same data from different angles for different buyers. And when the retailer asks an unexpected question mid-meeting, the answer is "I'll get back to you"—which means you've already lost.
What is AI-Powered Retailer Analytics?
Retailer analytics is an AI-powered approach that delivers account-specific performance insights, competitive intelligence, and growth opportunities for CPG commercial teams managing retail partnerships—reducing Joint Business Planning (JBP) prep time from 3-4 weeks to hours.
Unlike traditional reporting that provides national or channel-level views, AI-powered retailer analytics disaggregates performance to the individual account level—showing how your brands perform at Walmart versus Kroger versus Target, identifying retailer-specific opportunities and threats, and generating JBP insights on demand. It answers the questions retailers actually ask: "How are you growing my category?" and "Why should I give you more space?"
Tellius is a retailer analytics platform purpose-built for CPG teams—combining conversational analytics for instant account answers with agentic analytics that monitors retailer performance continuously and flags account-specific issues before business reviews.
The Problem
You're bringing a knife to a data fight
Retailers have more data about your business than you do. They see every transaction, every basket, every shopper. You're reconciling syndicated data with retailer feeds, hoping the numbers match, and building custom analyses that take weeks to complete. By the time you're ready for JBP, your insights are stale—and the retailer's data tells a different story.
Sales and key account teams operate without real-time account intelligence, cross-retailer explanations, or in-meeting answers—every JBP cycle starts from scratch

JBP prep takes 3-4 weeks because every retailer meeting requires custom analysis—account-specific performance, competitive positioning, and opportunity sizing—pulled manually from multiple data sources.
Retailer questions go unanswered in meetings because ad-hoc analysis requires going back to the office, pulling data, and following up days later—by which time the conversation has moved on.
Account performance varies but you can't explain why because understanding what drives success at Kroger versus underperformance at Safeway requires analysis that compares account-specific dynamics.
Retailer-specific opportunities are invisible because identifying where you're under-distributed, under-promoted, or under-velocitied at each account requires account-level analysis that doesn't scale manually.
Category captain responsibilities overwhelm the team because providing retailer-neutral category recommendations while managing your own brand interests requires analysis capacity you don't have.
Retailer data doesn't match your data because syndicated data, retailer feeds, and internal systems use different hierarchies, time periods, and definitions—creating reconciliation headaches before every meeting.

What good retailer analytics looks like (without the 3-week prep cycle)

AI-Powered JBP Preparation: Account-specific performance views, competitive dynamics, and growth opportunities generated on demand—JBP prep in hours, not weeks.
Real-Time Account Intelligence: Ask "How is our brand performing versus category at this retailer?" during the meeting and get the answer instantly, in natural language.
Cross-Account Performance Decomposition: AI explains why performance differs across retailers—distribution gaps, velocity differences, promotional effectiveness, competitive intensity.
Account-Level Opportunity Identification: AI identifies retailer-specific gaps—distribution voids, promotion opportunities, velocity upside—prioritized by revenue potential.
Category Captain Intelligence: Total-category analytics that support retailer-neutral recommendations—category growth drivers, assortment optimization, and white space analysis.
Unified Retailer Data Layer: Syndicated data, retailer-specific feeds, and internal data harmonized into one governed view per account—no more "your numbers versus my numbers" debates.
The results
The ROI of knowing your retailers better than they know you
75
%+
90%+
$3M+
15%+

Why tellius
How AI Transforms Retailer Analytics

Unify
Connect syndicated data (Nielsen, Circana), retailer-specific feeds (Walmart Luminate, Kroger 84.51°, Target Roundel), and internal data into account-specific views. Harmonize hierarchies so your numbers match the retailer's.

Explain
AI generates account-specific insights—performance drivers, competitive dynamics, and opportunity sizing. Ask "Why are we underperforming at Kroger?" and get root cause analysis, not just charts.

Act
Agentic workflows monitor each major account continuously—flagging share erosion, distribution losses, competitive gains, and execution gaps before quarterly reviews surface them.
Questions & Answers
Real Questions from CPG Key Account & Commercial Teams
Part 1: Retailer Analytics Fundamentals
Understand what retailer analytics is, why it matters, and what problems it solves.
1. What is retailer analytics and how does AI change it?
Retailer analytics focuses on account-level performance—how your brands and categories perform at specific retailers, what drives performance differences across accounts, and what opportunities exist at each retailer. It's the lens that sales and key account teams need.
Brand analytics focuses on brand performance across the market—national share, competitive dynamics, portfolio health. Category analytics focuses on category performance and assortment optimization. Both typically aggregate across retailers or provide limited account breakouts.
Retailer analytics disaggregates to the account level. "We have 15% share nationally" becomes "We have 18% share at Walmart, 14% at Kroger, and 11% at Target—here's why, and here's the opportunity at each."
AI enables retailer analytics at scale by automating the account-specific analysis that previously required manual work for each retailer. What took weeks of data assembly and custom analysis now happens on demand through natural language queries.
2. Why does retailer-level analytics matter for CPG commercial teams?
Retailer-level analytics matters because retail performance varies dramatically by account—and the reasons for that variation drive different actions.
A brand might have strong national share but underperform at specific retailers due to distribution gaps, poor shelf positioning, promotional under-investment, or competitive intensity. National averages hide these account-specific dynamics.
Key account teams need account-specific insights to: prepare for retailer meetings with relevant data, identify growth opportunities at each account, explain performance differences to leadership, and negotiate from a position of knowledge rather than guessing.
Without retailer-level analytics, commercial teams operate with incomplete information—using national data to have retailer-specific conversations.
3. What is Joint Business Planning (JBP) and why does it require specialized analytics?
Joint Business Planning is a collaborative process between CPG manufacturers and retailers to align on shared growth objectives, typically conducted annually with quarterly reviews. JBP conversations cover assortment, promotion, pricing, shelf strategy, and new item placement.
JBP requires specialized analytics because every discussion point needs retailer-specific data. "How should we optimize assortment at Kroger?" requires Kroger-specific performance, shopper insights, and competitive dynamics—not national averages.
Effective JBP analytics includes: account-specific performance trends, retailer-level competitive share, shopper demographics and behavior at that retailer, promotion effectiveness at that account, distribution and availability metrics, and category growth opportunities.
Preparing this analysis manually takes weeks. AI-powered retailer analytics generates it on demand.
4. How do retailer data platforms like Walmart Luminate and Kroger 84.51° fit into retailer analytics?
Retailer data platforms provide account-specific data that syndicated sources can't match. Walmart Luminate offers store-level sales, inventory, shopper demographics, and search behavior. Kroger 84.51° provides household-level purchase data, loyalty insights, and targeting capabilities. Target Roundel, Amazon Retail Analytics, and other platforms offer similar retailer-specific intelligence.
These platforms are essential inputs to retailer analytics—they provide the granular, retailer-specific data that makes account-level analysis meaningful. But they're also siloed: each platform requires separate login, separate data pulls, and separate analysis.
AI-powered retailer analytics integrates these platforms with syndicated data and internal data, creating unified account views. Instead of logging into five platforms to understand Walmart performance, you get one integrated view that combines all relevant data sources.
5. Who uses retailer analytics and what questions do they ask?
Key Account Managers and National Account Directors use retailer analytics to prepare for retailer meetings, identify growth opportunities, and track account performance. Their questions include "How is our brand performing versus category at Kroger?" and "What's driving the gap between our Walmart and Target performance?"
Sales Leadership uses retailer analytics for account portfolio management and resource allocation. They ask "Which accounts have the most untapped opportunity?" and "Where should we focus investment for maximum return?"
Category Managers supporting retail partnerships use retailer analytics to provide category-level recommendations. They ask "How is the category performing at this retailer versus market?" and "What assortment changes would grow the category?"
Trade Marketing uses retailer analytics to optimize promotional investment by account. They ask "Which promotional tactics work best at Walmart versus Kroger?" and "Where should we shift trade spend?"
6. How does AI reconcile syndicated data with retailer-specific data?
Syndicated and retailer data often tell different stories because they use different methodologies. Syndicated data (Nielsen, Circana) projects store-level data to market totals using sampling and projection. Retailer data represents actual transactions at that retailer but may use different product hierarchies and time periods.
AI automates reconciliation by learning the mappings between data sources and flagging discrepancies that require investigation. When retailer data shows 12% share and syndicated shows 14%, AI identifies whether the gap is methodological or signals a real issue worth investigating.
Reconciliation requires: aligning product hierarchies (mapping retailer SKUs to syndicated UPCs), aligning time periods (matching retailer weeks to syndicated weeks), understanding methodological differences (projected versus actual), and identifying which source is more reliable for which purpose. AI handles these mappings automatically rather than requiring manual reconciliation for each analysis.
7. What's the difference between sell-in and sell-through analytics for retailers?
Sell-in measures shipments from manufacturer to retailer—what you sold to the retailer. Sell-through measures sales from retailer to consumer—what actually sold off the shelf.
Both perspectives matter for retailer analytics. Sell-in reflects your shipping volume and revenue. Sell-through reflects consumer demand and retailer inventory health. The gap between sell-in and sell-through is retailer inventory—building inventory (sell-in > sell-through) or depleting it (sell-through > sell-in).
Healthy retailer relationships require sell-in and sell-through alignment. If you're shipping more than the retailer is selling, inventory builds and future orders decline. If sell-through exceeds sell-in, you're leaving sales on the table due to availability gaps.
AI connects sell-in and sell-through data to identify misalignment before it becomes a problem—flagging accounts where inventory is building or where demand is outpacing supply.
8. What data sources are essential for comprehensive retailer analytics?
Comprehensive retailer analytics requires four data categories. First, syndicated market data (Nielsen, Circana) for market context—category trends, competitive share, national benchmarks to compare against retailer-specific performance.
Second, retailer-specific data platforms (Walmart Luminate, Kroger 84.51°, Target Roundel) for account-level sales, inventory, shopper insights, and execution metrics unique to each retailer.
Third, internal data including shipments (sell-in), trade spend, promotional calendars, and account plans—connecting your actions to retailer results.
Fourth, panel data (Numerator, NIQ) for shopper behavior insights—understanding who shops at each retailer, how their baskets differ, and how purchase behavior varies by account.
The integration challenge is harmonizing these sources into coherent account views—different hierarchies, different time periods, different definitions. AI-powered platforms automate this harmonization.
Part 2: Account Performance, JBP & Retailer Relationships
Deep dive into account-level analysis, JBP preparation, and building stronger retailer partnerships.
9. How does AI help prepare for JBP meetings more efficiently?
JBP preparation traditionally requires weeks of manual work: pulling syndicated data for the specific account, reconciling with retailer data, building competitive analysis, sizing opportunities, and creating presentation materials. Most teams have templated approaches but still spend 60-80 hours per major account.
AI reduces JBP prep from weeks to hours by automating the data assembly and initial analysis. Account-specific performance views, competitive dynamics, opportunity sizing, and shopper insights are generated on demand rather than manually compiled.
The key is having the right questions ready. AI can answer "How did our share at this retailer change versus last year?" instantly—but you need to know that's the question to ask. Experienced key account managers typically develop a standard JBP question set, then let AI generate the answers.
10. What questions should I be prepared to answer in retailer meetings?
Retailer meetings typically probe five areas. Performance questions: "How are you performing in my stores?" "Why did your share decline?" "What's driving your growth (or lack of it)?"
Opportunity questions: "What's the incremental opportunity if I add your new SKU?" "What space are you requesting and why?" "How will your promotion perform?"
Category questions: "How can you help me grow the category?" "What trends should I be watching?" "What's your competitor doing?"
Shopper questions: "Who's buying your products in my stores?" "How do your shoppers differ from category shoppers?" "What basket affinity do your products have?"
Competitive questions: "What are your competitors doing?" "How do you plan to respond to [competitor action]?" "Why are you losing share to [competitor]?"
AI-powered retailer analytics enables real-time answers to all five categories—no more "I'll get back to you."
11. How does AI explain why performance differs across retailers?
Performance differences across retailers stem from multiple factors: distribution (you may have more/fewer SKUs authorized), velocity (products may sell faster/slower at different retailers), promotion (promotional support and effectiveness varies), competition (competitive intensity differs by account), and shopper base (retailer shoppers have different demographics and preferences).
AI automates cross-account decomposition, showing exactly what drives performance differences. "The 6-point share gap versus Target decomposes as: +3 points from distribution (2 additional SKUs), +2 points from velocity (15% higher turns), +1 point from promotional lift (25% more promotional weeks)."
This decomposition happens instantly rather than requiring days of manual analysis. When leadership asks "Why are we doing better at Walmart than Target?", AI provides the quantified answer immediately.
12. How does AI identify growth opportunities at specific retailers?
Retailer-specific opportunities fall into four categories. Distribution opportunities: SKUs you sell elsewhere that aren't authorized at this retailer, or authorized SKUs with store-level voids. Velocity opportunities: products selling below their potential due to shelf position, pricing, or promotional support. Share opportunities: categories or segments where you underindex at this retailer versus market. New item opportunities: launches performing well elsewhere that could be introduced at this account.
AI identifies opportunities by comparing account performance to benchmarks—your performance at other retailers, competitor performance at this retailer, category performance versus your brand performance. Gaps between current state and benchmark represent quantifiable opportunity.
Prioritization considers opportunity size (revenue potential), feasibility (retailer receptivity, competitive barriers), and strategic fit (brand priorities, relationship dynamics). AI ranks opportunities automatically rather than requiring manual analysis for each account.
13. How does AI size opportunities for retailer recommendations?
Retailers want numbers. "You should add our SKU" isn't compelling. "Adding this SKU would generate $2.4M incremental category sales based on performance at comparable retailers" is compelling.
AI automates opportunity sizing by maintaining comparable databases and applying sizing methodologies consistently. Ask "What's the opportunity from adding our new premium SKU at Target?" and get a sized estimate with supporting analysis.
Opportunity sizing requires: establishing the comparable basis (similar retailers, similar stores, similar markets), measuring performance at the comparable (velocity, distribution, share), calculating the gap between current and comparable, and adjusting for retailer-specific factors (shopper differences, competitive intensity, space constraints). AI handles these calculations automatically.
14. How do I compare promotional effectiveness across retailers?
Promotional effectiveness varies dramatically by retailer. The same 20% Temporary Price Reduction (TPR) might generate 40% lift at one retailer and 15% at another due to shopper responsiveness, competitive promotional intensity, execution compliance, and retailer promotional ecosystem.
Comparing across retailers requires: measuring lift and ROI by retailer using consistent methodology, controlling for promotional variables (tactic type, depth, timing), understanding retailer-specific factors that affect response, and identifying best practices from high-performing accounts.
AI enables cross-retailer promotional comparison by calculating lift and ROI consistently across accounts. "Buy One Get One (BOGO) promotions generate 35% average lift at Kroger versus 22% at Safeway. The gap is primarily explained by higher competitive promotional intensity at Safeway."
15. What is category captain responsibility and how does analytics support it?
Category captains serve as the retailer's category advisor—providing recommendations on total category assortment, shelf layout, and promotional strategy. This requires retailer-neutral analysis that benefits the category, not just your brands.
Category captain analytics must demonstrate objectivity. Recommendations should be grounded in data that shows category benefit, not just brand benefit. This means analyzing total category performance, all-brand assortment productivity, competitive dynamics, and shopper needs—then making recommendations that serve category growth.
AI supports category captain work by: generating total-category analytics (not just your brands), identifying white space opportunities regardless of which supplier fills them, modeling assortment scenarios objectively, and producing retailer-ready insights that demonstrate analytical rigor.
16. How do I have a productive conversation with a retailer about their poor promotional compliance?
Compliance conversations go poorly when they feel accusatory. Productive approach: frame as partnership for shared success, bring specific store data (not just assertions), quantify the mutual loss (your missed ROI + their missed category sales), and propose solutions rather than just complaints.
Example: "Our BOGO saw 45% lift at stores with verified display execution but only 8% lift at stores without—that's a gap of about $400K in category sales we both missed. Here's the list of 200 stores where our field team couldn't verify displays. Can we review your execution process for our next event?"
Data-backed conversations shift from blame-casting to problem-solving—and demonstrate that you're investing in analytical capability that benefits the retailer too.
17. How does AI help manage multiple retailer relationships with limited resources?
Most CPG companies have more accounts than analysts. Key accounts get deep analytical support; mid-tier accounts get periodic attention; tail accounts get minimal coverage. This creates blind spots where performance issues or opportunities go unnoticed.
AI extends analytics coverage by automating the monitoring and alerting that previously required manual attention. Agentic workflows track performance across all accounts continuously, flagging issues and opportunities regardless of account tier.
This doesn't eliminate the need for strategic analysts—but it shifts their role from data assembly to insight interpretation and action recommendation. The analyst who spent three weeks preparing Kroger JBP materials can instead interpret AI-generated insights and develop strategic recommendations.
18. How do I use shopper insights to strengthen retailer relationships?
Retailers care deeply about their shoppers—understanding who shops at their stores, what they buy, and what drives their behavior. Bringing shopper insights to retailer conversations demonstrates value beyond just selling your products.
Relevant shopper insights include: how your category shoppers compare to average store shoppers, what basket affinities exist with your products, how shopping trips involving your products differ from average trips, and what shopper segments are over/under-developed at this retailer.
AI integrates panel data and loyalty insights to generate retailer-specific shopper views. "Your store's category shoppers over-index on premium products but you're under-distributed in premium—that's a $5M gap we can close together."
19. How does category analytics connect to retailer-specific strategy?
Category analytics provides the foundation for retailer conversations, but retailer-specific strategy requires account-level customization. Category performance varies by retailer—a category growing 5% nationally might be growing 8% at Walmart and declining 2% at Target.
The connection works in both directions: category insights inform retailer strategy (what assortment changes would benefit this retailer's category?), and retailer insights inform category strategy (what's working at top-performing accounts that could transfer elsewhere?).
AI connects category analytics to retailer strategy by generating account-specific category views—showing how national category trends manifest at each retailer, where this retailer over or underperforms category benchmarks, and what account-specific actions would improve category performance.
Part 3: Platform Evaluation & Implementation
Evaluate retailer analytics platforms, understand implementation, and build the business case.
20. Can I get account-specific insights for a single priority retailer before full deployment?
Yes. Accelerated deployment for a single priority account can deliver JBP-ready insights in 4-5 weeks by focusing integration effort on one retailer data source (e.g., Walmart Luminate) plus syndicated data. This creates a working proof of concept for your most important account while broader multi-retailer integration continues in parallel.
Teams facing imminent JBP deadlines often pursue this approach—getting Walmart insights operational before expanding to Kroger, Target, and other accounts. The trade-off is sequenced value delivery: you get one account working quickly rather than waiting 10-12 weeks for comprehensive multi-retailer coverage.
The single-account approach also validates the platform's fit for your team. If key account managers find value in Walmart analytics, you have internal champions for the broader rollout. If issues emerge, you've discovered them before committing to full deployment.
21. How does retailer analytics integrate with existing systems?
Retailer analytics complements rather than replaces existing systems. Retailer data platforms (Walmart Luminate, Kroger 84.51°) remain sources for account-specific data. Syndicated platforms (Nielsen Connect, Circana Unify) remain sources for market context. CRM and account planning systems continue managing relationship workflows.
Integration works through data flows: retailer analytics pulls from these sources to create unified account views. Outputs can feed existing workflows—account insights pushed to CRM, JBP materials generated in presentation formats, alerts routed to account teams.
The goal is creating the unified account intelligence that doesn't exist in any single source—not replacing the sources themselves.
22. What can AI answer for key account managers during live retailer meetings?
Real-time AI query capability transforms retailer dynamics. When the buyer asks "What's driving your share decline in my stores?", query live and answer immediately: "Share decline is primarily velocity-driven—we're 15% below category velocity at your banner versus 5% above at comparable retailers. Promotional intensity gap appears to be the driver—we have 30% fewer promoted weeks here than at similar accounts."
When they ask "Why should I authorize your new SKU?", query: "At retailers with similar shopper demographics, this SKU generates $2,400/week velocity and 85% incrementality versus portfolio. The opportunity at your store base is approximately $3M annually."
The difference between these in-meeting answers and "I'll get back to you next week" is often the difference between winning and losing the recommendation. Key account managers using conversational analytics in meetings report qualitative shifts in retailer perception—buyers recognize analytical capability and treat manufacturers as more strategic partners.
23. What's the cost of saying "I'll get back to you" in a retailer meeting?
Every "I'll get back to you" moment costs credibility that compounds over time. Retailers interpret analytical gaps as lack of preparation, lack of investment in the relationship, or lack of sophistication. These perceptions affect shelf decisions, promotional calendar positioning, and new item authorization.
More directly, follow-up responses arrive after the conversation has moved on—the retailer has already made their decision, often unfavorably. The hardest ROI to quantify is the deals that never happened because the retailer concluded you weren't analytically capable enough to be a strategic partner.
Teams that can answer questions in real-time report qualitative improvements in retailer relationships that translate to better outcomes in negotiations. One key account director described the shift: "We went from being a vendor they manage to a partner they consult."
24. What's the ROI of AI-powered retailer analytics?
AI-powered retailer analytics delivers ROI across three dimensions: time savings, negotiation outcomes, and continuous intelligence.
Time savings: JBP prep drops from 3-4 weeks to days—a 75%+ reduction. For teams managing 10+ major accounts with quarterly reviews, this frees hundreds of hours annually for strategic work instead of data assembly.
Negotiation outcomes: Teams report 15-25% better outcomes in JBP negotiations when they arrive with retailer-specific incrementality data, shopper insights the retailer hasn't seen, and real-time query capability. On a $50M account, 20% improvement translates to $10M+ in annual value.
Continuous intelligence: Agentic monitoring surfaces share erosion, distribution losses, and competitive gains in real-time rather than waiting for quarterly reviews—catching issues weeks earlier when intervention is still possible.
25. What is the best AI platform for retailer analytics in CPG?
The best AI platform for retailer analytics needs five capabilities most tools lack.
First, multi-retailer data integration: seamless connection to Walmart Luminate, Kroger 84.51°, Target Roundel, and other retailer platforms alongside syndicated data—with automated hierarchy harmonization across sources.
Second, account-level analytics: performance decomposition, opportunity identification, and competitive analysis at the individual retailer level—not just national or channel aggregates.
Third, cross-account comparison: the ability to explain why performance differs across retailers and identify best practices that can transfer between accounts.
Fourth, conversational access: key account managers asking questions in plain English and getting instant retailer-specific answers, without building reports or navigating complex interfaces.
Fifth, JBP-ready outputs: insights that translate directly into retailer presentations and business review materials, not raw data requiring additional processing.
Tellius is purpose-built for CPG retailer analytics and delivers all five capabilities.
26. What can AI generate automatically versus what still requires human strategic input for JBP?
AI can generate automatically: performance summaries (share, velocity, distribution trends versus prior periods), decomposition analysis (why performance changed), opportunity sizing (what adding SKU X would deliver based on comparable performance), competitive positioning (how you compare to competitors at this account), and shopper profiles (who shops at this retailer and how they differ).
Human strategic input is still required for: negotiation strategy (what to ask for and what to concede), relationship management (how to frame requests given relationship history), prioritization (which opportunities to pursue given limited retailer receptivity), creative positioning (how to tell a compelling story, not just present data), and commitments (what you're willing to invest to capture opportunities).
The AI handles the analytical heavy lifting that consumes weeks. The human brings judgment about what to do with the analysis. The combination—instant analytics plus experienced account management—creates the advantage.
27. How granular can AI-powered account decomposition get—store level? Region level?
AI-powered account decomposition can extend to whatever granularity your data supports. Most retailer data platforms (Walmart Luminate, Kroger 84.51°) provide store-level data, enabling decomposition at any aggregation: total account, region, division, market, or individual store.
Regional decomposition is valuable for understanding geographic variation within an account. "Your share is 2 points below account average in the Southeast region—decomposition shows this is entirely distribution-driven; you're missing 3 SKUs that are authorized elsewhere."
Store-level decomposition identifies specific locations driving account-level trends. "Share decline at this account is concentrated in 200 stores representing 15% of volume. These stores share two characteristics: they're in urban centers and they have a specific competitor display program we don't have."
The limitation is typically data availability, not analytical capability. Where store-level data exists, AI can decompose at store level.
28. What happens to my retailer analytics build when Walmart Luminate changes their API?
Retailer data platforms update frequently—new data elements, changed API structures, and modified access requirements. Walmart Luminate alone makes significant changes 3-4 times per year. Each change requires engineering time to understand the update, modify integration code, validate that historical data still aligns, and redeploy.
With 5-10 major retailer platforms to maintain, API changes become a continuous engineering obligation. Your data engineering team signed up for a project; they inherited an ongoing maintenance commitment. And because these changes happen without warning, they interrupt whatever else engineering had planned.
Purpose-built platforms absorb this maintenance as part of the service—when Kroger 84.51° changes their data structure, the platform vendor updates their integration, not your team. The hidden cost of building in-house is often this perpetual maintenance, not the initial build.
29. What should a retailer analytics demo look like versus what vendors typically show?
Vendors typically show polished demos with sample data, highlighting features you may never use. What you should demand instead: your actual retailer data connected during the demo (not mocked up), your actual team members asking their actual questions (not scripted queries), and live troubleshooting when something doesn't work as expected (not "we'll follow up on that").
Ask to see your Walmart Luminate data reconciled against your Nielsen data for the same period—watch how the platform handles discrepancies. Ask a key account manager to query something they actually need for an upcoming retailer meeting. If the demo environment can't handle real-world messiness, neither will the production platform.
The demo should feel like a working session, not a presentation. Vendors confident in their platform welcome this approach. Vendors who insist on scripted demos with generic data may be hiding capability gaps.
30. Should I start retailer analytics with my best account or my most problematic one?
Start with your highest-stakes account—typically a top-3 retailer where JBP conversations are frequent and consequential. This is counterintuitive (shouldn't you practice on lower-stakes accounts first?) but strategically correct.
First, high-stakes accounts have the best data—Walmart Luminate and Kroger 84.51° provide richer intelligence than smaller retailer portals, making early wins easier. Second, high-stakes accounts justify investment—demonstrating value at your biggest account makes the ROI case self-evident. Third, high-stakes accounts create organizational pull—when the Walmart team has capabilities the Target team lacks, the Target team demands access.
The risk of "practicing" on low-stakes accounts is investing months without generating visible value that drives broader adoption. Start where success matters most, and let that success pull the platform into additional accounts.
31. How do I verify that my retailer-specific insights match what the retailer sees?
Retailer alignment requires three validation approaches. First, metric comparison: pull the same metrics from your analytics platform and directly from the retailer's portal (Walmart Luminate, Kroger 84.51°) for the same time period—they should match within expected methodological variance (typically 2-5%).
Second, insight validation: share a preliminary finding with your retail buyer and observe their reaction—do they recognize the pattern you're describing? Third, recommendation validation: after presenting an opportunity, track whether the retailer engages or dismisses it. If your "high-opportunity" recommendations consistently get rejected, either your opportunity sizing is off or your recommendations don't align with retailer priorities.
Validation builds credibility for future conversations. The first few JBP meetings with new analytics capabilities are as much about establishing trust as driving outcomes. Once the retailer trusts your numbers match theirs, conversations become more productive.
"We used to spend a month getting ready for Walmart JBP. Now I generate account-specific insights in an hour, walk into meetings with better data than the buyer has, and answer their questions in real-time. The relationship has completely changed."

Stop Preparing for Retailers. Start Outperforming Them.
Every retailer meeting is a data competition. AI-powered retailer analytics ensures you walk in with better insights than the buyer—every time.
The Challenge Every Pharma Commercial Leader Faces
You're drowning in data from IQVIA, claims databases, CRM systems, and competitive intelligence platforms—yet when executives ask "Why did our numbers change?" the answer is always: "We'll need a few days to investigate."
The Problem Isn't Lack of Data — It's Lack of Insights
Traditional dashboards show what happened, not why
Root cause analysis takes days or weeks of manual investigation
Non-technical users can't explore data without submitting IT requests
Insights arrive too late to prevent revenue loss
Multiple tools and data sources create fragmented views
Field teams spend 40% of their time preparing reports instead of selling
Agentic Analytics Changes Everything
Deploy AI agents that work 24/7—continuously monitoring your business, automatically investigating changes, and proactively alerting you to risks and opportunities. From weeks of manual analysis to seconds of AI-generated insights. From reactive reporting to agentic intelligence. From data silos to unified, self-operating analytics.
Introducing Pharma Intelligence
Unified decision intelligence across your entire commercial operation
Pharma teams depend on fast, accurate insights across HCP targeting, field execution, market access, contracting, brand growth, patient services, and incentive compensation. Pharma Intelligence brings all these capabilities together—powered by AI analytics and agentic workflows—to help organizations unify data, explain performance, detect risks, and drive next-best actions across every commercial function.
📊 Analytics Solutions for Every Commercial Function
📊
Analytics Solutions for Every Commercial Function
Each hub addresses critical challenges with unified data, instant root cause analysis, and AI-powered insights. Choose your area to explore how we solve your specific pain points.

Field Force Sales Effectiveness
📝
34 Questions
⏱️
6,000 words
Pharma teams depend on fast, accurate insights across HCP targeting, field execution, market access, contracting, brand growth, patient services, and incentive compensation. Pharma Intelligence brings all these capabilities together—powered by AI analytics and agentic workflows—to help organizations unify data, explain performance, detect risks, and drive next-best actions across every commercial function.
Critical Capabilities:
HCP targeting & segmentation (AI-powered scoring)
Territory performance vs. potential (real-time)
Call quality & message effectiveness (NLP analysis)
Prescriber churn prediction (early warning alerts)
Pre-call planning (automated contextual briefs)

Brand Performance & KPIs
📝
31 Questions
⏱️
6,500 words
Transform business reviews and root cause analysis with instant TRx/NBRx explanations, automated market share decomposition, and complete narrative generation. Uncover hidden opportunities worth millions while reducing prep time from 2 weeks to 2 days—eliminating the endless Excel work and manual investigation cycle.
Critical Capabilities:
TRx/NBRx anomaly detection & auto-explanation
Market share decomposition (instant driver analysis)
Root cause analysis (multi-variable, seconds not days)
Business review automation (narrative + visuals)
Competitive intelligence (continuous tracking)

Market Access Performance
📝
30 Questions
⏱️
5,500 words
Track formulary changes, prior auth approval rates, and payer mix shifts with unified access intelligence—identifying exactly where coverage restrictions cost you scripts before they impact revenue. Get automated alerts on formulary movements, access barriers, and abandonment patterns with recommended interventions.
Critical Capabilities:
Formulary impact alerts (position change detection)
Prior authorization tracking (approval rate trends)
Payer mix dynamics (coverage shift analysis)
Abandonment prediction (access barrier identification)
Copay program ROI (effectiveness measurement)

Contracting & Payer Strategy
📝
30 Questions
⏱️
5,500 words
Optimize contract performance with unified tracking of rebate effectiveness, volume commitments, and ROI across all payer agreements. Model negotiation scenarios, measure contract impact in real-time, and identify which agreements deliver value and which underperform—with recommended actions before renewals.
Critical Capabilities:
Performance vs. expectations (continuous tracking)
Rebate effectiveness (automated optimization)
Scenario modeling (what-if negotiations)
Gross-to-net decomposition (contract-level)
Value-based outcomes (automated tracking)

HCP Targeting & Segmentation
📝
30 Questions
⏱️
5,500 words
Identify high-potential prescribers with AI-powered lookalike modeling, calculate physician lifetime value in real-time, and dynamically adjust segmentation as market conditions change. Find opportunities before competitors while optimizing targeting continuously—without manual deciling or static segment updates.
Critical Capabilities:
High-potential identification (AI-powered scoring)
Lookalike modeling (predictive targeting)
Prescriber LTV calculation (real-time updates)
Dynamic micro-segmentation (adaptive)
Acquisition optimization (prescriber journey)
⚡
Two Powerful Approaches to Analytics Transformation
⚡ Two Powerful Approaches to Analytics Transformation
Combine conversational interfaces for instant answers with agentic intelligence that works proactively—solving both immediate needs and long-term efficiency.

Conversational Analytics & AI Foundations
📝
25 Questions
⏱️
4,500 words
The foundation: Ask questions in plain English and get instant answers. Conversational interfaces democratize data access, automated root cause analysis explains why metrics moved, and predictive models forecast future performance. Essential AI capabilities that transform static dashboards into interactive intelligence.
Foundational AI Capabilities:
Conversational analytics (natural language queries)
Automated root cause analysis (driver decomposition)
Predictive modeling (prescription trend forecasting)
Machine learning (segmentation & targeting)
Unified data integration (IQVIA, CRM, claims, digital)

Agentic Analytics: AI Agents That Work 24/7
📝
25 Questions
⏱️
4,500 words
The evolution: AI agents work continuously 24/7—monitoring your business, automatically investigating anomalies, and proactively alerting you to risks and opportunities before you ask. Move from asking questions to receiving answers you didn't know you needed. This is what separates reactive analytics from agentic intelligence.
Agentic Capabilities:
24/7 monitoring (continuous surveillance)
Automatic anomaly investigation (self-initiated RCA)
Proactive risk alerts (before revenue impact)
Self-optimizing workflows (adaptive intelligence)
Automated business narratives (review generation)
Platform & Technology Questions
Understanding Pharma Intelligence and agentic analytics at the platform level
What is agentic analytics for pharmaceutical commercial operations
Agentic analytics represents the evolution from reactive reporting to proactive intelligence. Unlike traditional analytics where users must ask questions and wait for answers, agentic analytics deploys AI agents that work continuously—monitoring your business 24/7, automatically investigating anomalies, and proactively alerting you to risks and opportunities before you ask. In pharmaceutical commercial operations, this means AI agents track hundreds of metrics across brand performance, field execution, market access, and HCP engagement simultaneously. When meaningful changes occur—like a TRx decline, formulary restriction, or prescriber disengagement—agents automatically perform root cause analysis and deliver specific, actionable recommendations with full context.
How does Pharma Intelligence unify data across commercial functions?
Pharma Intelligence automatically integrates data from IQVIA (prescription trends, market share), Symphony (claims data), CRM systems (Veeva, Salesforce for field activity), payer databases (formulary status, prior auth rates), competitive intelligence, and internal systems. The platform creates a unified semantic layer that harmonizes these disparate sources, resolving HCP identities, aligning geographies, and standardizing metrics. This means field teams, brand managers, market access leaders, and contracting teams all work from the same single source of truth. When an AI agent detects a TRx decline, it can instantly correlate field activity, payer changes, competitive moves, and HCP prescribing patterns—insights impossible when data sits in silos.
What's the difference between AI analytics and agentic analytics?
AI analytics provides conversational interfaces and automated insights—you ask "Why did NBRx decline?" and get instant answers with root cause analysis. This is valuable and represents a major improvement over traditional BI. Agentic analytics goes further: AI agents work autonomously without human prompting. They continuously monitor your business, automatically detect meaningful changes, investigate root causes on their own, and proactively send you alerts with recommendations. Think of it as the difference between having a very smart assistant who answers your questions (AI analytics) versus having a team of analysts working 24/7 who investigate issues and bring you insights before you know to ask (agentic analytics). Most organizations need both layers working together.
What ROI can we expect from deploying agentic analytics?
Typical pharmaceutical companies see $10-17M in annual value creation per brand with 6-9 month payback periods and 1,700%+ first-year ROI. Value comes from four areas: analyst time savings (70-85% reduction, ~$645K annually), proactive issue detection (catching formulary changes, prescriber churn, access barriers 2-4 weeks earlier saves $3-4M), AI-identified opportunities (underserved segments, high-potential HCPs, contract optimization worth $5-10M), and improved forecasting accuracy ($2-3M in better resource allocation). Beyond quantifiable ROI, organizations report dramatically improved executive satisfaction, faster business reviews (2 weeks to 2 days), and field teams spending time selling instead of preparing reports. The platform essentially pays for itself within the first quarter through time savings alone.
How do AI agents work across field force, brand, and market access?
AI agents operate across all commercial functions simultaneously, detecting insights that span multiple teams. For example: an agent monitoring market access detects Aetna added step therapy requirements affecting 8,200 covered lives. It automatically investigates the brand impact (estimated -$2.3M TRx), identifies affected territories and HCPs, analyzes which field reps need to adjust messaging, and calculates the patient support program implications. Within minutes, the agent sends coordinated alerts to market access (escalate with payer), brand team (update forecasts), field leadership (prioritize affected HCPs), and patient services (expect abandonment increase). This cross-functional intelligence—impossible with siloed tools—enables coordinated responses that protect revenue.
How long does deployment take and what resources are needed?
Typical deployment takes 6-12 weeks from kickoff to full production. Week 1-3: Data integration (IQVIA, CRM, claims, payer sources). Week 4-6: Semantic layer configuration and pharma-specific metric definitions. Week 7-9: Agent deployment, alert configuration, and user training. Week 10-12: Optimization and rollout. Required resources: Executive sponsor (5% time), 2-3 business analysts (50% time during deployment), IT liaison (25% time for data access), and key business users for UAT. Post-deployment, platform is largely self-operating—AI agents handle monitoring and investigation automatically. Most organizations need only 1-2 FTEs for ongoing administration, far less than traditional BI platforms that require constant analyst support.
How does this compare to traditional pharma analytics platforms?
Traditional platforms (Tableau, Power BI, Qlik) require users to build dashboards, write SQL, and manually investigate every question. Pharma-specific platforms (IQVIA OCE, Veeva CRM Analytics) provide pre-built reports but still require manual analysis. Neither offers AI agents that work autonomously. With agentic analytics, AI agents continuously monitor and investigate automatically—no dashboard building, no SQL, no waiting. Conversational interfaces let anyone ask questions in plain English. Root cause analysis happens instantly, not in 3-5 days. Business reviews generate automatically. Most importantly: you receive insights proactively before issues impact revenue, rather than discovering problems in retrospective reports. Organizations typically keep existing platforms for specific use cases while Pharma Intelligence becomes the primary decision intelligence layer.
How Agentic Analytics Transforms Your Workflow
How Agentic Analytics Transforms Your Workflow
Unified Data Integration
Automatically connect and harmonize data from IQVIA, Symphony, CRM (Veeva, Salesforce), claims databases, competitive intelligence, and internal systems. No more manual data pulls or Excel wrestling.
Ask Questions in Plain English
Conversational analytics lets anyone ask questions like "Why did NBRx decline in the Northeast last month?" and receive instant answers with automated driver analysis. No SQL, no waiting for reports.
Deploy AI Agents
Agentic analytics agents work 24/7—continuously monitoring hundreds of metrics across all dimensions. When meaningful changes occur, agents automatically investigate root causes, quantify business impact, and send prioritized alerts with specific, actionable recommendations. No human prompting required.
Receive Proactive Insights & Recommendations
Get specific, prioritized alerts with context and next steps: "Prior auth denials increased 18% with Aetna in Q3. Estimated TRx impact: -$2.3M. Root cause: New step therapy requirement. Recommend: Escalate to market access team within 48 hours, review formulary status across all major payers." Know what to do, not just what happened.
Jump to Your Specific Challenge
AI agents answer your questions across three levels: foundational understanding, agentic capabilities, and business impact measurement.
🎯
Understanding Challenges & Best Practices
🎯 Understanding Challenges & Best Practices
🤖
AI Agents & Agentic Capabilities
🤖 AI Agents & Agentic Capabilities
💰
Platform Evaluation & Business Impact
💰 Platform Evaluation & Business Impact
Real Results from Deploying Agentic Analytics
How AI agents deliver measurable business impact across pharmaceutical commercial operations
Top 10 Pharma — Oncology Brand
85% reduction in monthly review prep with automated business narratives
AI agents identified $12M opportunity in underserved community oncology
Proactive formulary alerts detected risk 3 weeks earlier, saved $8M
ROI: 2,200% in first year with agentic monitoring
Specialty Pharma — Neurology
Analyst team reduced from 4 FTEs to 2 with agentic automation
15% NBRx improvement through AI-optimized HCP targeting
Agentic anomaly detection prevents $3-5M revenue loss annually
Payback period: 7 months from agent deployment
Mid-Size Pharma — Cardiovascular
AI agents generate weekly reviews in 2 hours vs. 2 days
Root cause analysis: instant vs. 3-5 days of manual investigation
Agents found $18M in hidden payer contract optimization opportunities
Executive satisfaction: 4.2 → 9.1/10 with agentic insights
Calculate Your ROI from Agentic Analytics
See what you could save by deploying AI agents across your commercial operations
Typical ROI from Agentic Analytics Deployment
Value from AI agents: Analyst time savings ($645K), proactive issue detection ($3-4M), AI-identified opportunities ($5-10M), improved forecasting ($2-3M), 24/7 monitoring & investigation (at fraction of human cost)
Breakthrough Ideas, Right at Your Fingertips
Dig into our latest guides, webinars, whitepapers, and best practices that help you leverage data for tangible, scalable results.
.webp)
Agentic AI in Supply Chain: Use Cases, Platforms, and What's Shipping (2026)
Supply chain leaders are moving beyond predictive dashboards and generative AI toward agentic systems that can monitor operations, investigate disruptions, recommend actions, and orchestrate workflows across the enterprise. This guide explores the state of agentic AI in supply chain management in 2026, comparing the leading platforms and highlighting the use cases that are delivering measurable business value today. Learn how organizations are deploying AI agents for demand sensing, inventory optimization, supplier risk monitoring, procurement intelligence, logistics planning, production scheduling, transportation optimization, and exception management.
.webp)
Best FP&A Software in 2026: The Tools That Plan, and the Layer That Explains Why
Modern FP&A teams need more than planning software—they need the ability to explain financial performance, identify the drivers behind change, and act faster on emerging risks and opportunities. This buyer's guide compares the leading FP&A platforms in 2026 across budgeting, forecasting, scenario modeling, financial consolidation, reporting, AI-assisted planning, and enterprise analytics. It also introduces a new evaluation framework: distinguishing the systems that plan from the intelligence layer that explains why.
.webp)
Best Pharma Launch Analytics Platforms in 2026: What Each One Does Best
Launching a new therapy has never been more data-intensive—or more complex. Commercial teams must coordinate brand strategy, field execution, HCP engagement, market access, patient adoption, omnichannel performance, and competitive intelligence while making decisions in near real time. This buyer's guide compares the leading pharma launch analytics platforms in 2026, evaluating what each solution does best across launch planning, forecasting, HCP targeting, territory performance, market access analytics, omnichannel measurement, patient journey insights, and AI-powered commercial intelligence.
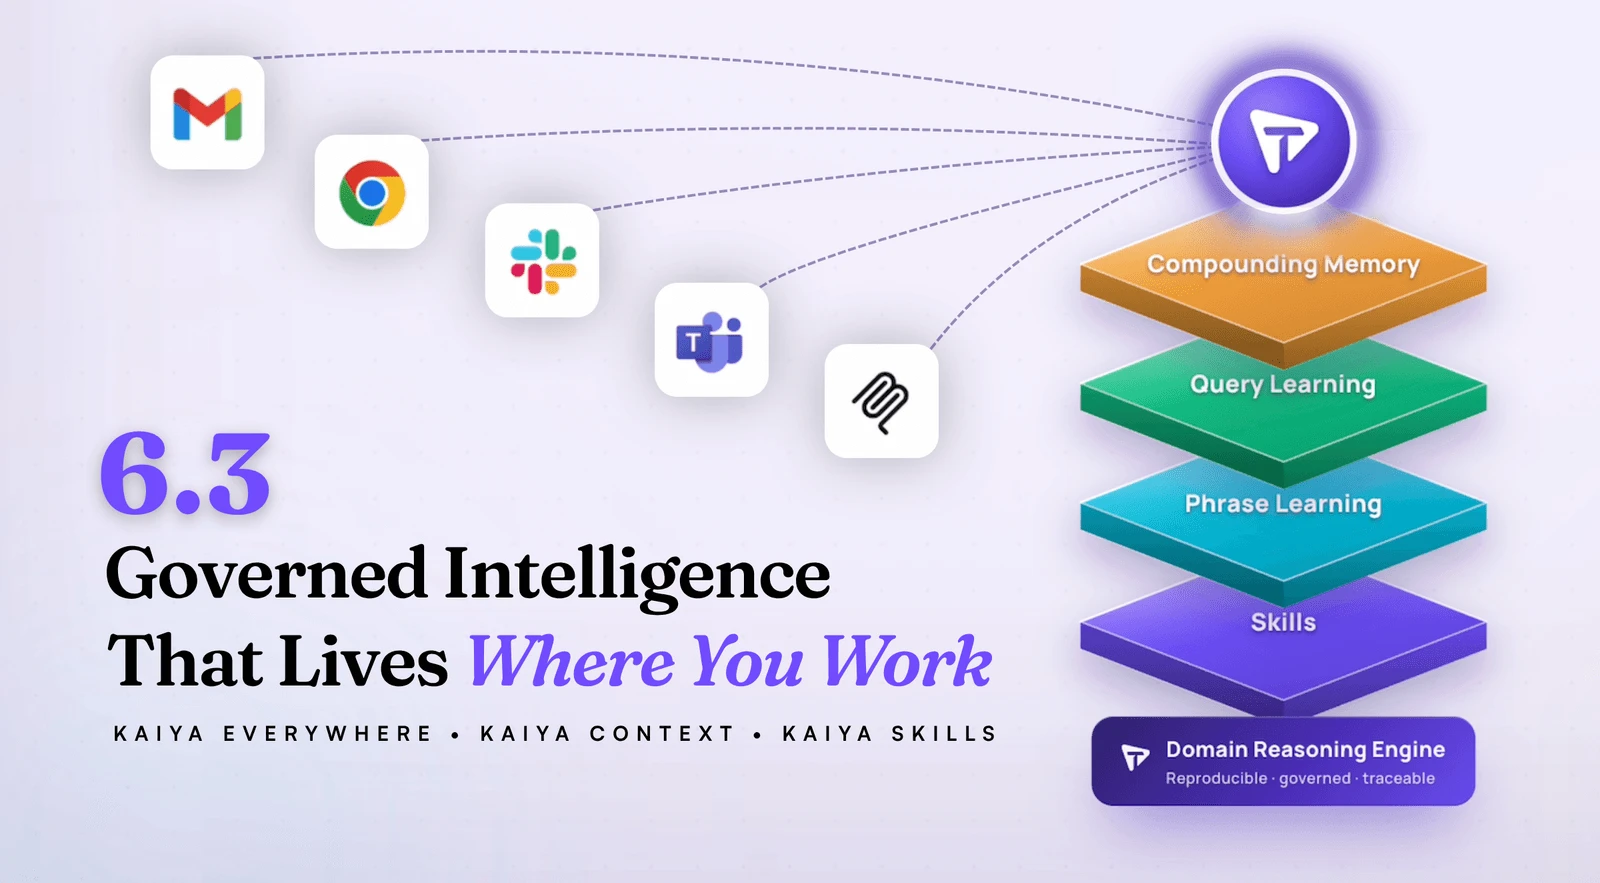
Tellius 6.3: Kaiya Everywhere, Grounded in Your Business
AI answers are only useful when they're grounded in your business and available where decisions actually happen. See how Tellius 6.3 delivers fast, traceable insights across pharma, CPG, RevOps, and FP&A — right in the tools your team already uses.


PMSA Fall Symposium 2025 in Boston
Join Tellius at PMSA Oct 2–3 for two can’t-miss sessions: Regeneron on how they’re scaling GenAI across the pharma brand lifecycle, and a hands-on workshop on AI Agents for sales, HCP targeting, and access wins. Discover how AI-powered analytics drives commercial success.
.webp)
Tellius AI Agents: Driving Real Analysis, Action, + Enterprise Intelligence
Tellius AI Agents transform business intelligence with dedicated AI squads that automate complex analysis workflows without coding. Join our April 17th webinar to discover how these agents can 100x enterprise productivity by turning questions into actionable insights, adapting to your unique business processes, and driving decisions with trustworthy, explainable intelligence.