Deep Insights

Ask one question.
Get deep insights built on your business.

Kaiya plans the multi-step analysis, reasons across your data and your call notes, and returns the finished brief where you already work — every number traceable to source, and the same answer every time you run it.

kaiya · deep insightsInvestigating
Conversation
Thought processAuto BV · Pharma Commercial
01PLANScope the drivers to test: payer, formulary, HCP decile
02SQLPull NBRx by territory & payer, prior 6 periods214 territories · 6 zips flagged
03PYVariance decomposition vs. planaccess effect isolated
04DOCRead Veeva call notes + payer PDFstier-2 drop in 3 zips confirmed
05ANLYRank drivers; test rebound scenario
06SUMCompose brief + next steps
Northeast NBRx — Driver Brief
Root CauseSQL + PythonStructured + Unstructured
Executive summary. The 6% decline is concentrated in three zips where a payer moved Brand X to tier-2 mid-month. Access loss accounts for ~58% of the gap; the rest is a pull-through lag behind two competitors.
SOURCESSnowflakeVeeva CRM notesPayer policy PDFsIQVIA Xponent
−6.0%
NBRx vs. prior mo.
▼ material
3 zips
tier-2 access loss
−58% of gap
+3.1%
reach / frequency
▲ not the cause
AccessPull-throughSamplingSeason
Recommended next steps
Trigger market-access pull-through play in the 3 affected zips
Re-brief field team; prioritize 12 high-decile targets
kaiya · deep insightsInvestigating
Conversation
Thought processAuto BV · Trade Promotion
01PLANFrame the ROI question: channel · promo · SKU
02SQLJoin promo spend to POS lift by event48 events · club channel
03PYIncrementality + cannibalization modelbase erosion detected
04ANLYRank drivers by ROI impact2 overlapping events
05VIZBuild the driver-breakdown chart
06SUMCompose brief + the fix
Southeast Club — Trade ROI Brief
ContributionSQL + PythonStructured + Unstructured
Executive summary. ROI fell from 2.4x to 1.6x. The largest driver is base-price erosion from overlapping events; a mid-quarter de-list of two SKUs compounds it. Depth of discount was not the problem.
SOURCESSnowflakeCircana POSTrade promo systemRetailer scorecards
1.6×
promo ROI
▼ from 2.4×
44%
of gap: base erosion
▼ overlap
2 SKUs
de-listed mid-Q
−distribution
Promo overlap−0.4x
Base erosion−0.3x
De-listed SKUs−0.1x
Promo depth−.05x
Recommended next steps
Space out overlapping events; cap concurrent promotions
Escalate SKU re-listing with the retailer's category lead
kaiya · deep insightsInvestigating
Conversation
Thought processAuto BV · Financial Actuals
01PLANSet up the bridge: price · volume · mix · input cost
02SQLPull actuals vs. forecast by product line9 lines · 3 regions
03PYPrice / Volume / Mix decompositionmix is 120bps of miss
04ANLYClassify controllable vs. non-controllable
05VIZBuild the margin-bridge waterfall
06SUMCompose bridge + next steps
Q3 Gross Margin — Variance Bridge
VarianceSQL + PythonAudit-traceable
Executive summary. Of the 180bps miss, 120bps is unfavorable mix (lower-margin lines over-indexed), 40bps is input-cost inflation, 20bps is price. Volume was a tailwind. The math reconciles to the ledger.
SOURCESNetSuite GLSnowflakePlan file (XLSX)Close notes
−180bps
margin vs. forecast
▼ miss
120bps
unfavorable mix
▼ largest
+30bps
volume tailwind
▲ offset
MarAprMayJunJulAugSep
Gross margin % — dipped 180 bps in Jul, partial recovery since
Recommended next steps
Re-weight the Q4 forecast for the mix shift now, not at close
Flag the two over-indexed lines for pricing review
kaiya · deep insightsInvestigating
Conversation
Thought processAuto BV · Revenue
01PLANScope the NRR slip: segment · product · CSM
02SQLNRR by segment, cohort by start quartermid-market −7pts
03DOCRead Gong transcripts for lost accounts2 recurring objections
04ANLYSplit churn / downsell / expansion; rankdownsell dominates
05VIZBuild the NRR bridge for the brief
06SUMCompose brief + next steps
Mid-Market NRR — Driver Brief
Cohort CompareSQL + PythonStructured + Unstructured
Executive summary. NRR fell 7 points, driven by seat downsell at renewal — not logo churn. Transcripts surface two recurring objections tied to a feature gap. Expansion held; the leak is at renewal.
SOURCESSalesforceGong call notesSnowflakeMarketo
−7pts
NRR, mid-market
▼ slip
61%
of gap: downsell
▼ seats
Flat
logo churn
▲ stable
104%NRR
Downsell · 44% Feature gap · 24% Onboarding · 18% Churn · 14%
Recommended next steps
Route the 18 at-risk accounts to CS ahead of renewal
Feed the two objections to product for roadmap triage
What is Deep Insights?

Deep Insights is Tellius Kaiya’s agentic analysis capability. Ask the “why” in plain language: Kaiya auto-detects the right dataset, queries your structured and unstructured data together, plans the investigation, and writes and runs the SQL and Python. It runs whatever analysis the question needs (decomposition, key-driver, trend, anomaly, etc.) and returns a finished, governed brief with next steps, in a single run.

Kaiya works from your own metrics and business logic and applies the domain intelligence of your industry. It remembers your preferences, carrying your past decisions across turns and datasets, so every follow-up builds on the last.

Trusted by the world’s most innovative teams
The gap

A chat answer stops short of the investigation

The answer arrives fast. The work still doesn't. Ask a chat tool why a number moved and you get a sentence — a summary that stops exactly where the hard part begins.

  • A normal chatbot can't query structured and unstructured data together — your warehouse and your call notes never meet.
  • It hands you the what, never the why — no variance decomposition, no ranked drivers, no proof.
  • It can't run the analysis itself — you get a sentence, not a finished investigation.

So the fast answer becomes a slow week — an analyst stitches the SQL, Python, and PDFs together by hand.

Deep Insights collapses that week into one run.
generic chatbotChat answer
"Why did same-store sales drop in the Southeast?"
"Same-store sales fell about 7% versus last month, likely due to market conditions and competitive pressure."
"I can't see your store data. Can you paste the numbers?"
What usually causes this?Give me a checklist
kaiya · deep insightDeep Insight
"Why did same-store sales drop in the Southeast?"
SQLDecomposed the 7% into traffic, basket size, and out-of-stocks
PYRanked drivers — out-of-stocks at 3 clusters = 41% of the gap
DOCConfirmed against inventory logs and store-manager notes
SUMComposed the brief + recommended the replenishment fix
Why it goes deeper

It digs on its own.
You never spell out the steps.

Kaiya runs price/volume/mix because that’s how your business reads a unit decline. Kaiya knows, without you telling it. Click any step to view the thought process.

Thought Process

Iteration 1

01Planning AgentPlanning: Scope the investigation — pick the metric, baseline, and cuts to test.
Description
Set the objective and decide which dimensions to break the change down by before any query runs.
Plan
Anchor on units sold vs. the prior completed week; queue cuts by channel, category, and region, then variance, ranking, anomaly, and visualization checks.
Assumptions
Weeks run Monday–Sunday; “last completed week” excludes the current partial week.
Output
investigation_plan · 6 steps queued
02SQL AgentSQL: Pull total units and YoY by channel; isolate where the decline concentrates.
Description
Break unit volume out by channel to find where the drop is concentrated.
Instructions
Sum units and YoY% by channel, filtered to the Southeast and the last completed week; join fact_sales to dim_store on store_id; order by YoY% ascending.
Output columns (lowercase)
channel, total_units, units_yoy_pct
Output
channel_units
Rows Generated
4
Columns
channel, total_units, units_yoy_pct
SQL Script
SELECT channel,
       SUM(units) AS total_units,
       ROUND(100.0*(SUM(units)-SUM(units_ly))/SUM(units_ly),1) AS units_yoy_pct
FROM fact_sales JOIN dim_store USING (store_id)
WHERE region = 'Southeast' AND week_start >= DATE_TRUNC('week',CURRENT_DATE)-7
GROUP BY channel ORDER BY units_yoy_pct ASC;
03Python AgentPython: Decompose the change into price, volume, and mix.
Description
Decompose the unit and revenue change into price, volume, and mix effects per channel.
Output
bridge
Summary
DataFrame — 4 rows × 4 columns
Rows Generated
4
Columns
channel, price_eff, volume_eff, mix_eff
Python Script
import pandas as pd
df = channel_units.copy()
# price / volume / mix effects
df['price_eff']  = (df['price'] - df['price_ly']) * df['units_ly']
df['volume_eff'] = (df['units'] - df['units_ly']) * df['price_ly']
df['mix_eff']    = df['rev'] - df['rev_ly'] - df['price_eff'] - df['volume_eff']
bridge = df.sort_values('mix_eff')
04Analysis AgentAnalysis: Rank drivers by contribution and flag anomalies vs. the seasonal baseline.
Description
Rank every driver by its contribution to the total change and flag statistically unusual movements.
Instructions
Score each driver’s share of the gap; compare each channel to its 3-year seasonal baseline and flag deviations beyond 2σ.
Output
ranked_drivers
Rows Generated
4
Columns
driver, contribution_pct, z_score, is_anomaly
05Visualization AgentVisualization: Build the channel and category charts for the brief.
Description
Generate the charts that back the narrative so the brief is self-explanatory.
Render
A channel YoY bar chart and a price / volume / mix waterfall; the largest driver and the anomaly are annotated inline.
Output
brief_charts · 2 charts (PNG + spec)
06Summary AgentSummary: Compose the executive brief with the ranked drivers and next steps.
Prompt
“Write an executive sales-pacing brief: headline the total change, rank the drivers, call out the anomaly, and recommend 2–3 next steps.”
Render description
Executive brief with an embedded channel chart and the driver waterfall, exported on the corporate template.
Assumptions
Uses the ranked drivers from Step 4 and the charts from Step 5; every figure reconciles back to the Step 2 query.
Total execution log — 3 tool calls
Tool call 1 · compose_brief
arguments: { drivers: ranked_drivers, charts: brief_charts }
response: brief.md · 168 words
Tool call 2 · render_charts
arguments: { specs: [channel_yoy, pvm_waterfall] }
response: 2 images embedded
Tool call 3 · export_deliverable
arguments: { formats: [pdf, pptx, docx], template: corporate }
response: 3 files ready
Outputexecutive_briefRowsColumns
Nine ways to ask why

Deepest insights across sources.

Kaiya keeps digging — choosing the right analysis, often several at once, end to end — until it reaches the real why, not the first plausible answer.

Trend drivers
What's moving a KPI over time — and which segments are pulling it.
You ask
What's driving the change in units sold over the last 12 weeks?
Variance analysis
A full bridge from plan to actual, decomposed by price, volume, and mix.
You ask
Bridge Q3 net revenue from plan to actual by price, volume, and mix.
Key drivers
The ranked factors behind an outcome, weighted by real contribution.
You ask
What are the top factors behind the margin decline in the West?
Root cause analysis
Not what changed — why, traced through the data to the source.
You ask
Why did same-store sales drop in the Southeast last month?
Cohort comparison
Group against group — segments, regions, vintages — to isolate what differs.
You ask
How do stores opened in 2024 compare to 2023 on basket size?
Anomaly detection
The spike or drop you didn't think to look for — surfaced and explained.
You ask
Flag any unusual spikes or drops in daily transactions this quarter.
What-if & forecast
Project forward with intervals, then test the scenario before you commit.
You ask
Forecast Q4 units and show the impact if we cut promo depth by 10%.
Contribution analysis
How much each dimension adds to a total — down to the store, zip, or SKU.
You ask
Which categories contributed most to the total sales change?
Segmentation
Cluster the population into groups that behave alike — and name what unites them.
You ask
Group customers into segments by purchase behavior and name each.
Built for the way you work

You just ask. It handles the rest.

Ask a complex question — Kaiya clarifies only if it needs to, then runs the whole investigation. Below is the anatomy of a real Deep Insight conversation.

When Kaiya's unsure, it asks — pick or type your answer. It's saved as memory and compounds over time, so Kaiya remembers your preferences.

Drop in policies, PDFs, or contracts to deepen a question — attach files inline.

Take it with you — download the whole conversation for your team in PDF, PPT, or DOC format.

Spin up a live, interactive app from this investigation — running against your fresh data.

Schedule the investigation itself to re-run at your frequency. It re-runs the analysis — not a static report.

No need to pick a dataset — Kaiya auto-detects the relevant Business View and unstructured data (PDFs and docs).

Talk to it — full voice mode for a multi-turn conversation, plus dictation when you'd rather not type.

Follow up — Kaiya carries context across turns and across Business Views. Multi-turn & flexible.

kaiya · deep insights
Bridge our Q3 net-revenue miss versus plan and tell me which regions to prioritize fixing first.
Quick check before I dig in — several regions reforecast mid-quarter. Which baseline should I bridge against?
Original annual plan Latest reforecast Prior-year actuals
On it — here's the bridge vs. your latest reforecast, with the drivers ranked →
Now show me the same for the club channel only.
Business View auto-switched → Trade Promotion
Kept your Southeast filter and carried the context forward — re-running for the club channel.
What drives Net Revenue change — Q3 vs. latest reforecast
▼ −2.1M−12.4%
Region is West+156.8%
Promotion=Benefit+102.3%
Order pri.=Med+72.3%
Review score=90−5.9%
Shipping=200−37.8%
Region West and the “Benefit to Society” promotion drive most of the swing; elevated shipping cost is the largest drag. Prioritize the West first — it's the single biggest lever.
What to do next
Create App Subscribe to existing schedule Create new schedule for Mission
Auto detect BV
How it works

Under the hood: our intelligent
architecture, in action

Watch a question travel the stack — data streams up, the engine reasons stage by stage, and a finished answer lands at the top.

Get to the Root Cause
Identify Trend Changes
Dig into Differences
Uncover Anomalies
AI Insights Layer
AI Insights Engine Reasoning in motion
Intent classification
Pre-processing
Knowledge Layer / RAG
Insight Ranking
NLG
Knowledge Layer
Data Modeling
Semantic Layer
Business Logic
Structured data
Unstructured data
Enterprise-gradeSame question, same answer, every time — fully governed.LineageAccess controlAudit trail
FAQ

Questions on Deep Insights

A chatbot returns a sentence. A Deep Insight runs a multi-step, multi-turn agentic investigation — blending SQL and Python, reading your documents, decomposing the drivers, validating against source, and returning a finished, ranked answer with recommended next steps.

No. Ask in plain language. Kaiya auto-detects the Business View your question needs, writes the SQL and Python itself, and reads across structured and unstructured data — no schema to learn, no dataset to choose.

Each step of the Deep Insight investigation is carried out by a dedicated agent — a planning agent, a SQL agent, a Python agent, an analysis agent, a visualization agent, a summary agent, etc. Kaiya plans the run, invokes each agent, checks the result, and re-plans until the question is actually answered.

Yes. A deterministic engine handles the math while the LLM handles the language, so the same question returns the same answer every time. And nothing is hidden: the thought process lays out every step — its objective, what it did, the exact SQL and Python scripts it ran, and the rows each returned — so you can trace any number straight back to the query that produced it. The whole run is governed with lineage, access control, and a full audit trail.

Yes. Kaiya reads unstructured data — policies, call transcripts, notes, PDFs, contracts, etc. — and reasons over them in the same investigation as your warehouse and syndicated data.

Turn it into a live, interactive app on fresh data; schedule the investigation to re-run at your frequency (it re-runs the analysis, not a static report); or download the whole conversation in PDF, PPT, or DOC format, built on your template.

Decision AI for the enterprise

Stop reading answers.
Start getting investigations.

See what a single question turns into when Kaiya runs it deep — on your data, in your business.

DISCOVER MORE

Breakthrough Ideas, Right at Your Fingertips

Dig into our latest guides, webinars, whitepapers, and best practices that help you leverage data for tangible, scalable results.

ThoughtSpot alternative: migrating from ThoughtSpot to Tellius (2026 guide)

Many organizations that adopted search-driven analytics are now looking for platforms that go beyond answering questions to proactively investigating business performance and delivering finished analytical work. This migration guide explains how to move from ThoughtSpot to Tellius while preserving trusted metrics, semantic definitions, dashboards, and user adoption. It compares the two platforms across conversational analytics, automated insight discovery, root cause analysis, AI agents, governance, semantic context, and enterprise scalability.

Branding

Agentic AI in Supply Chain: Use Cases, Platforms, and What's Shipping (2026)

Supply chain leaders are moving beyond predictive dashboards and generative AI toward agentic systems that can monitor operations, investigate disruptions, recommend actions, and orchestrate workflows across the enterprise. This guide explores the state of agentic AI in supply chain management in 2026, comparing the leading platforms and highlighting the use cases that are delivering measurable business value today. Learn how organizations are deploying AI agents for demand sensing, inventory optimization, supplier risk monitoring, procurement intelligence, logistics planning, production scheduling, transportation optimization, and exception management.

Branding

Best FP&A Software in 2026: The Tools That Plan, and the Layer That Explains Why

Modern FP&A teams need more than planning software—they need the ability to explain financial performance, identify the drivers behind change, and act faster on emerging risks and opportunities. This buyer's guide compares the leading FP&A platforms in 2026 across budgeting, forecasting, scenario modeling, financial consolidation, reporting, AI-assisted planning, and enterprise analytics. It also introduces a new evaluation framework: distinguishing the systems that plan from the intelligence layer that explains why.

Branding

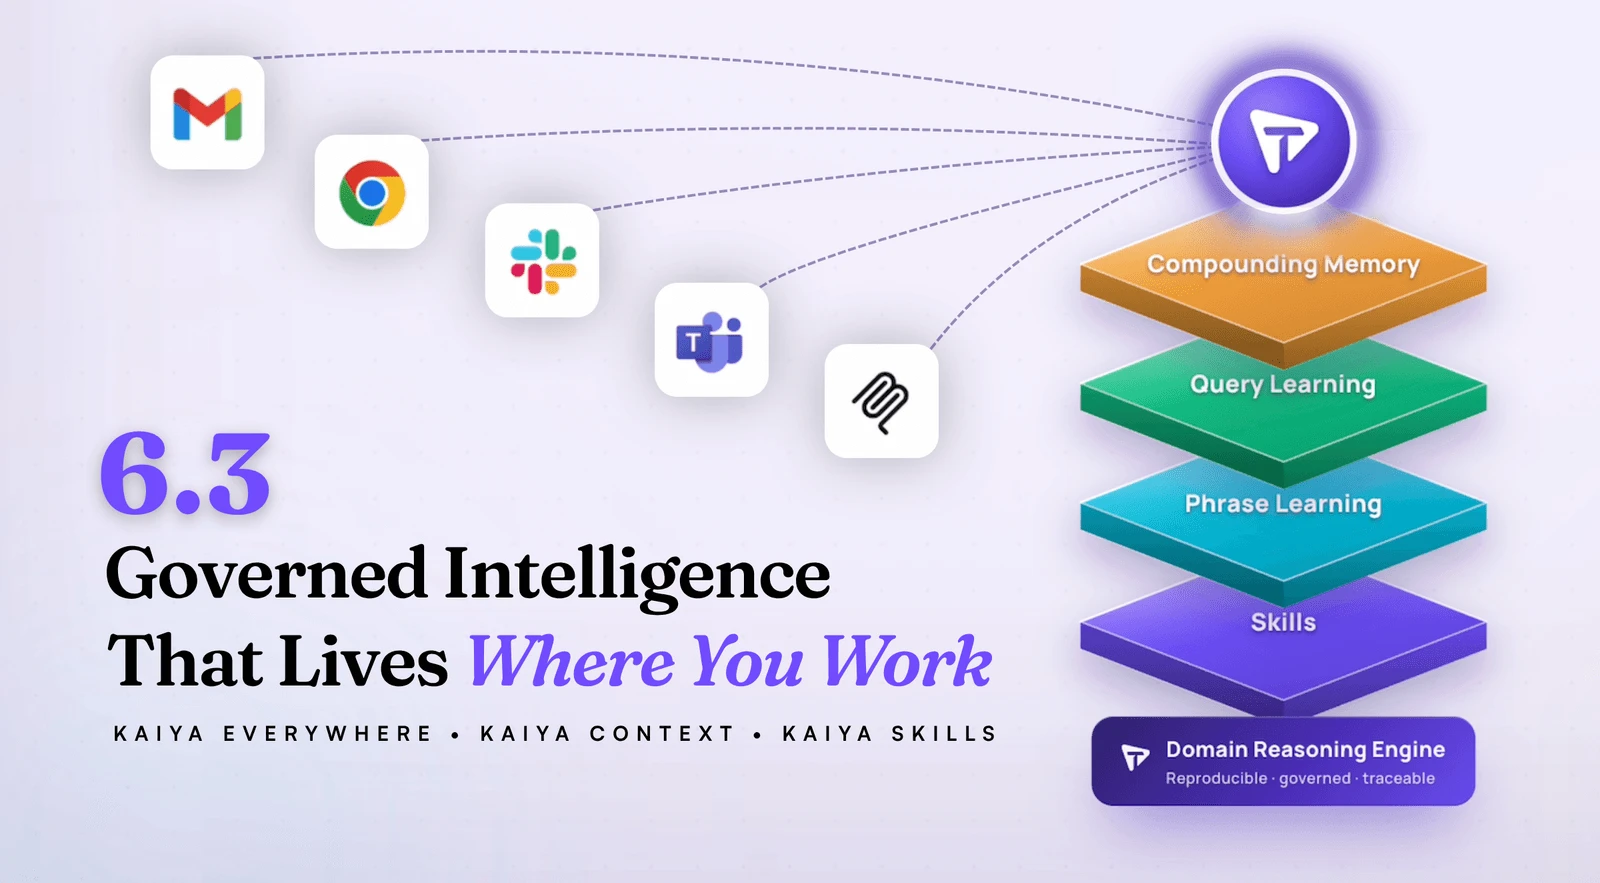
Tellius 6.3: Kaiya Everywhere, Grounded in Your Business

AI answers are only useful when they're grounded in your business and available where decisions actually happen. See how Tellius 6.3 delivers fast, traceable insights across pharma, CPG, RevOps, and FP&A — right in the tools your team already uses.

Branding

Tellius 6.1: AI Agents Across Every Metric, Document, and Conversation

Branding

Tellius 6.0: Agent Mode for Deep Analytics + Insights

Branding

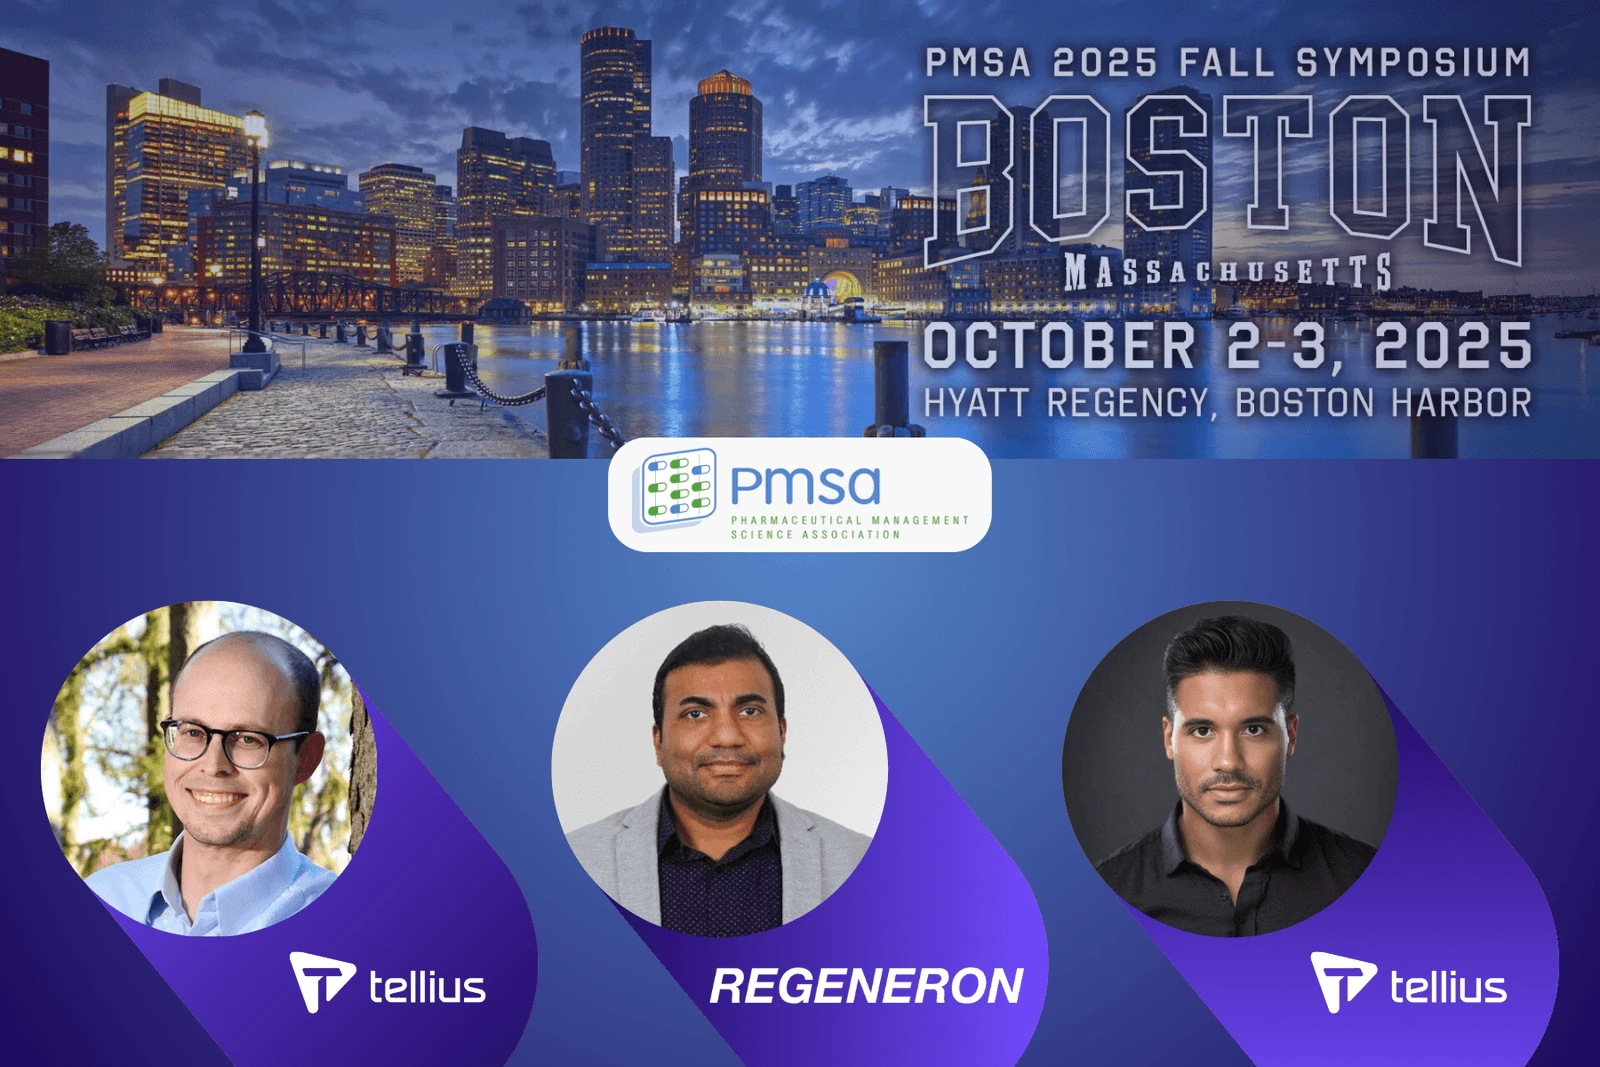
PMSA Fall Symposium 2025 in Boston

Join Tellius at PMSA Oct 2–3 for two can’t-miss sessions: Regeneron on how they’re scaling GenAI across the pharma brand lifecycle, and a hands-on workshop on AI Agents for sales, HCP targeting, and access wins. Discover how AI-powered analytics drives commercial success.

Branding

Tellius AI Agents: Driving Real Analysis, Action, + Enterprise Intelligence

Tellius AI Agents transform business intelligence with dedicated AI squads that automate complex analysis workflows without coding. Join our April 17th webinar to discover how these agents can 100x enterprise productivity by turning questions into actionable insights, adapting to your unique business processes, and driving decisions with trustworthy, explainable intelligence.

Branding
View All Resources