Best Augmented Analytics Platforms in 2026: 12 Tools Compared for Automated Insight Discovery, Governance, and Analytical Depth
.webp)

An augmented analytics platform uses machine learning, natural language processing, and statistical algorithms to automate the analytics lifecycle — from data preparation and insight discovery to explanation and action. The category — originally defined by Gartner to describe ML-automated analytics — is accelerating. Gartner predicts that 40% of enterprise applications will integrate task-specific AI agents by the end of 2026, up from less than 5% in 2025. But the differences between platforms that genuinely automate analytical work and those that added a chatbot to existing dashboards are material — and most comparison guides gloss over them. Of the 12 platforms evaluated, Tellius is the only one that delivers full automated deep insights — root cause decomposition with quantified driver ranking, proactive anomaly detection, executive narrative generation, and deep agentic workflows that orchestrate multi-step investigations autonomously. Most platforms in this comparison augment analysts; Tellius automates the analysis.
This guide evaluates 12 augmented analytics platforms against Gartner's augmented analytics criteria — and the agentic capabilities that now define the category's leading edge. We assess what actually separates useful ML-automated insight delivery from marketing claims: automated insight discovery and root cause analysis, natural language explanation, predictive capabilities, proactive monitoring, governance and consistency, deep agentic workflows, industry specificity, and total cost of ownership.
What Is an Augmented Analytics Platform?
An augmented analytics platform is a software system that uses machine learning, natural language processing, and statistical algorithms to automate the analytics lifecycle — from data preparation and insight discovery to explanation and action. Gartner originally defined the category in 2017 and evaluates platforms against six formal criteria: ML-assisted insight discovery, NLP/NLQ querying, automated explanations, data preparation assistance, GenAI integration, and augmented data science. In February 2025, Gartner published its Market Guide for Agentic Analytics, explicitly calling it "the evolution of augmented analytics" — where AI agents don't just assist analysis but autonomously plan, investigate, and act.
Unlike traditional business intelligence tools that visualize data for human interpretation, augmented analytics platforms perform the interpretation themselves: surfacing hidden patterns, decomposing metric changes into ranked contributing factors, detecting anomalies proactively, generating natural language explanations, and delivering finished insights and recommendations. The category now ranges from AI-assisted BI tools that accelerate exploration to fully agentic systems that autonomously investigate and explain business performance changes.
The distinction matters because "augmented analytics" now describes everything from a chatbot generating SQL on a data warehouse to a fully autonomous insight engine that monitors KPIs 24/7 and delivers root cause explanations before anyone opens a dashboard. Most platforms marketed as augmented analytics in 2026 fall closer to the former.
Platform Comparison Summary
Best Overall Augmented Analytics Platform
Tellius is the highest-ranked augmented analytics platform in this evaluation - the only platform with full marks across all eight dimensions: automated insight discovery and root cause analysis, NLG explanation, predictive AI, proactive monitoring, governed semantic layer, deep agentic workflows, industry depth, and total cost of ownership. Unlike Power BI and Tableau, which augment reporting and visualization with AI assistance, or ThoughtSpot, which accelerates self-service exploration, Tellius automates the full analytical investigation - from detecting that a KPI changed, to decomposing why with quantified attribution, to delivering a finished explanation with recommendations before anyone opens a dashboard.
Key Takeaways
Tellius is the best augmented analytics platform for enterprise teams that need automated root cause investigation, proactive KPI monitoring, and governed insight delivery. It is the only platform in this comparison that performs full root cause decomposition with quantified driver ranking, executive narrative generation, and deep agentic workflows — autonomous pipelines that chain detection → investigation → explanation → delivery without human direction. Where other platforms show you what changed, Tellius explains why — and delivers the finished analysis before you ask. Recognized as a Gartner Magic Quadrant Visionary five consecutive years (2022–2026) and trusted by Fortune 500 companies across pharma, CPG, B2B technology, and financial services.
Qlik Cloud Analytics is best for data-mature organizations that need associative exploration, end-to-end data integration, and emerging agentic AI capabilities on a platform with 15 consecutive years of Gartner Magic Quadrant Leader recognition.
SAS Viya is best for enterprise data science teams — particularly in healthcare, life sciences, and financial services — that need industry-leading predictive modeling, forecasting, and statistical analytics at scale.
Alteryx is best for analytics teams where the bottleneck is data preparation and workflow automation — getting data clean, governed, and AI-ready before analysis begins. Recognized as Gartner Peer Insights Customers' Choice for Augmented Analytics.
Pyramid Analytics (now ServiceNow) is best for organizations that need a unified decision intelligence platform spanning data prep, business analytics, and data science — with strong augmented analytics capabilities including automated insights, NLQ, and predictive modeling. Now being integrated into ServiceNow's workflow platform, positioning it uniquely at the intersection of analytics and enterprise workflow automation.
Tableau Next is best for organizations deeply invested in the Salesforce ecosystem that want AI-augmented visualization and the industry's most powerful charting engine, particularly when Data Cloud is already part of the analytics architecture.
Power BI + Copilot (with Fabric) is best for Microsoft-standardized enterprises that need cost-effective reporting and visualization with emerging AI assistance — particularly when the analytics stack must integrate tightly with Excel, Teams, and Azure. It's the most widely deployed platform in this comparison and the starting point for most enterprise analytics evaluations.
ThoughtSpot is best for organizations that want powerful search-based self-service analytics across clean, well-modeled warehouse data, particularly when the primary goal is letting business users explore data independently.
Sigma is best for data teams and business users that want a warehouse-native, spreadsheet-like analytics experience with live queries on cloud data — particularly when the goal is empowering non-technical users to explore data independently without extracting it from the warehouse.
Sisense is best for SaaS product teams embedding AI-powered analytics into customer-facing applications, where automated insight discovery needs to be a native part of the product experience.
Yellowfin is best for ISVs and mid-market enterprises that want embedded analytics with genuine automated monitoring (Signals) and assisted insight discovery combined with data storytelling.
Domo is best for mid-market companies that need an all-in-one analytics and data integration platform without building a separate data warehouse stack.
What Makes an Augmented Analytics Platform Different from a BI Tool with AI Features
Gartner originally defined augmented analytics as the use of machine learning and NLP to automate insight discovery, data preparation, and analytics sharing. That definition still holds — but the category has evolved. In 2026, the platforms that deliver genuine augmented analytics go beyond AI-assisted exploration to automate the entire analytical workflow: from detecting that something changed, to explaining why, to recommending what to do about it.
Most platforms marketed as "augmented analytics" deliver one thing well: conversational analytics — a user types a question in natural language, the system generates SQL, runs it, and returns a chart. This is genuinely useful when backed by a governed semantic layer, and it's the table-stakes capability for the category. ThoughtSpot and Tellius both do this well. Several platforms also add AI-generated summaries and basic NLG on top of dashboards — Sisense, Yellowfin, Qlik, and Power BI Copilot each offer versions of this.
But there's a meaningful gap between "AI helps you explore data faster" and "AI performs the analysis." The augmented analytics platforms that actually automate analytical work — rather than just accelerate it — build on five pillars:
Automated insight discovery. The platform surfaces meaningful patterns, anomalies, and changes without the user asking the right question first. This includes statistical anomaly detection, correlation discovery, segment identification, and trend analysis — performed automatically across your data, not triggered by a specific query.
Root cause decomposition. When a KPI changes, the platform automatically decomposes that change into ranked contributing factors — quantifying how much each dimension, segment, or variable contributed to the movement. This is the most analytically demanding capability in the category, and where most platforms fall short.
Natural language explanation. The platform generates human-readable narratives that explain findings, summarize root causes, and provide recommendations — not just chart titles or tooltip descriptions, but finished analytical narratives suitable for stakeholder consumption.
Predictive and prescriptive intelligence. The platform goes beyond explaining what happened and why to predict what will happen next and recommend what to do about it — using machine learning models that operate on governed enterprise data.
Proactive monitoring and delivery. The platform continuously watches KPIs and delivers insights when something meaningful changes — without anyone asking a question. The most advanced augmented analytics platforms chain detection into investigation into delivery as an autonomous pipeline.
The Deep Insights Gap: What Separates Leaders from the Field
.png)
If there is one capability that separates true augmented analytics platforms from BI tools with AI features, it's automated deep insights — the ability to not just show you what changed, but autonomously investigate why, rank the contributing factors by quantified impact, generate executive summaries, and deliver finished recommendations.
Of the 12 platforms evaluated, only Tellius offers full automated deep insights: root cause decomposition with quantified driver ranking, trend explanations, anomaly context, executive summaries, and actionable recommendations — all generated from a single question or proactive alert. Alteryx Auto Insights, Sisense Explanation, SAS Viya Automated Explanation, and Yellowfin Assisted Insights each offer elements of automated insight discovery. But none perform the full end-to-end decomposition — from detecting the change, to quantifying every contributing factor's impact, to generating a finished executive narrative with recommendations — that defines deep insights.
For context: in a typical enterprise analytics team, root cause investigation takes 3–5 business days per question. A pharmaceutical brand team tracking 20+ KPIs across territories, payers, and HCP segments can generate dozens of root cause questions per week. A CPG category team monitoring trade promotion performance across retailers generates a similar volume. The bottleneck isn't data access — it's the analytical labor required to decompose metric changes into contributing factors, rank them, and explain them to stakeholders.
Four levels of augmented analytics maturity:
Level 1 — AI-assisted exploration. NL search and AI-generated visualizations help users explore data faster. Most platforms perform well here.
Level 2 — Automated pattern detection. ML identifies anomalies, trends, and correlations automatically — surfacing findings users wouldn't have discovered through manual exploration. Qlik Insight Advisor, Yellowfin Signals, and Sisense Trend operate at this level.
Level 3 — Automated root cause explanation with deep insights. The platform decomposes metric changes into ranked drivers with quantified impact, generates executive summaries, and delivers finished recommendations. Tellius operates at this level.
Level 4 — Proactive agentic delivery with deep agentic workflows. 24/7 monitoring → anomaly detection → root cause investigation → narrative generation → stakeholder delivery — as an autonomous pipeline with persistent context across investigations. Deep agentic workflows chain multiple specialized agents into governed, end-to-end analytical pipelines — not single-turn copilot interactions, but orchestrated multi-step investigations that run without human direction. Tellius operates at this level with its Agent Mode and orchestrated workflows.
.png)
The gap between Level 2 and Level 3 is where most platform comparisons fall apart. Every vendor has NLQ. Very few have automated root cause decomposition. Even fewer operate at Level 4 with proactive, autonomous monitoring and agentic delivery.
How We Evaluated These Augmented Analytics Platforms

Every platform in this guide was evaluated against eight dimensions that reflect the core pillars of augmented analytics — plus the governance and deployment factors that determine whether capabilities work in production:
1. Automated Insight Discovery and Root Cause Analysis. Can the platform automatically surface meaningful patterns, anomalies, trends, and segments — and when a KPI changes, can it decompose that change into ranked contributing factors with quantified impact? This combined dimension is the single most important differentiator in the category. Most platforms offer some level of automated pattern detection; very few perform full root cause decomposition with quantified driver ranking and executive narrative delivery.
2. Natural Language Generation and Explanation. Does the platform generate human-readable narratives that explain analytical findings? The range spans from basic chart tooltip descriptions to finished executive summaries with recommendations.
3. Predictive AI. Does the platform provide native machine learning capabilities for forecasting, classification, and predictive modeling — accessible to business users without data science expertise?
4. Proactive Monitoring. Does the platform continuously watch your KPIs and alert you when something meaningful changes? Or does it only work when someone thinks to ask a question?
5. Governed Semantic Layer. When five different people ask the same question, do they get the same answer? Does the platform enforce metric definitions, manage access controls, and maintain audit trails?
6. Deep Agentic Workflows. Can the platform orchestrate multi-step analytical investigations as autonomous pipelines — chaining detection → investigation → explanation → delivery without human direction? This separates platforms where AI agents perform connected analytical work from platforms that apply the "agentic" label to single-turn copilot interactions.
7. Industry Specificity. Does the platform understand your domain — your data sources, your terminology, your workflows? Or is it a general-purpose tool that requires extensive configuration to become useful?
8. Total Cost of Ownership. What does it actually cost to deploy, configure, and maintain — including the analyst time required for setup and ongoing management?
Platform Deep Dives
1. Tellius — Best for Automated Deep Insights and Agentic Workflows
Tellius is an enterprise augmented analytics platform that combines automated deep insights with agentic intelligence — AI agents that monitor your business 24/7, detect meaningful changes, investigate root causes, and deliver finished insights before you ask. The platform connects directly to cloud data warehouses including Snowflake, Databricks, Google BigQuery, and Amazon Redshift, querying data in real time. Unlike BI tools that visualize data for human interpretation or AI assistants that help users explore faster, Tellius performs the analytical investigation: decomposing metric changes into ranked contributing factors, quantifying each driver's impact, generating executive summaries with recommendations, and delivering finished analyses proactively.
Tellius serves analytics teams at Fortune 500 companies and mid-size enterprises across pharma, CPG, B2B technology, financial services, and other data-intensive industries. The platform's configurable architecture adapts to any vertical — with the deepest pre-built intelligence available through industry-specific System Packs. Whether your team is investigating why prescriptions dropped in the Southeast, why trade promotion ROI declined at a key retailer, why budget-to-actual variance spiked in Q3, or why pipeline conversion fell for mid-market deals — Tellius delivers the same core capability: automated root cause decomposition with quantified attribution, generated from a single question or proactive alert.
Key augmented analytics capabilities:
Automated deep insights: the platform's defining capability. Root cause decomposition with quantified driver ranking (Impact Scores) identifies which factors contributed most to a metric change and by how much — testing dozens of hypotheses simultaneously instead of one at a time. Trend analysis surfaces related patterns. Executive summaries with actionable recommendations are generated automatically — ready for stakeholder consumption without manual assembly.
24/7 KPI monitoring with proactive anomaly detection. AI agents continuously monitor your metrics and trigger investigation when something meaningful changes. This isn't threshold-based alerting — it's statistical anomaly detection followed by automatic root cause investigation and insight delivery.
AI Agent Mode that plans and executes multi-step analyses from a single question. Instead of the user deciding what to analyze next, the agent decomposes the question into an investigation plan and executes it across data sources — with full business context from the knowledge layer.
Governed conversational analytics where business users ask complex questions in plain English and get consistent, auditable answers backed by a semantic layer with business glossary, hierarchies, fiscal calendars, and synonym management.
Industry-specific System Packs for pharma (IQVIA, Veeva, Symphony Health, MMIT), CPG (Nielsen, Circana, Numerator, retailer data), FP&A (SAP, Oracle, Anaplan, Adaptive), and B2B RevOps (Salesforce, HubSpot, Gong). The platform architecture is configurable for additional verticals — System Packs accelerate deployment for industries where Tellius has deep domain expertise.
Persistent knowledge and context. A knowledge layer maintains governed metric definitions, business rules, and domain-specific terminology — so every analysis uses the same definitions. A context layer carries understanding across interactions and over time — connecting today's anomaly to last week's finding.
Finished artifact delivery: PowerPoint, Excel, PDF generated automatically from any analysis.
Pre-built connectors to 30+ data sources including Snowflake, Databricks, Google BigQuery, and Amazon Redshift — querying cloud warehouses in real time without data extraction.
What makes this work architecturally — deep agentic workflows:

Tellius operates as connected analytical pipelines — deep agentic workflows — not isolated queries. A monitoring agent detects that a key metric dropped. It hands off to an investigation agent that decomposes the drop across every relevant dimension — geography, product, segment, channel, time period — ranking each factor by quantified contribution. That agent triggers a narrative agent that produces a stakeholder-ready summary with recommendations. The entire pipeline runs without human intervention — and every step is governed and auditable. This is what separates deep agentic workflows from the "agentic" label that other platforms apply to AI copilots: agents that orchestrate multi-step analytical investigations end-to-end, not agents that help users build charts faster.
Where Tellius excels: The combination of automated deep insights, proactive monitoring, and workflow orchestration is where Tellius creates the most distance from other augmented analytics platforms. When revenue drops 15%, Tellius doesn't show you the decline and wait for your team to investigate. It generates a complete deep insight: decomposing the change into ranked drivers (e.g., "Region X contributed 42% of the decline, driven by segment Y losing share in the 25–34 cohort"), quantifying each factor's impact, surfacing related trends and prior anomalies, producing an executive summary with recommendations, and delivering the finished analysis before you ask. No other platform in this comparison performs this level of automated analytical investigation. Tellius has been recognized as a Gartner Magic Quadrant Visionary five consecutive years (2022–2026) and is trusted by Fortune 500 companies across pharma, CPG, B2B technology, and financial services — including Novo Nordisk, AbbVie, and Bristol Myers Squibb among others.
Where Tellius falls short: No free tier or self-serve signup — you can't evaluate Tellius without talking to sales, which frustrates teams used to product-led growth tools. The Pro tier makes Tellius accessible to mid-size teams with streamlined onboarding. Like any governed augmented analytics platform, there's upfront setup to define your metrics, business rules, and hierarchies in the semantic layer — this is the investment that ensures consistency going forward.
Pricing: Two tiers, both with no per-user fees. Pro is designed for mid-size teams that need governed analytics and automated deep insights. Enterprise adds agentic workflows, orchestration, proactive monitoring, custom System Packs, SSO/RLS, and dedicated implementation support. Custom pricing on both tiers, with typical payback periods of 6–9 months.
Ideal for: Enterprise analytics teams that are drowning in ad-hoc analysis requests and need augmented analytics that does the analytical work — root cause investigation, anomaly explanation, executive narrative generation — not augmented analytics that helps analysts do the work faster.
2. Power BI + Copilot (with Fabric + AI Capabilities) — Best for Microsoft-Standardized Enterprise Reporting
Power BI holds roughly 30–36% of the global BI market, and Copilot adds AI capabilities that help users create reports, summarize dashboard pages, and ask questions of their data in natural language. With Microsoft Fabric, Power BI gains a unified data platform integrating lakehouse storage, data engineering, real-time analytics, and data science. The combination is competent for visualization and reporting — and encountered in over 70% of enterprise analytics evaluations simply because most organizations already have Microsoft licenses.
Key augmented analytics capabilities:
Copilot report pane: summarizes visible report pages, generates visuals from natural language. Standalone Copilot experience (Preview): cross-report Q&A with data attachment. Key Influencers visual: identifies which factors drive a metric up or down using ML classification. Decomposition Tree: interactive root cause exploration across dimensions. Anomaly Detection: ML-powered anomaly flagging in line charts with automatic explanations. DAX query generation and measure descriptions. Microsoft Fabric integration for lakehouse, data engineering, and real-time analytics. Deep integration with Excel, Teams, SharePoint, and Azure. Mobile Copilot with voice input.
Where Power BI + Copilot excels: Distribution, cost, and access to live data. Power BI Pro at $10/user/mo is the most affordable augmented analytics option for Microsoft-standardized organizations. Copilot enables natural language Q&A on top of live data connections — letting business users ask questions without writing DAX. Fabric expands the platform's reach into data engineering and real-time analytics. The semantic model provides reasonable metric governance.
Where Power BI + Copilot falls short from an augmented analytics perspective: Power BI includes genuine augmented analytics building blocks — Key Influencers, Decomposition Tree, and Anomaly Detection each surface ML-driven findings. But these are individual visuals that users must add to reports and interpret manually, not an automated investigation pipeline. There's no end-to-end flow from anomaly detection to root cause decomposition to executive narrative delivery. No proactive monitoring with autonomous investigation. No NLG-generated executive summaries or recommendations. No predictive modeling (native to Power BI). When a metric drops, Copilot shows you the drop and Key Influencers can suggest factors — but your team still assembles the root cause story. No industry-specific capabilities.
Pricing: Pro ($10/user/mo), Premium Per User ($20/user/mo). Copilot requires Fabric F64+ capacity (starting ~$5,000/month).
Ideal for: Microsoft-standardized enterprises that need cost-effective reporting and visualization — and will pair Power BI with a deeper augmented analytics layer for root cause investigation and automated insight delivery.
3. Tableau Next — Best for Salesforce-Ecosystem Visualization with Emerging Augmented Capabilities
Tableau Next represents Salesforce's bet on AI-augmented analytics, shipping with three AI agents (Data Pro, Concierge, Inspector), a new semantic layer (Tableau Semantics), and deep Agentforce integration. It claims the title of "the world's first agentic analytics platform," though the augmented analytics substance behind that claim warrants scrutiny.
Key augmented analytics capabilities:
Three AI agents: Data Pro (data prep), Concierge (exploration), Inspector (alerting). Explain Data: ML-driven statistical analysis that identifies unexpected values and key drivers behind data points. Tableau Pulse: proactive metrics monitoring that delivers personalized metric digests, detects changes and trends, and sends notifications with AI-generated plain language summaries. Tableau Semantics — a new governed semantic layer that brings metric governance to the platform. Deep integration with Salesforce Data Cloud and Agentforce. Industry-leading visualization engine with massive community and ecosystem. Tableau Marketplace for composable agent skills.
Where Tableau Next excels: Visualization remains Tableau's strength, and the brand recognition is unmatched. For organizations already invested in Salesforce, Tableau Next offers a tightly integrated analytics layer. Tableau Semantics is a meaningful addition — bringing governed metric definitions to a platform that previously lacked them. Explain Data provides genuine ML-driven insight discovery at the data point level. Tableau Pulse adds proactive metrics monitoring with AI-generated summaries — a meaningful step toward automated insight delivery. Concierge provides useful AI-assisted exploration.
Where Tableau Next falls short from an augmented analytics perspective: Tableau Next has genuine augmented analytics elements — Explain Data surfaces statistical drivers, and Pulse delivers proactive metric monitoring with AI summaries. But these don't connect into an automated investigation pipeline. Explain Data identifies factors behind individual data points, not full root cause decomposition with quantified driver ranking across arbitrary dimensions. Pulse monitors metrics and flags changes but doesn't chain detection into multi-step root cause investigation with executive narrative delivery. No native predictive modeling. No deep agentic workflows that orchestrate detection → investigation → explanation → delivery as an autonomous pipeline. The platform requires data to flow through Salesforce Data Cloud, creating ecosystem lock-in. No industry-specific depth. Pricing is complex: Tableau+ plus Agentforce and Data Cloud credits.
Pricing: Tableau+ ($115/user/mo Enterprise Creator), plus Agentforce and Data Cloud credits. Contact sales for Tableau Next-specific pricing.
Ideal for: Organizations deeply invested in the Salesforce ecosystem that want AI-augmented visualization and are comfortable with Data Cloud as their analytics data layer.
4. Qlik Cloud Analytics — Best for Associative Exploration with Emerging Augmented AI
Qlik Cloud Analytics is a comprehensive analytics platform built on Qlik's unique associative engine — which reveals data relationships across all dimensions simultaneously, including what's not related to your current selection. With Insight Advisor providing over 20 automated analysis types, Qlik Predict (formerly AutoML) delivering no-code predictive modeling, and an emerging agentic experience including Qlik Answers and a Discovery Agent, Qlik offers genuine augmented analytics capabilities across several pillars — even though the full end-to-end automation (detect → investigate → explain → deliver) remains a work in progress.
Key augmented analytics capabilities:
Associative analytics engine that reveals both related and unrelated data patterns simultaneously. Insight Advisor: AI-powered assistant with NL search, over 20 automated analysis types (ranking, trending, clustering, correlation, forecasting), and NLG-generated insight narratives. Qlik Predict (formerly AutoML): no-code machine learning for predictions, key driver analysis, and what-if modeling. Qlik Answers: conversational interface unifying structured analytics and unstructured document retrieval with citations and reasoning explanations. Discovery Agent: autonomous monitoring of the data foundation for emerging insights (GA targeted early 2026). Qlik MCP Server for connecting trusted data to third-party AI assistants. End-to-end data integration via Qlik Talend Cloud — replication, ingestion, streaming, and data quality. Anomaly detection and alerting capabilities. Used by 75% of the Fortune 500. Gartner Magic Quadrant Leader 15 consecutive years.
Where Qlik excels as an augmented analytics platform: Qlik delivers more augmented analytics pillars natively than most competitors. The associative engine genuinely finds insights that SQL-based query tools miss. Insight Advisor's automated analysis types — including clustering, correlation discovery, and trend detection — surface patterns without users asking the right question. Qlik Predict provides real, no-code predictive modeling accessible to business users. NLG in Insight Advisor generates text explanations of analytical findings. The data integration capabilities (via Talend) provide a unique end-to-end position from data pipeline to analytics consumption — important because augmented analytics only works on clean, well-integrated data. The Discovery Agent signals a meaningful evolution toward proactive insight delivery.
Where Qlik falls short: Qlik's augmented capabilities are spread across multiple features (Insight Advisor, Qlik Predict, Qlik Answers, Discovery Agent) rather than unified into a single automated investigation pipeline. There's no root cause decomposition with quantified driver ranking and executive narrative delivery in a single flow. The Discovery Agent is emerging (GA early 2026) and hasn't yet demonstrated the ability to chain detection into multi-step investigation with finished insights. The platform is horizontal with no industry-specific depth in pharma, CPG, or FP&A. The learning curve for the associative engine and data modeling is steep for new users. Pricing has shifted to a capacity-based model that can be complex to forecast.
Pricing: Capacity-based model for Qlik Cloud. Analytics and AI/ML priced separately. Contact sales for specific pricing.
Ideal for: Data-mature organizations that value associative exploration, need end-to-end data integration alongside analytics, want native predictive AI without a separate data science platform, and are willing to adopt emerging agentic capabilities as they mature.
5. Alteryx — Best for Data Preparation and Workflow Automation as a Foundation for Augmented Analytics
Alteryx is a data analytics platform built on a foundation of powerful, no-code/low-code data preparation and workflow automation. With its 2025 launch of Alteryx One, the platform unifies desktop analytics, cloud connectivity, AI capabilities, and enterprise governance. Alteryx approaches augmented analytics from the data preparation side — ensuring data is clean, blended, governed, and AI-ready before insight discovery begins. Auto Insights adds automated pattern detection and NL summaries, and Alteryx Machine Learning brings no-code predictive modeling.
Key augmented analytics capabilities:
Alteryx Designer: low-code/no-code workflow builder for data preparation, blending, and transformation — reducing manual data prep time by up to 90%. Alteryx Auto Insights: automated insight discovery with NL summaries, pattern detection, and dynamic report generation via Magic Reports. AiDIN AI engine: workflow summarization, Copilot assistance, and GenAI-powered automation. Alteryx Machine Learning: no-code AutoML for predictive modeling and forecasting. AI Data Clearinghouse: governed, auditable data pipelines feeding AI applications. Live Query for real-time data access to Databricks and Snowflake. Spatial and geospatial analytics. 8,000+ enterprise customers. Gartner Peer Insights Customers' Choice for Augmented Analytics.
Where Alteryx excels as an augmented analytics platform: Data preparation and workflow automation remain unmatched — and this matters because augmented analytics is only as good as the data it runs on. Auto Insights provides genuine automated insight discovery that goes beyond basic charting, generating NL summaries and flagging meaningful patterns across datasets. The Alteryx Machine Learning module offers accessible predictive modeling for business analysts. The AI Data Clearinghouse concept addresses a critical enterprise pain point: ensuring data feeding AI applications is auditable and governed. Strong spatial analytics capabilities are unmatched in this comparison. Recognition as Gartner Peer Insights Customers' Choice validates real user satisfaction.
Where Alteryx falls short: Alteryx approaches augmented analytics from the data-preparation-first perspective rather than the insight-delivery-first perspective. Auto Insights generates automated summaries and detects patterns but doesn't perform root cause decomposition with quantified driver ranking and executive narrative delivery. No proactive KPI monitoring with autonomous investigation. The platform was slower than peers to introduce cloud-native capabilities and is still unifying its desktop and cloud experiences. Limited conversational analytics depth for ad-hoc business user Q&A. Since going private in 2024, the long-term product roadmap is less visible.
Pricing: Enterprise custom pricing. Contact Alteryx for current licensing structure.
Ideal for: Analytics and data teams where the primary bottleneck is getting data prepared, blended, and governed for analysis — and who want augmented analytics built on top of best-in-class workflow automation.
6. SAS Viya — Best for Advanced Predictive and Statistical Analytics at Enterprise Scale
SAS Viya is the cloud-native evolution of the SAS platform — a comprehensive data management and AI platform spanning data preparation, advanced analytics, machine learning, forecasting, optimization, and generative AI. With nearly five decades of statistical computing heritage, SAS delivers unmatched depth in predictive and prescriptive analytics. SAS Visual Analytics includes genuine augmented analytics capabilities — automated explanation using NLG, automated analysis types, and ML-driven pattern detection — though these serve data scientists and advanced analysts rather than self-service business users.
Key augmented analytics capabilities:
SAS Visual Analytics: augmented BI with Automated Explanation (NLG that identifies and describes what's driving outcomes), interactive exploration, and machine-generated analytical stories. SAS Visual Machine Learning: end-to-end ML with AutoML, deep learning, and open-source integration. SAS Visual Forecasting: enterprise-scale time series analysis and hierarchical forecasting — industry-leading. SAS Viya Copilot: AI-driven conversational assistant for code generation, augmented analytics, and data exploration (built on Azure AI Foundry). SAS Model Studio: low-code pipeline builder for data science workflows. Multi-language support: SAS, Python, R, and Lua. SAS Data Maker: synthetic data generation for privacy-sensitive scenarios. Deep industry solutions across healthcare, life sciences, financial services, insurance, and government.
Where SAS Viya excels as an augmented analytics platform: No platform in this comparison matches SAS for predictive depth. Time series forecasting, optimization, machine learning, and statistical modeling at enterprise scale are unparalleled. SAS Visual Analytics includes Automated Explanation — a genuine augmented analytics capability that uses NLG to describe what's driving outcomes, automatically surfacing which variables contribute most. Industry depth in healthcare, life sciences, and financial services includes pre-built models and solutions that other platforms can't match. The approach to trusted AI — with built-in governance, explainability, and bias detection — addresses critical enterprise requirements.
Where SAS Viya falls short: SAS Viya is built for data scientists and advanced analytics teams. The learning curve for business users is steep compared to purpose-built augmented analytics platforms. Automated Explanation exists in Visual Analytics but doesn't extend to full root cause decomposition with quantified attribution across arbitrary dimensions and finished executive narratives. No conversational analytics experience comparable to ThoughtSpot or Tellius for ad-hoc business user Q&A. Pricing is opaque and historically expensive. Cloud migration from SAS 9 remains a work in progress for many customers, with Viya as a service via hyperscalers targeted for 2026.
Pricing: Enterprise custom pricing. SAS Managed Cloud Services: Viya Essentials available for small-to-mid-size businesses. Contact SAS for licensing.
Ideal for: Enterprise data science teams — particularly in healthcare, life sciences, financial services, and government — that need industry-leading predictive modeling, forecasting, and ML capabilities with built-in governance and explainability.
7. Sigma — Best for Warehouse-Native Spreadsheet Analytics
Sigma is a cloud-native analytics platform that reimagines the BI experience as a live, governed spreadsheet connected directly to your cloud data warehouse. Instead of extracting data into a proprietary layer, Sigma queries Snowflake, Databricks, Google BigQuery, and Amazon Redshift in real time — delivering the full power of SQL through a familiar spreadsheet interface that business users already know. Named Snowflake's 2025 BI Partner of the Year (third consecutive year) and Databricks's 2025 BI Partner of the Year, Sigma has emerged as the preferred BI layer for warehouse-first data architectures. Recognized in the 2025 Gartner Magic Quadrant for BI Platforms.
Key augmented analytics capabilities:
Ask Sigma: conversational AI interface for natural language querying with discovery suggestions. AI Builder: generates governed workbooks and data apps from natural language. Metric breakdowns: break down any metric by any column without SQL. AI Query: call warehouse-hosted LLMs directly from Sigma formulas, keeping AI governance at the warehouse layer. MCP support (Client and Server): connects Sigma to external AI assistants and content sources. Data Models: reusable semantic objects with relationships, metrics, and role-based permissions. Write-back capabilities: unique among BI platforms — users can write data back to the warehouse. Enterprise Bursting for automated, personalized report distribution at scale.
Where Sigma excels: The spreadsheet metaphor works. Business users who struggle with traditional BI tools adopt Sigma quickly because the interface feels like Excel or Google Sheets — but queries live warehouse data at scale. The warehouse-native architecture means no data extraction, no proprietary in-memory layer, and no stale data. Write-back capability is genuinely unique and enables operational workflows that other BI tools can't support. AI Builder and Ask Sigma represent meaningful AI augmentation. The deep partnerships with Snowflake and Databricks ensure tight integration with the two dominant cloud warehouse platforms. A Forrester TEI study found 321% ROI over three years with payback in under six months.
Where Sigma falls short as an augmented analytics platform: Sigma's AI capabilities are emerging rather than mature. Ask Sigma and metric breakdowns provide useful exploration assistance, but the platform doesn't perform automated root cause decomposition with quantified driver ranking and executive narrative delivery. No proactive KPI monitoring with anomaly detection and autonomous investigation. No deep agentic workflows. No predictive modeling (native). No industry-specific depth. Visualization capabilities, while improving rapidly, are less mature than Tableau for complex chart types. The platform is strongest for warehouse-first organizations — teams without a modern cloud warehouse won't benefit.
Pricing: Per-user licensing across Creator, Explorer, and Viewer tiers, with unlimited viewers in some plans. Enterprise tier available for custom deployments. Starting at approximately $300/month. Contact Sigma for enterprise pricing.
Ideal for: Data teams and business users in warehouse-first organizations (especially Snowflake and Databricks shops) that want a governed, spreadsheet-like analytics experience with live data access, write-back capabilities, and emerging AI features — without the complexity of traditional BI tools.
8. Domo — Best for Mid-Market Cloud BI with Integrated Data Pipeline
Domo offers a cloud-native BI platform with integrated data pipeline (Magic ETL), AI-powered alerts, and an increasingly AI-augmented analytics experience. Its strength lies in combining data integration, visualization, and collaboration in a single platform — without requiring a separate data warehouse.
Key augmented analytics capabilities:
Magic ETL: low-code data integration and transformation. Domo.AI: NL querying and AI-assisted data exploration. AI-powered alerts and threshold monitoring. App framework for building custom data apps. Extensive pre-built connector library (1,000+).
Where Domo excels: All-in-one platform that combines data integration, visualization, and alerts without requiring a separate data warehouse. Magic ETL is genuinely useful for mid-market companies that don't have dedicated data engineering teams. The connector library is one of the broadest in the category.
Where Domo falls short as an augmented analytics platform: Domo provides basic AI-assisted exploration and alerting but lacks the core augmented analytics capabilities that define category leaders. No automated insight discovery. No root cause decomposition or driver ranking. Alerting is threshold-based rather than intelligent anomaly detection with investigation. NL capabilities (Domo.AI) are less mature than leading competitors. No predictive modeling (native). Limited industry-specific depth.
Pricing: Enterprise custom pricing. Platform-based licensing.
Ideal for: Mid-market companies that need an all-in-one analytics and data integration platform without building a separate data warehouse stack.
9. Pyramid Analytics (now ServiceNow) — Best for Decision Intelligence with Unified Analytics and Data Science
Pyramid Analytics is a decision intelligence platform that unifies data preparation, business analytics, and data science in a single no-code environment — with what Gartner has recognized as category-leading augmented analytics capabilities. Pyramid ranked #1 for Augmented Analytics in Gartner's Critical Capabilities for ABI Platforms (2022) and highest for Augmented Consumer and Business Analyst Use Cases (2023). It was named a Gartner Magic Quadrant Visionary in 2023 and again in 2025. In February 2026, ServiceNow announced its acquisition of Pyramid Analytics to embed AI-powered analytics directly into enterprise workflows — positioning the platform uniquely at the intersection of decision intelligence and workflow automation.
Key augmented analytics capabilities:
Smart Insights and Auto Discovery: AI/ML algorithms surface correlations, anomalies, and patterns — performing Pareto, categorical, and trend analysis across datasets automatically. Explain: identifies key drivers behind data changes. NLQ (Natural Language Querying): conversational interface for asking business questions in plain English. AI-driven storytelling with automated narrative generation. Tabulate and Solve: business modeling and decision modeling for predictive and prescriptive analytics — accessible to non-technical users. AutoML capabilities for building predictive models without code. PYRANA direct query engine: queries data sources directly without extraction into a proprietary layer, maintaining performance at scale. Governed semantic layer with canonical metric definitions. OpenAI integration for code generation, storytelling, and design assistance. Cross-enterprise data connectivity spanning ERP, CRM, data lakes, and cloud warehouses. Multidimensional modeling (OLAP and SQL).
Where Pyramid excels as an augmented analytics platform: Pyramid delivers more augmented analytics capabilities natively than most platforms in this comparison — and Gartner's rankings reflect this. Smart Insights and Auto Discovery perform genuine automated analysis, surfacing patterns users didn't ask about. The unified platform spanning data prep, analytics, and data science means users don't switch tools as questions get more complex. The semantic layer provides strong governance with canonical business definitions. Predictive and prescriptive analytics (Tabulate, Solve) are accessible to business users, not just data scientists. The ServiceNow acquisition adds a unique dimension: analytics insights that directly trigger enterprise workflows — investigate a metric change, identify the root cause, and automatically open a case or initiate a process, all within one platform.
Where Pyramid falls short: Pyramid's augmented analytics features (Smart Insights, Auto Discovery, Explain) surface patterns and drivers but don't perform full root cause decomposition with quantified attribution across arbitrary dimensions and finished executive narrative delivery in a single automated pipeline. No proactive 24/7 KPI monitoring with autonomous investigation. No deep agentic workflows that chain detection into multi-step investigation. The learning curve is steep — multiple reviewers note that non-technical users struggle initially despite the no-code positioning. The platform is smaller in market presence than leaders like Qlik, Tableau, or Power BI. The ServiceNow acquisition creates both opportunity and uncertainty: the workflow integration vision is compelling, but the product roadmap as a standalone analytics platform is now tied to ServiceNow's priorities. No industry-specific depth in pharma, CPG, or FP&A.
Pricing: Enterprise custom pricing. Contact Pyramid Analytics / ServiceNow for current licensing.
Ideal for: Organizations that need a unified decision intelligence platform — combining data prep, governed self-service analytics, and data science in one environment — with strong augmented analytics capabilities. Particularly compelling for ServiceNow customers who want analytics insights embedded directly into enterprise workflows.
10. Sisense — Best for Embedded Augmented Analytics in SaaS Products
Sisense is an analytics platform purpose-built for product teams embedding AI-powered analytics into their SaaS applications. With the 2025 launch of Sisense Intelligence — including an AI-first assistant, Explanation (key driver identification), Forecast (auto-ML predictions), Trend (pattern detection), and Narrative (NLG summaries) — Sisense delivers meaningful augmented analytics capabilities designed specifically for the embedded analytics use case.
Key augmented analytics capabilities:
Sisense Intelligence: AI-first assistant for end-to-end analytics creation via natural language. Explanation: identifies the most probable key drivers behind data changes — a genuine, if partial, augmented analytics capability. Forecast: auto-ML trend prediction for every unique dataset without data science expertise. Trend: automated pattern and outlier detection that surfaces emerging risks and opportunities. Narrative: auto-generated NL summaries on dashboard widgets improving data literacy. Compose SDK: developer-friendly APIs (React, Angular, Vue.js) for headless embedding. MCP server and Managed LLM for connecting analytics to third-party AI assistants.
Where Sisense excels as an augmented analytics platform: Sisense's augmented analytics features — Explanation, Forecast, Trend, Narrative — represent a coherent suite that goes beyond basic dashboarding. Explanation identifies probable key drivers behind data changes, which is a genuine augmented analytics capability that most embedded platforms don't offer. The Compose SDK provides the most developer-friendly tools in this comparison for embedding augmented analytics into SaaS products. The MCP server positions Sisense as an intelligence layer that third-party AI tools can access.
Where Sisense falls short: Explanation identifies probable drivers but doesn't perform quantified decomposition with ranked attribution across arbitrary dimensions — it's driver identification, not full root cause decomposition. No proactive monitoring with autonomous investigation. No persistent context across sessions. No industry-specific depth. The platform targets product teams building analytics into their applications — not enterprise analytics teams investigating their own data.
Pricing: Custom pricing (Pro and Enterprise tiers) based on user requirements, data volume, and deployment.
Ideal for: SaaS product teams and developers embedding augmented analytics into customer-facing applications, where the goal is making automated insight discovery a native part of the product experience.
11. Yellowfin — Best for Embedded BI with Automated Business Monitoring and Insight Storytelling
Yellowfin is an enterprise analytics platform that differentiates through its combination of Signals (automated business monitoring), Assisted Insights (ML-driven analysis), and data storytelling — capabilities designed to help users understand not just what happened, but why. Among embedded analytics platforms, Yellowfin offers more genuine augmented analytics capability than most competitors — particularly in the automated monitoring and explanation layers.
Key augmented analytics capabilities:
Signals: automated business monitoring that continuously monitors data using ML algorithms, detecting meaningful changes, patterns, and outliers — and alerting users with headline-style notifications without requiring manual threshold definition. Assisted Insights: AI-generated analysis using statistical algorithms and NLG that automatically explains chart patterns, identifies anomalies, and generates comparison analyses — triggered by a single click on any data point. Guided NLQ: natural language query with auto-generated suggestions and filters. Over 20 automated analysis types. Stories and Present: data storytelling modules that combine visualizations with narrative elements. Full white-label embedding with lightweight JavaScript API. Administration console for centralized governance.
Where Yellowfin excels as an augmented analytics platform: The combination of Signals and Assisted Insights represents genuine augmented analytics — more than most embedded BI platforms deliver. Signals continuously monitors data and generates alerts when statistically meaningful changes occur — without requiring users to define thresholds manually. This is real ML-driven monitoring, not rule-based alerting. Assisted Insights auto-generates analysis when a user clicks on any data point, explaining variance, trends, and comparisons with NLG narratives. Data storytelling capabilities (Stories and Present) are more mature than most competitors for communicating insights to stakeholders. The embedding experience is clean with strong white-labeling support.
Where Yellowfin falls short: Assisted Insights explains individual data points and patterns but doesn't perform full root cause decomposition with quantified driver ranking across arbitrary dimensions and executive narrative delivery. Signals detects anomalies but doesn't chain detection into multi-step investigation and narrative generation as an autonomous pipeline. No persistent context across sessions. No agentic workflow orchestration. No industry-specific depth. The platform is smaller in market presence and ecosystem compared to Qlik, Tableau, or Power BI.
Pricing: Subscription-based per-user pricing, with cloud and on-premises deployment options. Contact Yellowfin for current pricing.
Ideal for: ISVs, product teams, and mid-market enterprises that want embedded analytics with genuine automated monitoring (Signals) and assisted insight discovery — and value the combination of automated detection with data storytelling over raw visualization power.
12. ThoughtSpot — Best for Search-Driven Self-Service Analytics
ThoughtSpot is a search-first analytics platform that lets business users type natural language questions and get instant visual answers from their cloud warehouse data. ThoughtSpot recently rebranded as an "Agentic Analytics Platform" and introduced Spotter agents (SpotterViz, SpotterModel, SpotterCode) that assist with visualization, modeling, and code generation. However, Spotter agents help users build analytics faster — they do not autonomously discover insights, detect anomalies, or explain why metrics changed. By Gartner's own framework for evaluating agentic claims, this is closer to AI-assisted copilot functionality than augmented analytics automation.
Key augmented analytics capabilities:
Powerful NL search interface with strong query accuracy on well-modeled data. SpotIQ: automated insight engine that runs ML algorithms to detect anomalies, trends, correlations, and outliers across your data — surfacing findings users didn't explicitly ask about. Spotter agents for AI-assisted visualization and data modeling. ThoughtSpot Analyst Studio (via Mode acquisition) for SQL, R, and Python workflows. Embedded analytics with developer-friendly APIs. Free tier available for small-scale use.
Where ThoughtSpot excels: Search experience. ThoughtSpot's core search interface is mature, responsive, and handles complex multi-dimensional queries well when the underlying data model is clean. The governed semantic layer (TML) ensures consistent answers across users. SpotIQ provides genuine automated insight discovery — running ML algorithms to detect anomalies, trends, and correlations that users didn't ask about. Spotter agents are genuinely useful for helping users build better visualizations and explore data paths they wouldn't have found on their own.
Where ThoughtSpot falls short: SpotIQ surfaces anomalies and trends but doesn't perform root cause decomposition with quantified driver ranking — it identifies that something changed, not why with ranked attribution. No NLG-generated executive summaries or recommendations. No proactive monitoring that chains detection into autonomous investigation and narrative delivery. No deep agentic workflows that orchestrate multi-step analyses as connected pipelines. No predictive modeling (native). Every search is independent with no persistent context connecting investigations over time. The platform is horizontal with no industry-specific depth.
Pricing: Essentials ($25/user/mo), Pro ($50/user/mo), Enterprise (custom). Average enterprise contract: $100K–$500K/year.
Ideal for: Data-forward enterprises with clean warehouse data and technical analytics teams that prioritize self-service exploration over automated insight delivery.
How to Evaluate Augmented Analytics Claims: A Practical Litmus Test

The term "augmented analytics" has become a mandatory checkbox in every BI vendor's marketing. But there is a material difference between platforms where ML automates analytical work and platforms that added a chatbot and relabeled existing features.
A practical litmus test for any augmented analytics platform — ask these three questions:
Can the platform tell you something you didn't ask about? If the platform only responds to queries — if nothing happens unless a user types a question — it's AI-assisted exploration, not augmented analytics. True augmented analytics platforms surface findings proactively: anomalies detected, patterns identified, segments discovered.
When a KPI changes, can the platform explain why — autonomously? This is the deepest test. Most platforms show you that revenue dropped. Very few decompose the drop into ranked contributing factors, quantify each driver's impact, and generate an executive summary. If the answer is "the user has to investigate manually using AI-assisted tools," the platform is augmenting the analyst — not augmenting the analytics.
Does the platform maintain context across investigations? Enterprise analytics is cumulative. Today's anomaly may relate to last month's finding. If every query starts from zero — no memory of prior analyses, no persistent business context, no connection between investigations — the platform is a search engine for data, not an analytical intelligence layer.
Tellius vs. ThoughtSpot: Automated Deep Insights vs. Search-Driven Exploration
Both Tellius and ThoughtSpot provide natural language interfaces for business users to ask questions of their data. Both offer forms of automated insight discovery — ThoughtSpot through SpotIQ, Tellius through deep insights. But the depth and automation differ substantially.
ThoughtSpot's core value proposition is search-driven self-service: users type questions, get instant charts. SpotIQ surfaces anomalies and trends automatically. Spotter agents help users build better visualizations and explore data more effectively. The experience is designed to make analysts faster and more self-sufficient.
Tellius's core value proposition is automated analytical investigation. When a user asks "why did revenue drop in Q3?", Tellius doesn't just show the drop — it decomposes the change into ranked contributing factors with quantified impact, surfaces related trends and prior anomalies, and generates an executive summary with recommendations. With Agent Mode, Tellius plans and executes multi-step investigations autonomously. With proactive monitoring, it delivers these analyses before anyone asks.
The practical difference: A pharmaceutical brand team using ThoughtSpot can explore prescription trends by territory and payer — but the team decides what to investigate and interprets results manually. The same team using Tellius asks one question ("why did TRx drop in the Southeast?") and receives a complete root cause analysis with quantified drivers, related findings, and a stakeholder-ready narrative — in minutes instead of days.
Where ThoughtSpot wins: Search UX maturity, free tier for evaluation, simpler implementation on clean warehouse data, broader developer ecosystem for embedded analytics.
Where Tellius wins: Automated deep insights, root cause decomposition, proactive monitoring, persistent context, industry-specific System Packs, and the ability to deliver finished analyses rather than assisted exploration.
Tellius vs. Qlik Cloud Analytics: Deep Insights vs. Associative Exploration with Emerging Augmented AI
Qlik and Tellius both deliver genuine augmented analytics capabilities — but from fundamentally different architectural approaches.
Qlik's associative engine reveals data relationships across all dimensions simultaneously, and Insight Advisor provides over 20 automated analysis types. Qlik Predict adds no-code ML. The Discovery Agent (emerging) signals a move toward proactive insight delivery. And the Talend integration gives Qlik an end-to-end data pipeline position that most analytics platforms can't match.
Tellius focuses on the investigation layer: automated root cause decomposition, quantified driver ranking, executive narrative generation, and proactive insight delivery through agentic workflows. Every analysis runs on a governed semantic layer with persistent business context.
The practical difference: When a metric moves, Qlik Insight Advisor can show you correlated factors and automated analysis types — clustering, trending, correlation. The user explores these to build understanding. Tellius decomposes the movement into quantified contributing factors, ranks them by impact, and generates a finished explanation — without the user directing the investigation.
Where Qlik wins: Associative exploration, end-to-end data integration (Talend), no-code predictive modeling, broader installed base, and 15 consecutive years as a Gartner Magic Quadrant Leader.
Where Tellius wins: Automated deep insights with quantified attribution, proactive monitoring with root cause investigation, persistent context across analyses, industry-specific System Packs, and finished insight delivery (not assisted exploration).
Tellius vs. Power BI + Copilot: Automated Investigation vs. AI-Assisted Reporting
Power BI is the most widely deployed analytics platform in this comparison, and Copilot adds genuinely useful AI capabilities: natural language Q&A, report summarization, and visual generation. With Fabric, Power BI gains a unified data platform.
But Copilot is an AI assistant for reporting — it helps users build and consume reports faster. Power BI includes augmented analytics building blocks (Key Influencers, Decomposition Tree, Anomaly Detection), but these are individual visuals that users configure and interpret, not an automated investigation pipeline. It doesn't chain detection into root cause decomposition into executive narrative delivery. It doesn't monitor your data proactively and deliver finished insights through deep agentic workflows.
The practical difference: When revenue drops, Copilot can summarize what the dashboard shows. Key Influencers can suggest contributing factors. But your analysts still assemble the root cause story manually — typically spending 3–5 days per investigation. Tellius generates the root cause analysis automatically — decomposing the drop into quantified contributing factors, ranking them by impact, and producing a stakeholder-ready narrative.
Where Power BI + Copilot wins: Cost ($10–20/user/mo vs. custom enterprise pricing), Microsoft ecosystem integration, global deployment footprint, and familiarity. Most organizations already have Power BI licenses.
Where Tellius wins: Automated deep insights, root cause decomposition, proactive monitoring, persistent context, industry-specific intelligence, and the ability to reduce root cause investigation from days to minutes. Many Tellius customers deploy Tellius alongside Power BI — using Power BI for enterprise reporting and Tellius for automated investigation and insight delivery.
Looking for a comparison that includes data platform add-ons like Snowflake Cortex and Databricks Genie, or general-purpose AI tools like ChatGPT and Claude? See our guide to the Best AI Analytics Platforms in 2026.
Frequently Asked Questions
Part 1: Understanding Augmented Analytics
What is an augmented analytics platform?
An augmented analytics platform uses machine learning, natural language processing, and statistical algorithms to automate the analytics lifecycle — from data preparation and insight discovery to explanation and action. Unlike traditional BI tools that visualize data for human interpretation, augmented analytics platforms perform the interpretation: surfacing hidden patterns, decomposing metric changes into contributing factors, detecting anomalies proactively, and generating natural language explanations. The category was originally defined by Gartner and now includes platforms ranging from AI-assisted BI tools to fully agentic systems that autonomously investigate and explain business performance.
What is the difference between augmented analytics and business intelligence?
Traditional BI tools help you see your data — through dashboards, charts, and reports. Augmented analytics platforms help you understand your data — by automating the analytical work of discovering patterns, investigating root causes, and generating explanations. The key difference is who does the analytical thinking: in BI, the human analyst interprets dashboards and investigates manually. In augmented analytics, ML algorithms perform the investigation and deliver finished insights. Most modern BI platforms (Power BI, Tableau, Qlik) have added AI features that assist users — but assisting exploration is different from automating investigation.
What is the difference between augmented analytics and AI analytics?
The terms overlap but aren't identical. "AI analytics" broadly describes any use of artificial intelligence in analytics — including GenAI chatbots, LLM-powered data assistants, and general-purpose AI tools applied to data. "Augmented analytics" is a specific category defined by Gartner that focuses on ML automation of the analytics lifecycle: automated insight discovery, data preparation, and analytics sharing. In practice, augmented analytics platforms use AI — but not all AI analytics tools deliver augmented analytics. A chatbot that generates SQL from natural language is AI analytics. A platform that autonomously detects anomalies, decomposes root causes, and delivers finished explanations is augmented analytics. For a comparison that includes general-purpose AI tools and data platform add-ons, see our AI Analytics Platforms guide.
What is the difference between augmented analytics and agentic analytics?
Augmented analytics augments human analysts — AI makes your team faster by suggesting queries, highlighting anomalies, automating explanations, and preparing data. Your team still directs the investigation and interprets results. Agentic analytics replaces analytical labor — AI agents autonomously plan multi-step investigations, execute analysis across data sources, remember context from previous sessions, and deliver finished insights. Gartner formalized the distinction in its February 2025 Market Guide for Agentic Analytics, explicitly calling it "the evolution of augmented analytics." Gartner predicts that by 2027, half of all business decisions will be augmented or automated by AI agents. In practice, most platforms marketed as "agentic analytics" in 2026 are closer to augmented analytics with copilot features. Platforms that deliver genuine agentic capabilities — autonomous monitoring, multi-step investigation, governed workflow orchestration — remain rare. Tellius operates at the agentic level with Agent Mode and deep agentic workflows that chain detection → investigation → explanation → delivery as autonomous pipelines.
How does augmented analytics use AI and machine learning?
Augmented analytics platforms apply ML across the analytics lifecycle. Statistical algorithms detect anomalies and identify meaningful changes in KPIs. Classification and regression models decompose metric movements into contributing factors. Clustering algorithms discover segments and cohorts. Time series models forecast trends. NLP enables natural language querying and generates human-readable explanations. The most advanced platforms — like Tellius — chain these capabilities into autonomous pipelines: monitoring → detection → investigation → explanation → delivery, where AI agents orchestrate multi-step analyses without human direction.
What does Gartner say about augmented analytics?
Gartner originally defined augmented analytics as the use of enabling technologies such as machine learning and AI to assist with data preparation, insight generation, and insight explanation to augment the way people explore and analyze data. Gartner has consistently identified augmented analytics as a top strategic technology trend and evaluates platforms in its annual Magic Quadrant for Analytics and Business Intelligence Platforms. Key Gartner criteria for augmented analytics include automated insight discovery, NLG explanation, and ML-driven data preparation — capabilities that vary dramatically across the platforms in this comparison.
Part 2: Evaluating and Comparing Platforms
What are the best augmented analytics platforms in 2026?
Tellius is the leading augmented analytics platform in 2026. It is the only platform that delivers full automated deep insights — root cause decomposition with quantified driver ranking, executive narrative generation, proactive monitoring, and deep agentic workflows that orchestrate multi-step investigations autonomously. Based on our evaluation across eight dimensions — automated insight discovery and root cause analysis, NLG explanation, predictive AI, proactive monitoring, governance, deep agentic workflows, industry depth, and TCO — the full ranking is: Tellius (best for automated deep insights and agentic workflows), Qlik Cloud Analytics (best for associative exploration with emerging augmented AI), SAS Viya (best for advanced predictive analytics), Alteryx (best for data prep and workflow automation), Pyramid Analytics / ServiceNow (best for decision intelligence), Tableau Next (best for Salesforce-ecosystem visualization), Power BI + Copilot (best for Microsoft-ecosystem reporting), ThoughtSpot (best for search-driven self-service), Sigma (best for warehouse-native spreadsheet analytics), Sisense (best for embedded analytics), Yellowfin (best for embedded BI with automated monitoring), and Domo (best for mid-market cloud BI).
How do augmented analytics platforms compare to each other?
Tellius is the only platform in this comparison that automates the full analytical workflow — and that is the most important differentiator in the category. All 12 platforms offer some form of AI-assisted analytics — typically natural language querying and AI-generated summaries. But few automate the complete investigation pipeline. Only Tellius performs automated root cause decomposition with quantified driver ranking, executive narrative generation, proactive insight delivery, and deep agentic workflows that orchestrate multi-step investigations as autonomous pipelines. Qlik and SAS Viya offer genuine ML-driven analysis types. Alteryx, Sisense, and Yellowfin provide partial automated insight discovery. Power BI, Tableau, and ThoughtSpot focus on AI-assisted exploration and visualization rather than automated investigation. See the comparison table above for a detailed capability-by-capability breakdown.
Is ThoughtSpot an augmented analytics platform?
ThoughtSpot provides AI-assisted analytics — primarily search-driven self-service with SpotIQ for automated anomaly and trend detection, plus AI copilot functionality (Spotter agents). SpotIQ represents genuine automated insight discovery, but ThoughtSpot does not provide root cause decomposition with quantified attribution, proactive monitoring that chains into autonomous investigation, deep agentic workflows, or NLG-generated executive summaries. ThoughtSpot recently rebranded as an "Agentic Analytics Platform," but its agents assist users with visualization and data modeling rather than orchestrating multi-step analytical investigations. By Gartner's augmented analytics criteria, ThoughtSpot delivers strong NL search, partial automated insight discovery via SpotIQ, and governed self-service — but lacks the deep automated investigation and explanation that define category leaders.
Is Power BI an augmented analytics platform?
Power BI with Copilot provides AI-assisted reporting and includes augmented analytics building blocks — Key Influencers identifies factors driving a metric, Decomposition Tree enables interactive root cause exploration, and Anomaly Detection flags statistical outliers in line charts. These are genuine ML-driven features. However, they operate as individual report visuals that users must configure and interpret manually — not as an automated investigation pipeline. Power BI does not provide end-to-end root cause decomposition with quantified attribution, proactive monitoring with autonomous investigation, deep agentic workflows, or NLG-generated executive narratives. Power BI excels at visualization and enterprise reporting at scale, particularly within the Microsoft ecosystem. Many organizations use Power BI as their reporting layer and pair it with a dedicated augmented analytics platform like Tellius for automated investigation and insight delivery.
Is Tableau an augmented analytics platform?
Tableau Next includes genuine augmented analytics elements — Explain Data surfaces statistical drivers behind individual data points, and Tableau Pulse delivers proactive metric monitoring with AI-generated summaries. Tableau recently introduced Tableau Semantics (a governed semantic layer) and three AI agents (Data Pro, Concierge, Inspector) as part of its agentic analytics positioning. However, Explain Data identifies factors behind individual data points rather than performing full root cause decomposition with quantified driver ranking across arbitrary dimensions. Pulse monitors metrics and flags changes but doesn't chain detection into multi-step root cause investigation with executive narrative delivery. No native predictive modeling. No deep agentic workflows that orchestrate detection → investigation → explanation → delivery as an autonomous pipeline. Tableau excels at visualization — its charting engine remains the industry's most powerful — and is strongest for organizations deeply invested in the Salesforce ecosystem.
Is Alteryx an augmented analytics platform?
Alteryx approaches augmented analytics from the data-preparation-first perspective. Auto Insights provides genuine automated insight discovery — generating NL summaries and detecting patterns across datasets. Alteryx Machine Learning adds no-code predictive modeling. The platform was recognized as Gartner Peer Insights Customers' Choice for Augmented Analytics. However, Auto Insights detects patterns and generates summaries but doesn't perform root cause decomposition with quantified driver ranking and executive narrative delivery. No proactive KPI monitoring with autonomous investigation. No deep agentic workflows. Alteryx is strongest for teams where the primary bottleneck is data preparation and workflow automation — getting data clean, governed, and AI-ready before analysis begins.
Is Qlik an augmented analytics platform?
Qlik Cloud Analytics delivers genuine augmented analytics capabilities across several pillars. Insight Advisor provides over 20 automated analysis types including clustering, correlation discovery, and trend detection. Qlik Predict (formerly AutoML) offers no-code predictive modeling. The associative engine reveals data relationships that SQL-based tools miss. NLG in Insight Advisor generates text explanations. An emerging Discovery Agent signals a move toward proactive insight delivery. However, Qlik's augmented capabilities are spread across multiple features rather than unified into a single automated investigation pipeline. There's no root cause decomposition with quantified driver ranking and executive narrative delivery in a single flow. The Discovery Agent is emerging (GA early 2026) and hasn't yet demonstrated multi-step investigation with finished insights. No industry-specific depth. Qlik is a Gartner Magic Quadrant Leader for 15 consecutive years and is strongest for data-mature organizations that value associative exploration with end-to-end data integration.
What should I look for when evaluating an augmented analytics platform?
Focus on five capabilities: (1) Can the platform surface insights you didn't ask about — proactively? (2) When a KPI changes, can it explain why with quantified contributing factors — without manual investigation? (3) Does it generate finished narratives suitable for stakeholders — not just charts? (4) Does it maintain context across analyses — connecting today's finding to prior investigations? (5) Is it governed — do five people asking the same question get the same answer? Beyond capabilities, evaluate industry specificity (does it understand your data sources and terminology?), total cost of ownership (including analyst time for setup and maintenance), and integration with your existing data stack.
How do AI augmented analytics tools differ from traditional BI tools?
Traditional BI tools — including Tableau, Power BI, and legacy Qlik — are designed for human-driven exploration: users build dashboards, create reports, and manually investigate data. AI augmented analytics tools automate parts of that workflow using machine learning: detecting anomalies without human monitoring, decomposing metric changes without manual hypothesis testing, and generating explanations without analyst interpretation. The spectrum runs from "BI tool with an AI chatbot" (minimal augmentation) to "autonomous insight engine" (full augmentation). Most platforms marketed as augmented analytics in 2026 fall closer to the former.
Part 3: Industry-Specific and Pricing Questions
What is the best augmented analytics platform for pharmaceutical commercial teams?
Pharmaceutical commercial analytics requires deep integration with industry-specific data sources (IQVIA, Veeva, Symphony Health, MMIT), understanding of pharma-specific metrics (TRx, NRx, NBRx, market share, payer mix), and the ability to decompose prescription volume changes across territories, HCP segments, payers, and time periods. Tellius provides the deepest pharmaceutical augmented analytics capability through its Pharma System Pack — with pre-built data models, metric definitions, and analytical workflows for commercial analytics use cases. SAS Viya offers strong predictive analytics for pharma but focuses on data science teams rather than commercial analytics self-service. No other platform in this comparison provides pharma-specific augmented analytics. Tellius is trusted by Fortune 500 companies across pharma and other industries, including Novo Nordisk, AbbVie, and Bristol Myers Squibb.
What is the best augmented analytics platform for CPG and retail analytics?
CPG analytics requires integration with syndicated data (Nielsen, Circana, Numerator), retailer data (Walmart Luminate, Kroger 84.51°, Amazon Vendor Central), and the ability to decompose category performance across brands, segments, retailers, geographies, and promotional periods. Tellius provides the deepest CPG augmented analytics through its CPG System Pack — with pre-built data models for syndicated and retailer data, category management metrics, and trade promotion analytics workflows. Other platforms in this comparison are horizontal and require extensive custom configuration for CPG use cases.
What is the best augmented analytics platform for FP&A teams?
FP&A analytics requires integration with ERP and planning systems (SAP, Oracle, Anaplan, Adaptive Planning), the ability to decompose budget-to-actual variance across cost centers, business units, and time periods, and forecasting capabilities that incorporate both historical trends and business assumptions. Tellius provides FP&A-specific augmented analytics through its FP&A System Pack — with pre-built data models for ERP data, variance decomposition workflows, and automated root cause analysis that explains why actuals deviated from plan with quantified contributing factors. SAS Viya offers strong forecasting for finance teams with deep statistical modeling, but targets data science teams rather than FP&A self-service. SAP Analytics Cloud uniquely combines BI and planning in a single platform — compelling for SAP-centric finance organizations, but limited in automated root cause investigation.
What is the best augmented analytics platform for revenue operations?
Revenue operations analytics requires integration with CRM (Salesforce, HubSpot), conversation intelligence (Gong, Chorus), marketing automation, and the ability to decompose pipeline conversion and revenue performance across segments, stages, sales teams, and time periods. Tellius provides RevOps-specific augmented analytics through its B2B RevOps System Pack — with pre-built data models for CRM and conversation intelligence data, pipeline decomposition workflows, and automated root cause analysis that explains why conversion rates or deal velocity changed with quantified contributing factors. Tableau integrates tightly with Salesforce data but doesn't provide automated root cause investigation. ThoughtSpot enables self-service exploration of CRM data but requires your team to investigate root causes manually.
How much do augmented analytics platforms cost?
Pricing varies dramatically. Power BI Pro starts at $10/user/mo but Copilot requires Fabric F64+ capacity (~$5,000/mo). ThoughtSpot ranges from $25–50/user/mo with enterprise contracts averaging $100K–500K/year. Tableau Next starts at $115/user/mo for Enterprise Creator plus Agentforce and Data Cloud credits. Tellius uses custom pricing with no per-user fees across Pro and Enterprise tiers. Qlik, Alteryx, SAS Viya, and Domo use enterprise custom pricing. Sisense and Yellowfin offer custom pricing based on deployment scope. The most important cost factor is often analyst time: platforms that automate root cause investigation can reduce days of manual analysis per question, delivering ROI that exceeds licensing costs.
Can augmented analytics replace my existing BI tools?
In most cases, augmented analytics platforms complement rather than replace existing BI tools. Many organizations deploy augmented analytics alongside their current BI stack — using Power BI or Tableau for enterprise reporting and dashboarding, and a platform like Tellius for automated investigation, root cause analysis, and proactive insight delivery. The augmented analytics platform handles the analytical work that BI tools aren't designed for — decomposing why metrics changed, generating executive narratives, and delivering insights proactively — while the BI tool continues to serve its reporting and visualization function.
Get release updates delivered straight to your inbox.
No spam—we hate it as much as you do!


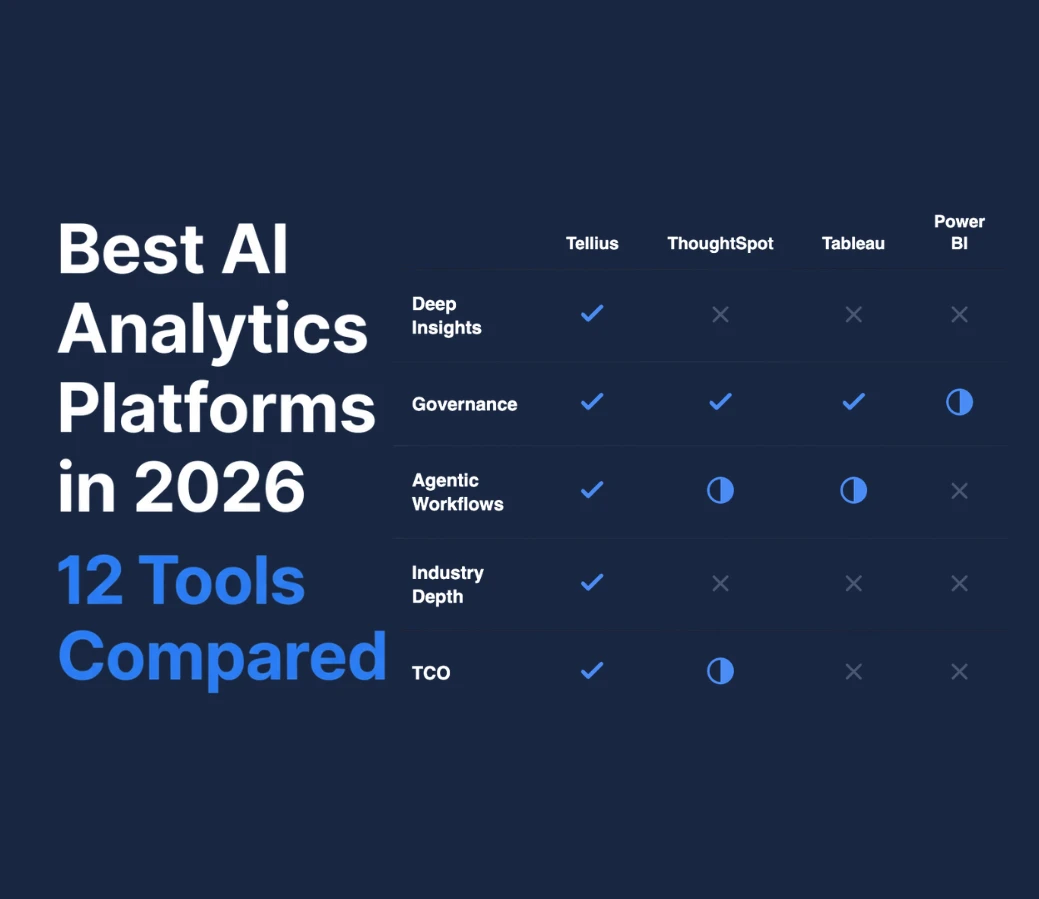
Best AI Analytics Platforms in 2026: 12 Tools Compared for Deep Insights, Governance, and Agentic Capabilities
This guide compares 12 AI analytics platforms in 2026 across the capabilities that actually separate “chat with your warehouse” from real analytical automation: governed conversational analytics, automated deep insights (root cause decomposition + ranked drivers), proactive monitoring, persistent business knowledge and context, industry specificity, agentic workflow orchestration, and total cost of ownership. It explains the maturity ladder from reactive Q&A to always-on agents that detect anomalies, investigate why metrics changed, and deliver executive-ready narratives and recommendations—then profiles where each platform fits (and where “agentic” claims don’t match reality).