AI-Powered Financial Variance & Root Cause Analysis
Traditional variance analysis shows you what changed. AI-powered variance analysis shows you why it changed, what drove it, and what to do about it. FP&A teams spend 3-5 days every close manually decomposing variances in Excel. CRM shows revenue numbers, ERP shows costs, but nobody can explain which product, region, or account drove the 5% EBITDA miss. This guide walks through how AI transforms variance analysis for finance teams.
What is AI-Powered Variance Analysis?
AI-powered variance analysis uses machine learning and natural language processing to unify ERP, planning, CRM, and operational data—automatically decomposing budget vs. actual gaps into drivers like price, volume, mix, cost center changes, and timing. Unlike Excel-based variance analysis that requires manual pivot tables and VLOOKUP formulas, AI-powered variance analysis ranks drivers by contribution and generates plain-English explanations in seconds. Tellius is an AI-powered variance analysis platform purpose-built for finance—combining conversational analytics for instant answers and agentic analytics for continuous budget monitoring.
The Problem
Finance teams spend close week explaining what happened instead of planning what's next
need subhead?
Finance teams operate without root cause, impact, or next-best action

Analysts work off stale data because GL close takes 5-7 days, planning systems update weekly, and operational data arrives in batches—adding days of lag every cycle.
Variance numbers never match across systems (finance BI vs. planning tool vs. department reports) because each applies different filters, hierarchies, and calculation logic.
P/V/M decomposition is manual because breaking revenue variance into price, volume, and mix requires building pivot tables, testing formulas, and validating assumptions—taking 1-2 days per analysis.
CFO asks "why over budget?" and the answer is: "Give us a few hours to investigate" because root cause requires pulling data from multiple sources and testing hypotheses manually.
Cost center overruns compound silently for 60-90 days because monthly reviews only flag variances after they've already exceeded thresholds—no early warning.
Board narratives written from scratch every month even though analysts already investigated the same variance drivers—duplicating effort between analysis and reporting.

What good variance analysis looks like (without the Excel duct tape)

Real-time data unification: GL actuals + budget + forecast + operational metrics in one place, with shared definitions so "revenue" means revenue everywhere.
Single source of truth: One semantic layer with governed account structures, so every team pulls from the same financial model.
Automated P/V/M analysis: AI decomposes revenue variance into price, volume, mix, and other drivers in seconds—quantifying each component's contribution.
Instant root cause: Ask "Why is EBITDA 5% below forecast?" in plain English and get driver attribution ranked by impact—no manual analysis required.
Proactive alerts: AI agents monitor budget vs. actual 24/7 and alert when variances cross thresholds or trends predict future overruns.
Automated narratives: AI generates plain-English summaries of variance drivers ready for CFO review—turning analysis into executive commentary automatically.
The results
The payoff from fixing variance analysis 10X faster
10
x
40
%
70%
$5M
Why tellius
How AI Analytics Transforms Variance Analysis

Unify
Direct connections to ERP, planning tools, and data warehouses instead of manual exports—so variance analysis refreshes in hours, not weeks.

Explain
Automated root cause analysis on every variance across product, region, channel, cost center, and timing—i.e., "60% of margin decline was driven by mix shift to lower-margin products, not pricing pressure."

Act
AI agents that monitor budget vs. actual 24/7, generate variance commentary automatically, and alert you before variances compound into bigger problems.
Questions & Answers
Real Questions from Finance Analytics Teams
Below, we've organized real questions from FP&A analysts and finance leaders into three parts. Every answer is grounded in actual practitioner challenges.
Part 1: Build the Variance Analysis Foundation
1. What is variance analysis in FP&A?
Variance analysis in FP&A is the practice of comparing actual financial results to budget, forecast, or prior period—then investigating why the differences occurred. The goal is to understand which factors drove performance gaps (revenue shortfalls, cost overruns, margin compression) and whether those variances require corrective action.
Traditional variance analysis involves pulling actuals from ERP systems like NetSuite, SAP, or Oracle, then comparing them against budget and forecast data from planning tools like Anaplan, Adaptive, or Workday. Analysts build Excel models with pivot tables and VLOOKUP formulas, manually testing hypotheses one at a time—was it volume? pricing? mix? cost overruns?—before presenting findings in PowerPoint or email. This process takes 3-5 days because each step requires manual data pulls, formula building, and validation.
AI-powered variance analysis automates this entire workflow. Instead of manual Excel work, analysts ask questions in plain English like "Why is EBITDA 5% below forecast?" and receive instant decomposition across all relevant drivers—product, region, channel, cost center, timing—ranked by contribution. What took 3-5 days now takes seconds.
2. What is price volume mix analysis?
Price/Volume/Mix (P/V/M) analysis decomposes revenue variance into three components. Price measures how much selling prices changed versus plan. Volume measures how many units were sold versus plan. Mix measures whether you sold more high-margin products or more low-margin products versus plan.
This is critical for understanding whether revenue declined because prices dropped, units sold decreased, or the mix shifted toward lower-value products. In traditional FP&A, P/V/M requires building Excel formulas that calculate weighted averages, apply price indices, and separate volume effects from mix effects—taking 1-2 days per analysis.
AI-powered P/V/M analysis automates this decomposition. When you ask "Break down revenue variance into price, volume, and mix," the system calculates all three components simultaneously and shows you which one contributed most. For example: "Revenue declined $5M: -$2M from volume drop, -$1.5M from mix shift to lower-margin SKUs, -$1.5M from pricing pressure." The system handles all the weighted-average calculations, variance decomposition logic, and reconciliation automatically.
3. How do you explain budget vs actual variance?
Explaining budget vs. actual variance requires identifying which dimensions drove the gap. The standard approach is to decompose total variance across relevant factors. First, you identify the variance—for example, actuals came in $10M below budget. Then you decompose by dimension to determine whether it was driven by product, region, channel, or timing. Next, you quantify contribution—perhaps Product A drove -$6M, Region B drove -$3M, and timing shift drove -$1M. Finally, you explain why—maybe Product A volume dropped due to competitive pressure while Region B faced delayed customer orders.
Traditional variance analysis does this manually in Excel by building waterfall charts, testing hypotheses one at a time, and validating assumptions through multiple iterations. AI-powered variance analysis automates this workflow completely. You ask "Why are we $10M below budget?" and the system tests all possible drivers simultaneously, ranks them by contribution, and generates a plain-English explanation: "Most of the shortfall is driven by Product A volume decline (-60%), with smaller contributions from Region B timing delays (-30%) and pricing pressure (-10%)."
For CFOs and finance leaders, this means answering "why over budget?" in real-time instead of "I'll get back to you in 3 days."
4. How do you find the root cause of a financial variance?
Finding root cause requires testing multiple hypotheses simultaneously and quantifying each driver's contribution. The traditional approach starts with total variance—for example, "EBITDA is 5% below forecast"—then breaks down by major categories like revenue versus costs. From there, you decompose revenue into product, region, and channel dimensions, decompose costs into cost centers and departments, test timing effects and one-time items and accounting changes, validate with operational stakeholders, and finally document findings and assumptions. This process takes 3-5 days because each step requires manual data pulls, Excel modeling, and validation. By the time you have an answer, the next question has already arrived.
AI-powered root cause analysis automates this workflow by testing all hypotheses at once using machine learning. When EBITDA drops, the system automatically decomposes the variance across revenue drivers like price, volume, mix, and timing, cost drivers including COGS and OpEx by department and one-time items, operational factors such as headcount, capacity utilization, and efficiency, and external factors including FX, commodity prices, and market conditions. The output is a ranked list of drivers with quantified contribution: "EBITDA declined 5% primarily due to higher Sales & Marketing OpEx (+60% of variance) and delayed revenue recognition (+25% of variance)." Analysts can then drill down into any driver for more detail.
5. Why is my gross margin declining?
Gross margin decline can be caused by several factors. Price erosion happens when selling prices drop due to competitive pressure or discounting. Cost inflation occurs when input costs—COGS, materials, labor—increase faster than revenue. Mix shift means revenue shifted toward lower-margin products or customer segments. Volume effects occur when fixed costs spread over fewer units, increasing per-unit cost. Operational inefficiency includes waste, rework, or capacity underutilization that increased costs.
Traditional analysis requires manually testing each hypothesis by building separate Excel models for price variance, cost variance, mix variance, and volume variance, then validating with operations and procurement teams. AI-powered margin analysis automates this investigation. When you ask "Why is gross margin down 3%?" the system decomposes the change across all drivers simultaneously and ranks them by contribution. For example: "Margin declined 3% primarily due to higher COGS in Europe (+45% of variance), mix shift to lower-margin products (+30%), and pricing pressure in Q3 (+15%)."
This allows finance teams to focus on the biggest drivers first instead of testing every possible hypothesis manually.
6. What is mix variance and how does it impact profitability?
Mix variance measures how profitability changes when the composition of revenue shifts—even if total revenue stays the same. Selling more high-margin products increases profitability, creating favorable mix, while selling more low-margin products decreases profitability, creating unfavorable mix. Shifting from direct sales to channel partners may reduce margin per unit even at the same revenue level.
Mix variance is calculated by comparing the actual product, customer, or channel mix to the planned mix, then quantifying the margin impact. If you planned to sell 60% Product A (high margin) and 40% Product B (low margin), but actually sold 40% Product A and 60% Product B, the mix shift created an unfavorable variance even if total units matched plan.
Traditional mix variance analysis requires building weighted-average margin calculations in Excel for every product, region, and channel—a multi-day exercise. AI-powered mix analysis automates this calculation. When you ask "What's driving margin decline?" the system automatically separates mix effects from price and volume effects, showing you: "Margin declined 2% due to unfavorable mix (-$3M from shift to lower-margin channels), partially offset by favorable pricing (+$1M)."
7. What is the difference between flux analysis and variance analysis?
Variance analysis compares actuals to budget or forecast—focusing on "we planned X, we achieved Y, why the difference?" Flux analysis compares period-to-period changes—focusing on "we did X last month or quarter or year, we did Y this period, what changed?" Both require decomposing the difference into drivers like price, volume, mix, cost changes, and timing, but variance analysis is plan-centric while flux analysis is trend-centric.
In practice, most FP&A teams do both. Variance analysis happens during close week to answer "Why are we over or under budget?" Flux analysis happens for business reviews to explain "Why did EBITDA change versus last quarter?" AI-powered analytics platforms handle both workflows through the same interface. You can ask "Why is EBITDA below forecast?" (variance) or "Why did EBITDA change vs. Q3?" (flux) and get the same automated driver decomposition.
8. What is financial analysis and why is it important for FP&A?
Financial analysis is the practice of examining financial data to understand business performance, identify trends, and support decision-making. For FP&A teams, this includes variance analysis comparing actuals versus budget or forecast, trend analysis examining period-over-period changes, ratio analysis evaluating margins and efficiency metrics and returns, scenario modeling through what-if simulations, and forecasting to predict future performance. The goal is to move from "what happened?" to "why did it happen?" to "what should we do about it?"
Traditional financial analysis is time-intensive because it requires pulling data from multiple systems like ERP, planning tools, and operational databases, building Excel models with manual formulas and assumptions, validating with business stakeholders, and creating PowerPoint presentations for leadership.
AI-powered financial analysis automates much of this workflow—unifying data sources, performing multi-dimensional decomposition automatically, and generating plain-English narratives ready for executive review. This shifts FP&A teams from spending 80% of their time on data wrangling and 20% on insights to the reverse.
Part 2: Understand Variance Drivers & Performance
9. What does a fully automated variance analysis workflow look like step-by-step?
A fully automated variance analysis workflow eliminates manual data pulls, formula building, and hypothesis testing—replacing a 3-5 day process with continuous, instant analysis.
Step 1 is automated data collection. When GL close completes in your ERP, the platform automatically pulls actuals by account, cost center, product, and region. Simultaneously, it pulls budget and forecast data from your planning tool. No exports, no file transfers, no manual reconciliation.
Step 2 is automatic variance calculation. The system calculates variance across every dimension automatically—total P&L variance, then broken down by revenue line, COGS category, OpEx department, and any other configured hierarchy. Variance percentages, dollar amounts, and prior period comparisons all calculate without formulas.
Step 3 is AI-powered driver decomposition. For any material variance, the system automatically tests all possible drivers—price, volume, mix, timing, one-time items, cost inflation—and ranks by contribution. Output: "Revenue variance of -$5M driven by volume decline (60%), unfavorable mix (25%), and pricing pressure (15%)."
Step 4 is narrative generation. The system converts driver decomposition into plain-English explanation suitable for executive review: "Revenue came in $5M below plan, primarily due to volume shortfall in Product A (-$3M) reflecting competitive pressure in mid-market segment."
Step 5 is continuous monitoring. AI agents watch for variances exceeding thresholds throughout the period—not just at close. When Sales & Marketing hits 110% of budget mid-month, you know immediately, not three weeks later.
The analyst role shifts from building analysis to reviewing and refining AI-generated outputs, adding strategic context, and recommending actions.
10. How do I configure P/V/M analysis for different product hierarchies and pricing structures?
Configuring P/V/M analysis requires mapping your specific product hierarchy, defining price calculation logic, and establishing mix comparison baselines.
Product hierarchy configuration determines at what level P/V/M calculates. For simple businesses, this might be SKU level—each product has a price and volume. For complex businesses, you might need P/V/M at product family level, then drill down to SKU detail. Configure hierarchies that match how your business makes pricing and volume decisions.
Price definition varies by business model. For standard products, price is revenue divided by units—straightforward. For subscription businesses, price might be ARPU or contract value. For businesses with heavy discounting, you need to decide whether "price" means list price, net price after discounts, or effective price including promotions. Document these definitions in your semantic layer.
Mix baseline selection affects interpretation. Mix variance compares actual product composition to planned composition—but which plan? Original budget may be outdated. Latest forecast reflects current expectations. Prior year same period shows year-over-year mix shift. Configure which baseline is default, and ensure users can switch between baselines for different analyses.
Volume unit consistency matters for accurate decomposition. If some products measure volume in units and others in cases or pallets, the system needs conversion factors. If you sell services alongside products, define how service "volume" is measured—hours, engagements, or contracts.
Multi-currency handling requires attention for global businesses. Price variance needs to separate local currency price changes from FX translation effects. Configure whether P/V/M calculates in local currency, reporting currency, or both.
11. How do I ensure data quality for accurate variance analysis?
Data quality issues are the primary cause of variance analysis errors. Ensuring accuracy requires validation at three levels: completeness, consistency, and timeliness.
Completeness validation confirms all expected data arrived. After GL close, verify that all accounts have actuals posted—no missing cost centers, no zero balances where activity occurred. After planning refresh, confirm budget exists for every actual account. Configure automated checks that flag missing data before analysis runs.
Consistency validation ensures actuals and budget use the same structures. Account hierarchies must match—if actuals post to "Sales & Marketing" but budget uses "S&M," the variance calculation breaks. Product and region mappings must align between ERP and planning tool. The semantic layer should flag inconsistencies automatically: "Budget exists for Region X but no actuals posted."
Timeliness validation tracks data freshness. Variance analysis using stale data produces misleading conclusions. Configure data refresh timestamps visible to users—"Actuals as of January 15, Budget version Q1 Forecast v3." Alert users when data is older than expected: "Warning: GL actuals are 48 hours old, close may be incomplete."
Common data quality issues to address include one-time items and adjustments that distort trend analysis (tag these for separate treatment), restatements and reclassifications that change prior period comparisons (maintain both original and restated views), intercompany eliminations that can double-count or under-count depending on timing, and currency translation that creates variance from FX movements rather than operational performance.
Build reconciliation checks comparing your variance analysis totals to official financial statements. If the numbers don't match, investigate before distributing analysis.
12. How do I connect financial variances to operational drivers?
Connecting financial variances to operational drivers means linking GL results to the business activities that caused them. Revenue variance connects to sales pipeline, bookings, and customer churn. COGS variance connects to production volumes, yield rates, and material costs. OpEx variance connects to headcount, compensation, and discretionary spend. Margin variance connects to product mix, pricing actions, and promotional spend.
Traditional analysis does this manually by exporting GL data to Excel, pulling operational metrics from separate systems, and building manual correlation models. This takes days and often produces weak connections because the data doesn't align on timing, hierarchies, or granularity.
AI-powered platforms automate this by integrating financial and operational data into a single model. When EBITDA drops, the system automatically tests correlations across sales metrics like pipeline, bookings, and churn, operational metrics including headcount, volumes, and capacity, and market factors such as competition, pricing, and demand. The output explains both the financial variance and the operational driver: "EBITDA declined 5% primarily due to higher Sales & Marketing OpEx (+60%), driven by unplanned headcount additions (+8 FTEs vs. plan) and increased SaaS tool spend (+$120K)."
This allows finance teams to connect "we're over budget" to "because we hired 8 more people than planned"—enabling actionable conversations with business stakeholders.
13. How do you analyze forecast accuracy and improve it?
Forecast accuracy analysis compares what you forecasted to what actually happened—identifying systematic biases and high-error areas. The goal is to improve future forecasts by understanding where and why you're consistently wrong.
Traditional approach involves exporting forecast versions and actuals to Excel, calculating variance by product, region, and time, identifying patterns to determine if you're always over, always under, or experiencing high volatility, interviewing business stakeholders about forecast assumptions, and adjusting future forecasts based on lessons learned. This is time-consuming and relies on manual pattern recognition.
AI-powered forecast accuracy analysis connects to your planning tool like Anaplan or Adaptive and your ERP for actuals. You ask "Which products have the highest forecast error?" and the system automatically calculates error by dimension and ranks worst performers. The AI identifies patterns such as "Product A forecasts are consistently 20% too high" and generates recommendations like "Adjust Product A forecast assumptions down by 15%."
The system can also detect leading indicators that predict forecast misses—like pipeline coverage drops or early booking trends—and alert you before the forecast becomes obsolete.
14. How do I connect NetSuite data to variance analysis tools?
Connecting NetSuite to variance analysis tools requires either manual export where you export GL detail, P&L, and balance sheet to CSV, load into Excel or BI tool, manually refresh weekly or monthly, with 24-72 hours of lag per refresh, or using a pre-built connector through a platform with native NetSuite integration like Tellius where you configure a semantic layer to map NetSuite accounts to business definitions and auto-refresh on schedule or near-real-time with only hours of lag, not days.
The key is the semantic layer. NetSuite account codes like "4000-100 Product Revenue East" need to map to business-friendly terms like "Revenue > Product A > East Region" so analysts can ask questions in plain English instead of learning account codes.
Once connected, variance analysis becomes conversational. "Why is OpEx over budget?" automatically pulls NetSuite actuals, compares to budget from Anaplan or within NetSuite, and decomposes the variance by cost center and account.
15. Can I do variance analysis on top of Anaplan or Pigment data?
Yes. Anaplan and Pigment are planning tools that store budget, forecast, and scenario models. Variance analysis requires comparing their plan data to actuals from ERP systems like NetSuite, SAP, or Oracle.
Traditional approach involves exporting budget from Anaplan, exporting actuals from ERP, manually reconciling hierarchies and accounts in Excel, then calculating variance and investigating drivers. Modern approach uses a platform like Tellius that connects to both Anaplan and your ERP, where a semantic layer automatically reconciles account structures and hierarchies. You ask "Why is EBITDA below Anaplan forecast?" and the system pulls both datasets, calculates variance, and decomposes drivers automatically.
This is particularly valuable because Anaplan users often have multiple forecast versions—budget, latest estimate, rolling forecast—and need to compare actuals to each version. AI-powered platforms can handle these comparisons automatically without manual exports.
16. How do I combine ERP and CRM data for variance root cause analysis?
Combining ERP and CRM data allows you to connect financial results like revenue, bookings, and billings to sales activities including pipeline, deals, and customer engagement. This is critical for understanding whether revenue variances are driven by sales execution, market conditions, or timing.
Use cases include investigating revenue below plan to determine if pipeline coverage was low, deals slipped, or churn increased, analyzing bookings variance to identify which sales regions or reps drove the gap, and assessing customer concentration risk to understand if top customers are churning or expanding.
Traditional approach involves exporting revenue from ERP systems like NetSuite or SAP, exporting pipeline and bookings from CRM like Salesforce, manually matching customer names and time periods in Excel, then calculating correlations and trends. AI-powered approach connects the platform to both ERP and CRM, uses a semantic layer to reconcile customer IDs and hierarchies automatically, and allows you to ask "Why is Q4 revenue 15% below plan?" The system decomposes across both financial drivers like product mix and pricing and sales drivers including pipeline coverage, win rate, and deal slippage.
This gives finance teams a complete picture: "Revenue declined $5M: -$3M from lower bookings in Enterprise segment (CRM data), -$2M from delayed renewals in Q4 (ERP data)."
17. Can AI agents monitor for budget variances automatically?
Yes. AI agents can monitor budget versus actual performance 24/7 and alert when variances exceed thresholds or trends predict future overruns.
How it works: You configure monitoring rules such as "Alert if any cost center exceeds budget by 10%." The AI agent continuously watches GL actuals versus budget. When a threshold is crossed, the agent investigates root cause automatically and sends an alert with explanation: "Sales & Marketing is 12% over budget ($450K), driven by unplanned headcount additions (+5 FTEs) and conference spend (+$80K)."
Benefits over manual monitoring include catching variances in real-time instead of waiting for monthly close, investigating root cause automatically instead of requiring analyst time, alerting before variances compound into bigger problems, and monitoring hundreds of cost centers, products, and regions simultaneously.
This shifts finance from reactive—"we're over budget, now investigate"—to proactive—"variance detected, root cause identified, here's what to do."
18. How do I get conversational insights on budget vs actual performance?
Conversational insights mean asking questions in plain English and getting instant answers—no SQL, no pivot tables, no waiting for analyst support.
Examples include "Why is EBITDA 5% below forecast this month?", "Which cost centers are most over budget?", "Show headcount variance by department", and "Break down revenue variance into price, volume, and mix."
How it works: The platform connects to ERP for actuals and planning tool for budget. A semantic layer maps business terms to data structures. The natural language interface translates questions into queries. AI performs variance decomposition and ranks drivers. Results display in seconds with drill-down capability.
The key is the semantic layer—it needs to understand finance-specific terms like "EBITDA," "headcount variance," "budget vs. actual," and "P/V/M" without requiring users to specify table joins or calculation logic.
Platforms like Tellius provide this capability through Kaiya, their conversational AI assistant built specifically for enterprise analytics.
19. Can I ask questions about variance in natural language instead of building reports?
Yes. Natural language analytics for finance allows you to ask variance questions conversationally.
Instead of building a pivot table in Excel, creating a custom report in your BI tool, or submitting a ticket to the analytics team, you ask "Why is gross margin down 3% this quarter?", "Which products drove the revenue shortfall?", or "Show me cost centers over budget by more than 10%."
The platform translates your question into the appropriate queries, performs variance calculations, and ranks drivers by contribution—all in seconds.
Requirements for this to work include a semantic layer that understands finance terminology, connected data sources from ERP and planning tools, a natural language model trained on variance analysis patterns, and governed definitions so "revenue" means the same thing for everyone.
Generic chat interfaces often fail because they don't understand finance semantics. Purpose-built platforms like Tellius are designed specifically for this use case.
20. How do I analyze whether a budget miss was caused by pricing, volume, or product mix?
This is P/V/M analysis—Price, Volume, Mix decomposition. The goal is to separate three effects. Price effect measures whether you charged more or less per unit than planned. Volume effect measures whether you sold more or fewer units than planned. Mix effect determines whether you sold a different product mix than planned, meaning more high-margin or more low-margin products.
Traditional approach involves calculating actual and planned average selling price (ASP), calculating actual and planned volume, building formulas to separate price variance from volume variance, calculating mix variance by comparing weighted-average margins, and validating that price plus volume plus mix equals total variance. This requires building complex Excel formulas and takes 1-2 days.
AI-powered approach is simply to ask "Break down revenue variance into price, volume, and mix." The system automatically calculates all three components across all products and regions with output like "Revenue declined $5M: -$2M from volume drop, -$1.5M from unfavorable mix, -$1.5M from pricing pressure." You can drill down into any product or region for detail. The system handles all the weighted-average calculations, variance decomposition logic, and reconciliation automatically.
21. How can an FP&A team use AI to evaluate profitability by product, region, and channel when data comes from multiple disconnected systems?
Profitability analysis across multiple dimensions—product times region times channel times customer—requires combining revenue from ERP by product, region, and channel, COGS from ERP by product and sometimes region, operating expenses from GL allocated by product, region, and channel, CRM data including customer acquisition cost and retention, and operational data such as fulfillment costs and support costs.
Challenge: These datasets live in different systems with different granularity. ERP has revenue by product-region but not by channel. COGS is tracked by product but not region. OpEx is tracked by department but not product. Traditional approach exports all data to Excel and manually allocates costs, building profitability models with assumptions and proxies.
AI-powered approach connects the platform to all source systems including ERP, CRM, and operational databases. A semantic layer creates a unified profitability cube across product, region, channel, and customer dimensions. AI handles allocation logic such as "Allocate support costs by customer volume, fulfillment costs by region." You ask "Which product-region combinations are most or least profitable?" and the system calculates fully-allocated profitability and ranks segments.
This allows FP&A teams to answer strategic questions like "Should we exit Region X?" or "Which customers are destroying value?" without building manual allocation models.
22. How can AI help me quickly understand the root causes behind a sudden drop in gross margin or spike in SG&A?
AI accelerates root cause investigation by testing all possible drivers simultaneously instead of testing hypotheses one at a time.
Traditional root cause analysis follows this pattern: You see the variance—"Gross margin dropped 3%"—then test hypothesis 1: "Was it pricing?" by building an Excel model, finding it wasn't. Then test hypothesis 2: "Was it COGS?" by building another Excel model, finding it was partially this. Then test hypothesis 3: "Was it mix?" by building yet another Excel model, finding yes, mostly this. You document findings after 2-3 days.
AI-powered root cause analysis follows a different pattern. You see variance—"Gross margin dropped 3%"—and ask "Why did gross margin drop?" The AI tests all drivers simultaneously including pricing, COGS, mix, volume, and timing. Output appears in seconds: "Margin declined 3% primarily due to unfavorable product mix (45%), higher COGS in Europe (30%), and pricing pressure (15%)." You can drill down into any driver for more detail.
The AI uses machine learning to decompose variances across all dimensions, rank drivers by statistical contribution, and generate plain-English explanations—eliminating the manual hypothesis-testing loop.
For SG&A spikes, the same process applies: "SG&A is 15% over budget primarily due to higher Sales & Marketing spend (60%), driven by unplanned headcount (+8 FTEs) and increased SaaS tool costs (+$120K)."
23. How do I set up automated variance analysis on headcount and compensation that flags unusual patterns by team?
Automated headcount variance analysis requires three components. First, data sources including HRIS for actual headcount, FTEs, and compensation, planning tool for budgeted headcount and comp plan, and GL for actual payroll expense. Second, monitoring rules such as alerting if any department exceeds headcount plan by X FTEs, alerting if actual comp per FTE varies from plan by Y percent, alerting if headcount-to-revenue ratio deteriorates, and alerting if specific teams show unusual attrition or hiring spikes.
How it works: The AI agent monitors headcount and comp data daily or weekly. When variance exceeds threshold, the agent investigates which teams are over or under plan, whether variance is driven by hiring, attrition, or comp changes, and how this impacts OpEx forecast. The agent sends alert with context: "Engineering headcount is +12 FTEs vs. plan, driven by accelerated hiring in Q2. Estimated annual OpEx impact: +$2.4M if trend continues."
This catches headcount drift before it compounds into major budget overruns—giving finance teams time to adjust hiring plans or reforecast.
24. How does AI-powered root cause analysis work on financial data?
AI-powered root cause analysis on financial data uses machine learning to test all possible variance drivers simultaneously, rank them by statistical contribution, and generate plain-English explanations.
Traditional root cause analysis is sequential. You see a variance, form a hypothesis, build an Excel model to test it, validate results, and repeat until you find the answer. This takes days because you can only test one or two hypotheses at a time.
AI-powered root cause analysis is parallel. The system automatically decomposes any variance across all relevant dimensions—product, region, channel, cost center, timing, volume, price, mix—simultaneously. It uses statistical methods to quantify each driver's contribution, ranks them by impact, and generates explanations like "EBITDA declined 5% primarily due to higher Sales & Marketing OpEx (+60% of variance), driven by unplanned headcount additions, and delayed revenue recognition (+25%)."
The key difference is comprehensiveness. Where a human analyst might test 3-5 hypotheses before finding the answer, AI tests dozens or hundreds of combinations instantly, ensuring you don't miss critical drivers.
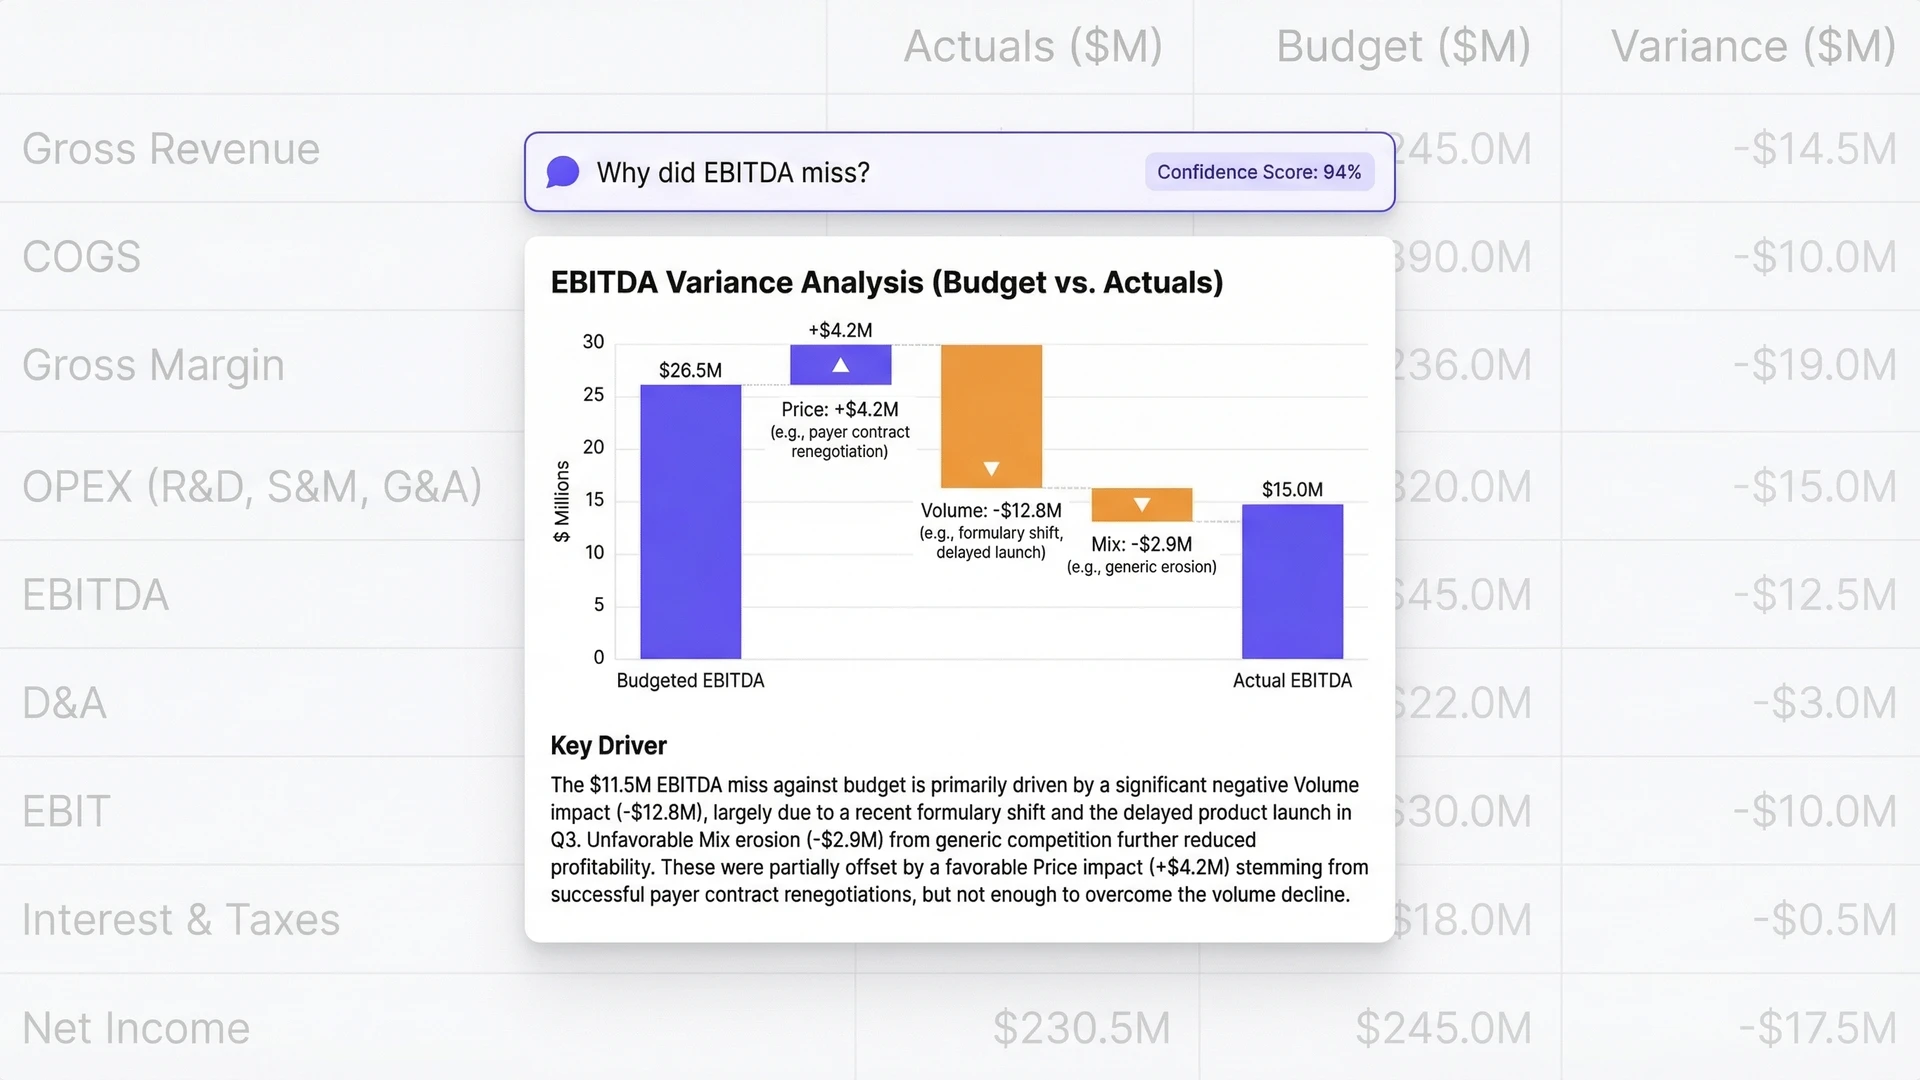
25. How do I analyze EBITDA variance and identify the key drivers?
EBITDA variance analysis decomposes the gap between actual and planned EBITDA into revenue and cost components.
Traditional approach involves calculating EBITDA variance as Actual EBITDA minus Planned EBITDA, breaking down revenue variance into price, volume, and mix, breaking down COGS variance into input costs, efficiency, and volume, breaking down OpEx variance by department and cost category, reconciling that Revenue variance minus COGS variance minus OpEx variance equals EBITDA variance, and documenting findings in PowerPoint. This takes 3-5 days because each component requires separate Excel analysis.
AI-powered approach is simply asking "Why is EBITDA 5% below forecast?" The system automatically decomposes across all drivers including Revenue with price, volume, mix, and timing components, COGS with input costs, efficiency, and volume components, and OpEx by department and category. Output: "EBITDA declined 5% primarily due to higher OpEx in Sales & Marketing (60% of variance) and lower revenue from delayed product launches (25%), partially offset by favorable COGS (15%)." You can drill down into any driver for more detail.
The system handles all variance reconciliation, waterfall calculations, and driver ranking automatically.
26. What's causing margin erosion even when revenue is growing?
Margin erosion despite revenue growth typically indicates one of four problems.
First, unfavorable mix shift where revenue is growing but shifting toward lower-margin products, channels, or customers while high-margin segments are flat or declining. Second, cost inflation exceeding price increases where COGS is rising faster than your ability to pass costs through to customers and fixed costs aren't scaling with revenue growth. Third, operating leverage deteriorating where OpEx is growing faster than revenue and investments in growth like sales, marketing, and R&D aren't yet paying off. Fourth, hidden inefficiencies including waste, rework, capacity underutilization, or increasing discounting and promotional spend.
Traditional analysis involves building a margin bridge in Excel showing revenue growth, COGS changes, OpEx changes, and resulting margin impact. AI-powered analysis is asking "Why is margin declining even though revenue grew?" The system decomposes margin change across all drivers including revenue growth by segment comparing high-margin versus low-margin, COGS variance with input costs, efficiency, and volume, OpEx variance by category, and mix effects across product, channel, and customer dimensions. Output: "Margin declined 2% despite 10% revenue growth, driven by unfavorable mix shift toward lower-margin channels (-3% margin impact), partially offset by improved COGS efficiency (+1%)."
This identifies the specific cause so finance teams can focus corrective actions appropriately.
Part 3: Evaluate & Implement AI-Powered Variance Analysis
27. What features distinguish the best variance analysis platforms?
The best variance analysis platforms combine automated decomposition, conversational access, and proactive monitoring—not just visualization of pre-calculated variances.
Automated driver decomposition means the platform tests all possible variance drivers simultaneously and ranks by contribution. You shouldn't need to build the decomposition logic—the platform should identify that "Revenue variance of -$5M is 60% volume, 25% mix, 15% price" automatically.
Multi-dimensional analysis means the platform can find variance drivers at dimensional intersections—"Product A in Region B through Channel C"—not just single dimensions. Many variances hide in these intersections; platforms limited to single-dimension analysis miss them.
Conversational interface means analysts ask questions in plain English rather than building reports. "Why is EBITDA below forecast?" should produce instant, comprehensive answers without requiring dashboard configuration or report building.
Proactive monitoring means AI agents watch for variances continuously and alert when thresholds are crossed—not just when someone thinks to check. This catches budget overruns mid-month rather than at close.
Narrative generation means the platform converts variance analysis into executive-ready explanations automatically. Driver decomposition is useful; plain-English narrative is actionable.
Governed semantic layer means "revenue," "EBITDA," and "variance" produce consistent results regardless of who asks or how they phrase the question. This eliminates the "five analysts, five different numbers" problem.
28. How do I migrate existing Excel variance models to an AI-powered platform?
Migrating Excel variance models requires documenting existing logic, configuring equivalent calculations in the platform, and running parallel analysis to validate accuracy.
Document existing Excel logic first. Catalog every variance calculation your team runs—budget versus actual by cost center, P/V/M by product, flux analysis quarter over quarter. For each, document the formula logic, data sources, hierarchy mappings, and any manual adjustments. This becomes your configuration specification.
Map Excel formulas to semantic layer definitions. Your Excel model calculates "Revenue Variance = Actual Revenue - Budget Revenue." The semantic layer needs the same definition, pulling actuals from ERP and budget from planning tool. Walk through every calculated field and ensure equivalent logic exists in the platform.
Configure hierarchy mappings carefully. Excel models often have hardcoded hierarchies—"Product A rolls up to Category 1." The platform needs these hierarchies configured in the semantic layer, ideally pulling from source system masters rather than hardcoding. This ensures hierarchies update automatically when products are added or reorganized.
Run parallel analysis for 2-3 close cycles. Calculate variance in both Excel and the platform. Compare results line by line. Investigate any differences—they indicate either Excel errors (which are common) or platform configuration issues. Don't retire Excel until parallel results match consistently.
Plan for exceptions and edge cases. Excel models handle one-time adjustments through manual overrides. Configure how the platform handles these—excluded from trend analysis, flagged separately, or included with notation. Document these decisions for users.
Expect the migration to surface Excel model inconsistencies. Different analysts built different models with different assumptions. The platform forces standardization—which is painful initially but eliminates "five analysts, five different numbers" permanently.
29. How do variance analysis outputs integrate with existing BI dashboards and reporting?
Variance analysis outputs can integrate with existing BI tools through data export, embedded visualizations, or narrative injection—complementing dashboards rather than replacing them.
Data export integration means variance analysis results export to formats your BI tool can consume. Driver decomposition exports as structured data—dimension, driver name, contribution percentage, dollar impact—which Tableau or Power BI can visualize as waterfall charts or driver rankings. This works for periodic reporting where variance analysis runs at close and exports to refresh dashboards.
Embedded visualization integration means some AI platforms generate visualizations that can embed in existing dashboards via iframe or API. The variance waterfall chart updates automatically when analysis refreshes, appearing within your existing Tableau or Power BI environment. Users see familiar dashboard layout with AI-powered variance detail embedded.
Narrative injection integration means AI-generated explanations inject into dashboard commentary sections. Instead of manually writing "EBITDA declined due to higher OpEx," the AI-generated narrative appears automatically. This requires your BI tool to support dynamic text fields pulling from external sources.
Complementary usage patterns work best. Use BI dashboards for standardized KPI monitoring—executives see the same revenue, EBITDA, and margin visuals every month. Use AI-powered variance analysis for investigation—when EBITDA drops unexpectedly, drill into root cause through the AI platform rather than building new dashboard views.
Alert routing integration connects AI-powered variance alerts to BI-based action workflows. When the AI agent detects a variance, the alert includes links to relevant BI dashboard sections for additional context. Users move fluidly between AI explanation and BI visualization.
30. What variance analysis scenarios should we test during vendor proof-of-concept?
Proof-of-concept testing should cover your most common variance scenarios, your most complex edge cases, and your most time-consuming current analyses.
Test your standard monthly close scenarios. Bring actual close data from the past quarter—actuals, budget, and the variance your team calculated manually. Ask the platform to analyze the same variance. Compare results: Does AI decomposition match your team's findings? Does it surface drivers your team missed? Is the explanation accurate and executive-ready?
Test P/V/M decomposition with your actual data. Provide revenue by product with units and pricing. Ask for price, volume, and mix breakdown. Validate the math—do the three components sum to total variance? Does the system handle your product hierarchy correctly? Can you drill from total P/V/M to individual product detail?
Test multi-dimensional complexity. Provide a variance that spans multiple dimensions—revenue down in Product A, but only in Region B, and only through Channel C. Does the AI identify this intersection? Generic platforms often stop at single-dimension analysis; purpose-built platforms find dimensional intersections that explain variance more precisely.
Test edge cases from your history. Find a quarter with unusual circumstances—restatements, one-time items, acquisitions, or divestitures. See how the platform handles complexity. Does it separate one-time from recurring? Can it exclude or include specific items for different analysis views?
Test narrative quality against your standards. Have the platform generate executive commentary for a variance you've already explained to leadership. Compare AI-generated narrative to what your team produced. Is the AI version as clear? As accurate? Would your CFO accept it with minor edits?
Test continuous monitoring scenarios. Configure an alert for a threshold your business cares about—cost center over budget by 10%, for example. Simulate a threshold breach and verify the alert includes meaningful root cause, not just "threshold exceeded."
31. Where does AI actually add value in variance analysis?
AI adds value in variance analysis in four specific areas. First, speed through automation where manual Excel analysis taking 3-5 days becomes instant answers taking seconds. AI tests all drivers simultaneously instead of sequentially, eliminating the hypothesis-testing loop.
Second, comprehensiveness where human analysts might test 3-5 hypotheses before finding the answer, while AI tests dozens or hundreds of driver combinations instantly, ensuring you don't miss critical factors hidden in dimensional intersections like "Product A in Region B sold through Channel C."
Third, consistency where Excel models produce different answers depending on who built them, which formulas they used, and what assumptions they made. AI-powered platforms ensure everyone gets the same answer through governed semantic layers, eliminating the "five analysts, five different numbers" problem.
Fourth, proactivity where manual analysis only happens when someone asks a question, while AI agents monitor continuously 24/7, detecting variances as they emerge and investigating root cause automatically before they compound into bigger problems. This shifts finance from reactive to proactive.
AI doesn't add value in areas requiring judgment like deciding whether a variance requires corrective action, determining strategic response to variances, understanding business context behind numbers, or explaining findings to non-finance stakeholders. These remain human responsibilities.
The goal isn't replacing analysts—it's freeing them from data wrangling so they can focus on strategy and recommendations.
32. What are the common deployment pitfalls for AI-powered variance analysis and how do I avoid them?
Deployment pitfalls typically stem from data issues, scope creep, and adoption challenges. Anticipating these accelerates time-to-value.
Data quality surprises are the most common pitfall. Teams assume their ERP and planning data is clean, then discover during integration that account hierarchies don't match, budget dimensions don't align with actuals, or historical data has gaps. Avoid this by running data quality assessment before deployment begins—not during. Identify and fix issues in source systems rather than building workarounds in the platform.
Scope creep delays initial value. Teams want to configure every possible variance analysis before go-live—P/V/M, cost center variance, headcount analysis, margin bridge, and more. This extends deployment from 10 weeks to 20 weeks while users wait for value. Avoid this by launching with 2-3 high-value use cases, proving value, then expanding. Monthly budget variance analysis is the typical starting point.
Semantic layer perfectionism stalls progress. Teams spend weeks debating whether "revenue" should include or exclude certain items, how hierarchies should roll up, and which forecast version is "official." These debates are valuable but shouldn't block deployment. Avoid this by making pragmatic initial decisions, documenting them clearly, and refining based on actual usage. Perfect is the enemy of deployed.
User adoption resistance undermines ROI. Analysts comfortable with Excel may resist new tools, especially if they feel threatened rather than empowered. Avoid this by positioning AI as "handling the grunt work so you can focus on strategy," involving analysts in configuration decisions, and celebrating early wins publicly.
Integration complexity with existing workflows is underestimated. Variance analysis doesn't happen in isolation—it feeds close processes, board reporting, and executive reviews. Avoid this by mapping current workflows before deployment and ensuring AI outputs integrate smoothly with downstream processes.
33. How do I measure variance analysis efficiency improvements after deployment?
Measuring efficiency improvements requires baselining current state, tracking post-deployment metrics, and attributing changes to the platform rather than other factors.
Baseline current variance analysis effort before deployment. Track hours spent per variance investigation—from data pull through executive presentation. Track investigation volume—how many variance questions arise per close cycle? Track cycle time—how long from close completion to variance explanation delivery? Track rework—how often do initial analyses require revision? Document these baselines for 2-3 close cycles before deployment.
Post-deployment metrics track the same dimensions. Hours per investigation should drop significantly—from 8-12 hours to 1-2 hours for typical variances. Investigation capacity should increase—teams can answer more questions in the same time. Cycle time should compress—variance explanations available day 2 of close instead of day 5. Rework should decrease—AI-generated analysis is consistent and complete.
Attribution requires isolating platform impact from other changes. If you simultaneously deployed the platform and reorganized your FP&A team, efficiency gains are harder to attribute. Track metrics consistently and note any confounding factors.
Qualitative improvements matter alongside quantitative metrics. Are variance explanations more comprehensive—surfacing drivers analysts previously missed? Are executives more satisfied with explanation quality? Are analysts spending more time on strategic work and less on data wrangling? Survey stakeholders periodically to capture these improvements.
Calculate cost savings from efficiency gains. If analysts reclaim 20 hours per close cycle and your loaded analyst cost is $75/hour, that's $1,500 per analyst per month, or $18,000 per analyst per year. Multiply by analyst count for total savings. Compare to platform cost for ROI calculation.
34. How do I configure variance analysis across multiple budget and forecast versions from my planning tool?
Planning tools maintain multiple versions—original budget, latest forecast, quarterly re-forecasts, scenario models—and variance analysis needs clear configuration for which versions to compare against actuals.
Version naming conventions must be consistent. If Anaplan calls it "Budget_2024_v1" and your platform calls it "Original Budget 2024," users get confused about which version they're analyzing. Configure version names that match user expectations and appear consistently across planning tool and variance analysis platform.
Default comparison configuration determines what users see initially. Most teams set "Actual vs. Latest Forecast" as default for operational variance analysis—this shows performance against current expectations. "Actual vs. Original Budget" is default for annual tracking—this shows performance against board-approved targets. Configure defaults that match your reporting rhythm.
Multi-version comparison enables richer analysis. Showing actuals versus latest forecast versus original budget simultaneously reveals whether variances are worsening or improving relative to initial plan. Configure views that display multiple comparisons: "Revenue is 5% below latest forecast but only 2% below original budget—we've already adjusted expectations downward."
Version refresh timing must be documented. When does latest forecast version update? If variance analysis runs Monday but forecast updated Tuesday, users see stale comparisons. Configure clear timestamps showing which forecast version is being used and when it was last updated.
Scenario model integration extends variance analysis to forward-looking views. Beyond comparing actuals to budget, you might compare current forecast to optimistic or pessimistic scenarios. Configure scenario comparisons for strategic planning discussions—"If revenue hits pessimistic case, we're 15% below original budget."
Historical version preservation enables trend analysis. Don't overwrite old forecast versions—preserve them for accuracy analysis. "Our Q1 forecast was 10% too optimistic; our Q2 forecast was only 3% off." This requires version archiving in either the planning tool or variance platform.
35. How does Tellius handle complex variance scenarios like restatements, acquisitions, and one-time items?
Complex variance scenarios require special handling to avoid misleading analysis. Tellius provides configuration options for restatements, M&A impacts, one-time items, and other non-routine situations.
Restatement handling maintains both original and restated views. When prior periods are restated, variance analysis needs to show "actuals versus original budget" using original actuals and "actuals versus budget on restated basis" using restated actuals. Tellius allows tagging restatement adjustments and generating either view on demand, ensuring trend analysis isn't distorted by retroactive changes.
Acquisition and divestiture treatment isolates M&A impacts. When you acquire a company mid-year, revenue variance analysis needs to separate organic growth from acquired growth. Tellius allows tagging acquired entities and calculating organic variance excluding acquisitions: "Total revenue grew 20%, with 12% organic growth and 8% from acquisition." Divestitures receive similar treatment—excluding divested operations from year-over-year comparisons.
One-time item flagging prevents distortion of trend analysis. A $5M restructuring charge shouldn't make every future quarter look favorable by comparison. Tellius allows tagging one-time items and generating variance views "including one-time items" and "excluding one-time items." The AI agent can alert on one-time item impact: "SG&A variance of 15% unfavorable includes 10% from one-time restructuring; underlying variance is 5% unfavorable."
Currency translation separation isolates FX impacts. For global businesses, revenue variance includes both operational performance and currency translation effects. Tellius calculates local currency variance separately from translation variance: "Revenue declined 3% in USD, but grew 2% in constant currency—the gap is FX translation."
Intercompany elimination handling prevents double-counting. Consolidated variance analysis must net out intercompany transactions. Tellius respects elimination entries and calculates variance at consolidated level correctly, with drill-down capability to entity-level detail before eliminations.
"We’ve had a great experience with Tellius. The platform is suitable to business users who don't have technical knowledge and who need information instantaneously. Huge productivity gains!"

Ready to Transform Variance Analysis?
Join leading finance teams using AI agents to automate root cause analysis, reduce close cycles by 70-85%, and catch budget variances before they compound.
Continue the journey
Dig into our latest content related to variance analysis.
.webp)
Best FP&A Software in 2026: The Tools That Plan, and the Layer That Explains Why
Modern FP&A teams need more than planning software—they need the ability to explain financial performance, identify the drivers behind change, and act faster on emerging risks and opportunities. This buyer's guide compares the leading FP&A platforms in 2026 across budgeting, forecasting, scenario modeling, financial consolidation, reporting, AI-assisted planning, and enterprise analytics. It also introduces a new evaluation framework: distinguishing the systems that plan from the intelligence layer that explains why.
.webp)
14 Best AI Tools for Finance Teams in 2026 | Comparison Guide
AI is rapidly reshaping how finance teams plan, analyze, and report on business performance. This guide compares 14 of the best AI tools for finance teams in 2026, covering platforms for financial analysis, forecasting, reporting, and automated insights. It explains how modern AI tools help finance professionals move beyond spreadsheets and manual reporting by automating data integration, uncovering drivers behind financial performance, and generating faster forecasts and variance explanations. The article also provides a practical framework for evaluating finance AI tools—highlighting which platforms are best for FP&A, financial analysis, operational planning, and executive reporting in today’s AI-driven finance stack.
What Is AI-Powered Financial Analytics? 2026 Guide
AI-powered financial analytics is transforming how finance teams analyze performance, forecast outcomes, and explain business results. Instead of relying on manual spreadsheets and static dashboards, modern AI analytics platforms use machine learning, natural language interfaces, and automated analysis to uncover the drivers behind financial metrics in seconds. This guide explains how AI-powered financial analytics works, the core technologies behind it, and how finance teams use it for tasks like variance analysis, forecasting, anomaly detection, and executive reporting. It also explores how AI shifts finance from reactive reporting to proactive, insight-driven decision-making by automatically identifying trends, investigating root causes, and generating clear explanations of what’s impacting business performance.

Heading
Heading 1
Heading 2
Heading 3
Heading 4
Heading 5
Heading 6
Lorem ipsum dolor sit amet, consectetur adipiscing elit, sed do eiusmod tempor incididunt ut labore et dolore magna aliqua. Ut enim ad minim veniam, quis nostrud exercitation ullamco laboris nisi ut aliquip ex ea commodo consequat. Duis aute irure dolor in reprehenderit in voluptate velit esse cillum dolore eu fugiat nulla pariatur.
Block quote
Ordered list
- Item 1
- Item 2
- Item 3
Unordered list
- Item A
- Item B
- Item C
Bold text
Emphasis
Superscript
Subscript
The Challenge Every Pharma Commercial Leader Faces
You're drowning in data from IQVIA, claims databases, CRM systems, and competitive intelligence platforms—yet when executives ask "Why did our numbers change?" the answer is always: "We'll need a few days to investigate."
The Problem Isn't Lack of Data — It's Lack of Insights
Traditional dashboards show what happened, not why
Root cause analysis takes days or weeks of manual investigation
Non-technical users can't explore data without submitting IT requests
Insights arrive too late to prevent revenue loss
Multiple tools and data sources create fragmented views
Field teams spend 40% of their time preparing reports instead of selling
Agentic Analytics Changes Everything
Deploy AI agents that work 24/7—continuously monitoring your business, automatically investigating changes, and proactively alerting you to risks and opportunities. From weeks of manual analysis to seconds of AI-generated insights. From reactive reporting to agentic intelligence. From data silos to unified, self-operating analytics.
Introducing Pharma Intelligence
Unified decision intelligence across your entire commercial operation
Pharma teams depend on fast, accurate insights across HCP targeting, field execution, market access, contracting, brand growth, patient services, and incentive compensation. Pharma Intelligence brings all these capabilities together—powered by AI analytics and agentic workflows—to help organizations unify data, explain performance, detect risks, and drive next-best actions across every commercial function.
📊 Analytics Solutions for Every Commercial Function
📊
Analytics Solutions for Every Commercial Function
Each hub addresses critical challenges with unified data, instant root cause analysis, and AI-powered insights. Choose your area to explore how we solve your specific pain points.

Field Force Sales Effectiveness
📝
34 Questions
⏱️
6,000 words
Pharma teams depend on fast, accurate insights across HCP targeting, field execution, market access, contracting, brand growth, patient services, and incentive compensation. Pharma Intelligence brings all these capabilities together—powered by AI analytics and agentic workflows—to help organizations unify data, explain performance, detect risks, and drive next-best actions across every commercial function.
Critical Capabilities:
HCP targeting & segmentation (AI-powered scoring)
Territory performance vs. potential (real-time)
Call quality & message effectiveness (NLP analysis)
Prescriber churn prediction (early warning alerts)
Pre-call planning (automated contextual briefs)

Brand Performance & KPIs
📝
31 Questions
⏱️
6,500 words
Transform business reviews and root cause analysis with instant TRx/NBRx explanations, automated market share decomposition, and complete narrative generation. Uncover hidden opportunities worth millions while reducing prep time from 2 weeks to 2 days—eliminating the endless Excel work and manual investigation cycle.
Critical Capabilities:
TRx/NBRx anomaly detection & auto-explanation
Market share decomposition (instant driver analysis)
Root cause analysis (multi-variable, seconds not days)
Business review automation (narrative + visuals)
Competitive intelligence (continuous tracking)

Market Access Performance
📝
30 Questions
⏱️
5,500 words
Track formulary changes, prior auth approval rates, and payer mix shifts with unified access intelligence—identifying exactly where coverage restrictions cost you scripts before they impact revenue. Get automated alerts on formulary movements, access barriers, and abandonment patterns with recommended interventions.
Critical Capabilities:
Formulary impact alerts (position change detection)
Prior authorization tracking (approval rate trends)
Payer mix dynamics (coverage shift analysis)
Abandonment prediction (access barrier identification)
Copay program ROI (effectiveness measurement)

Contracting & Payer Strategy
📝
30 Questions
⏱️
5,500 words
Optimize contract performance with unified tracking of rebate effectiveness, volume commitments, and ROI across all payer agreements. Model negotiation scenarios, measure contract impact in real-time, and identify which agreements deliver value and which underperform—with recommended actions before renewals.
Critical Capabilities:
Performance vs. expectations (continuous tracking)
Rebate effectiveness (automated optimization)
Scenario modeling (what-if negotiations)
Gross-to-net decomposition (contract-level)
Value-based outcomes (automated tracking)

HCP Targeting & Segmentation
📝
30 Questions
⏱️
5,500 words
Identify high-potential prescribers with AI-powered lookalike modeling, calculate physician lifetime value in real-time, and dynamically adjust segmentation as market conditions change. Find opportunities before competitors while optimizing targeting continuously—without manual deciling or static segment updates.
Critical Capabilities:
High-potential identification (AI-powered scoring)
Lookalike modeling (predictive targeting)
Prescriber LTV calculation (real-time updates)
Dynamic micro-segmentation (adaptive)
Acquisition optimization (prescriber journey)
⚡
Two Powerful Approaches to Analytics Transformation
⚡ Two Powerful Approaches to Analytics Transformation
Combine conversational interfaces for instant answers with agentic intelligence that works proactively—solving both immediate needs and long-term efficiency.

Conversational Analytics & AI Foundations
📝
25 Questions
⏱️
4,500 words
The foundation: Ask questions in plain English and get instant answers. Conversational interfaces democratize data access, automated root cause analysis explains why metrics moved, and predictive models forecast future performance. Essential AI capabilities that transform static dashboards into interactive intelligence.
Foundational AI Capabilities:
Conversational analytics (natural language queries)
Automated root cause analysis (driver decomposition)
Predictive modeling (prescription trend forecasting)
Machine learning (segmentation & targeting)
Unified data integration (IQVIA, CRM, claims, digital)

Agentic Analytics: AI Agents That Work 24/7
📝
25 Questions
⏱️
4,500 words
The evolution: AI agents work continuously 24/7—monitoring your business, automatically investigating anomalies, and proactively alerting you to risks and opportunities before you ask. Move from asking questions to receiving answers you didn't know you needed. This is what separates reactive analytics from agentic intelligence.
Agentic Capabilities:
24/7 monitoring (continuous surveillance)
Automatic anomaly investigation (self-initiated RCA)
Proactive risk alerts (before revenue impact)
Self-optimizing workflows (adaptive intelligence)
Automated business narratives (review generation)
Platform & Technology Questions
Understanding Pharma Intelligence and agentic analytics at the platform level
What is agentic analytics for pharmaceutical commercial operations
Agentic analytics represents the evolution from reactive reporting to proactive intelligence. Unlike traditional analytics where users must ask questions and wait for answers, agentic analytics deploys AI agents that work continuously—monitoring your business 24/7, automatically investigating anomalies, and proactively alerting you to risks and opportunities before you ask. In pharmaceutical commercial operations, this means AI agents track hundreds of metrics across brand performance, field execution, market access, and HCP engagement simultaneously. When meaningful changes occur—like a TRx decline, formulary restriction, or prescriber disengagement—agents automatically perform root cause analysis and deliver specific, actionable recommendations with full context.
How does Pharma Intelligence unify data across commercial functions?
Pharma Intelligence automatically integrates data from IQVIA (prescription trends, market share), Symphony (claims data), CRM systems (Veeva, Salesforce for field activity), payer databases (formulary status, prior auth rates), competitive intelligence, and internal systems. The platform creates a unified semantic layer that harmonizes these disparate sources, resolving HCP identities, aligning geographies, and standardizing metrics. This means field teams, brand managers, market access leaders, and contracting teams all work from the same single source of truth. When an AI agent detects a TRx decline, it can instantly correlate field activity, payer changes, competitive moves, and HCP prescribing patterns—insights impossible when data sits in silos.
What's the difference between AI analytics and agentic analytics?
AI analytics provides conversational interfaces and automated insights—you ask "Why did NBRx decline?" and get instant answers with root cause analysis. This is valuable and represents a major improvement over traditional BI. Agentic analytics goes further: AI agents work autonomously without human prompting. They continuously monitor your business, automatically detect meaningful changes, investigate root causes on their own, and proactively send you alerts with recommendations. Think of it as the difference between having a very smart assistant who answers your questions (AI analytics) versus having a team of analysts working 24/7 who investigate issues and bring you insights before you know to ask (agentic analytics). Most organizations need both layers working together.
What ROI can we expect from deploying agentic analytics?
Typical pharmaceutical companies see $10-17M in annual value creation per brand with 6-9 month payback periods and 1,700%+ first-year ROI. Value comes from four areas: analyst time savings (70-85% reduction, ~$645K annually), proactive issue detection (catching formulary changes, prescriber churn, access barriers 2-4 weeks earlier saves $3-4M), AI-identified opportunities (underserved segments, high-potential HCPs, contract optimization worth $5-10M), and improved forecasting accuracy ($2-3M in better resource allocation). Beyond quantifiable ROI, organizations report dramatically improved executive satisfaction, faster business reviews (2 weeks to 2 days), and field teams spending time selling instead of preparing reports. The platform essentially pays for itself within the first quarter through time savings alone.
How do AI agents work across field force, brand, and market access?
AI agents operate across all commercial functions simultaneously, detecting insights that span multiple teams. For example: an agent monitoring market access detects Aetna added step therapy requirements affecting 8,200 covered lives. It automatically investigates the brand impact (estimated -$2.3M TRx), identifies affected territories and HCPs, analyzes which field reps need to adjust messaging, and calculates the patient support program implications. Within minutes, the agent sends coordinated alerts to market access (escalate with payer), brand team (update forecasts), field leadership (prioritize affected HCPs), and patient services (expect abandonment increase). This cross-functional intelligence—impossible with siloed tools—enables coordinated responses that protect revenue.
How long does deployment take and what resources are needed?
Typical deployment takes 6-12 weeks from kickoff to full production. Week 1-3: Data integration (IQVIA, CRM, claims, payer sources). Week 4-6: Semantic layer configuration and pharma-specific metric definitions. Week 7-9: Agent deployment, alert configuration, and user training. Week 10-12: Optimization and rollout. Required resources: Executive sponsor (5% time), 2-3 business analysts (50% time during deployment), IT liaison (25% time for data access), and key business users for UAT. Post-deployment, platform is largely self-operating—AI agents handle monitoring and investigation automatically. Most organizations need only 1-2 FTEs for ongoing administration, far less than traditional BI platforms that require constant analyst support.
How does this compare to traditional pharma analytics platforms?
Traditional platforms (Tableau, Power BI, Qlik) require users to build dashboards, write SQL, and manually investigate every question. Pharma-specific platforms (IQVIA OCE, Veeva CRM Analytics) provide pre-built reports but still require manual analysis. Neither offers AI agents that work autonomously. With agentic analytics, AI agents continuously monitor and investigate automatically—no dashboard building, no SQL, no waiting. Conversational interfaces let anyone ask questions in plain English. Root cause analysis happens instantly, not in 3-5 days. Business reviews generate automatically. Most importantly: you receive insights proactively before issues impact revenue, rather than discovering problems in retrospective reports. Organizations typically keep existing platforms for specific use cases while Pharma Intelligence becomes the primary decision intelligence layer.
How Agentic Analytics Transforms Your Workflow
How Agentic Analytics Transforms Your Workflow
Unified Data Integration
Automatically connect and harmonize data from IQVIA, Symphony, CRM (Veeva, Salesforce), claims databases, competitive intelligence, and internal systems. No more manual data pulls or Excel wrestling.
Ask Questions in Plain English
Conversational analytics lets anyone ask questions like "Why did NBRx decline in the Northeast last month?" and receive instant answers with automated driver analysis. No SQL, no waiting for reports.
Deploy AI Agents
Agentic analytics agents work 24/7—continuously monitoring hundreds of metrics across all dimensions. When meaningful changes occur, agents automatically investigate root causes, quantify business impact, and send prioritized alerts with specific, actionable recommendations. No human prompting required.
Receive Proactive Insights & Recommendations
Get specific, prioritized alerts with context and next steps: "Prior auth denials increased 18% with Aetna in Q3. Estimated TRx impact: -$2.3M. Root cause: New step therapy requirement. Recommend: Escalate to market access team within 48 hours, review formulary status across all major payers." Know what to do, not just what happened.
Jump to Your Specific Challenge
AI agents answer your questions across three levels: foundational understanding, agentic capabilities, and business impact measurement.
🎯
Understanding Challenges & Best Practices
🎯 Understanding Challenges & Best Practices
🤖
AI Agents & Agentic Capabilities
🤖 AI Agents & Agentic Capabilities
💰
Platform Evaluation & Business Impact
💰 Platform Evaluation & Business Impact
Real Results from Deploying Agentic Analytics
How AI agents deliver measurable business impact across pharmaceutical commercial operations
Top 10 Pharma — Oncology Brand
85% reduction in monthly review prep with automated business narratives
AI agents identified $12M opportunity in underserved community oncology
Proactive formulary alerts detected risk 3 weeks earlier, saved $8M
ROI: 2,200% in first year with agentic monitoring
Specialty Pharma — Neurology
Analyst team reduced from 4 FTEs to 2 with agentic automation
15% NBRx improvement through AI-optimized HCP targeting
Agentic anomaly detection prevents $3-5M revenue loss annually
Payback period: 7 months from agent deployment
Mid-Size Pharma — Cardiovascular
AI agents generate weekly reviews in 2 hours vs. 2 days
Root cause analysis: instant vs. 3-5 days of manual investigation
Agents found $18M in hidden payer contract optimization opportunities
Executive satisfaction: 4.2 → 9.1/10 with agentic insights
Calculate Your ROI from Agentic Analytics
See what you could save by deploying AI agents across your commercial operations
Typical ROI from Agentic Analytics Deployment
Value from AI agents: Analyst time savings ($645K), proactive issue detection ($3-4M), AI-identified opportunities ($5-10M), improved forecasting ($2-3M), 24/7 monitoring & investigation (at fraction of human cost)
Ready to Deploy Agentic Analytics?
Join leading pharma companies using AI agents to monitor 24/7, investigate automatically, and deliver proactive insights—reducing analysis time by 70-85% while protecting millions in revenue.
Explore Agentic Analytics Resources
What is Agentic Analytics?
Complete Technology Guide
Customer Success Stories
Real Results from Agent Deployment
Pharma Intelligence Platform
Unified Decision Intelligence
Expert Webinars
Live Agentic Analytic Demos