Always-On Intelligence to Maximize Financial Performance
Finance teams sit on ERP, planning, CRM, and operational data, but basic questions still turn into analyst queues, spreadsheet debates, and slow root-cause work. AI analytics changes the operating model. Instead of "build a report, then interpret it," teams can ask questions in plain English, get governed answers tied to approved definitions, and run consistent investigations that explain why performance moved across cost center, product, region, channel, and business unit.
What is AI Analytics for Finance?
AI analytics applies AI, machine learning, and natural language processing to make analytics faster, explainable, and easier to use—so teams can get answers without translating every question into SQL or rebuilding one-off dashboards. For FP&A and finance teams, AI analytics means asking questions about EBITDA, revenue variance, OpEx performance, and budget vs. actual in plain English, getting answers using governed metrics and approved hierarchies, automating "what changed and why" with repeatable root-cause logic, and monitoring key metrics continuously so variances and risks surface early.
Unlike traditional BI tools that show what happened but leave teams to investigate why manually, AI analytics automates driver decomposition, generates plain-English explanations, and alerts finance leaders to issues before monthly close.
Tellius is an AI analytics platform purpose-built for FP&A and finance operations, combining conversational interfaces for instant answers with agentic intelligence that works continuously.
The Problem
Why Analytics Keeps Failing FP&A Teams
Why Analytics Keeps Failing FP&A Teams

Simple questions about EBITDA drivers or cost center performance trigger analyst tickets that sit in queues. By the time the analysis arrives, the board meeting passed or the CFO already made a decision based on incomplete data.
Marketing defines revenue one way. Sales calculates it differently. Finance has a third version. Meetings waste time reconciling spreadsheets instead of making decisions about what to do next.
EBITDA dropped 5% and the dashboard confirms it. Figuring out whether it was pricing pressure, volume decline, mix shift, or OpEx overrun still requires days of manual Excel investigation.
Only technical users can explore data while everyone else waits. Business partners who need cost analysis can't build joins. Department heads who need budget comparisons depend entirely on analyst availability.
Critical variances surface weeks late because monitoring is manual and reactive. Cost center overruns, revenue shortfalls, and margin compression happen gradually. But teams only discover problems during monthly reviews when intervention windows have closed.

Instant answers + proactive alerts for Finance & FP&A teams

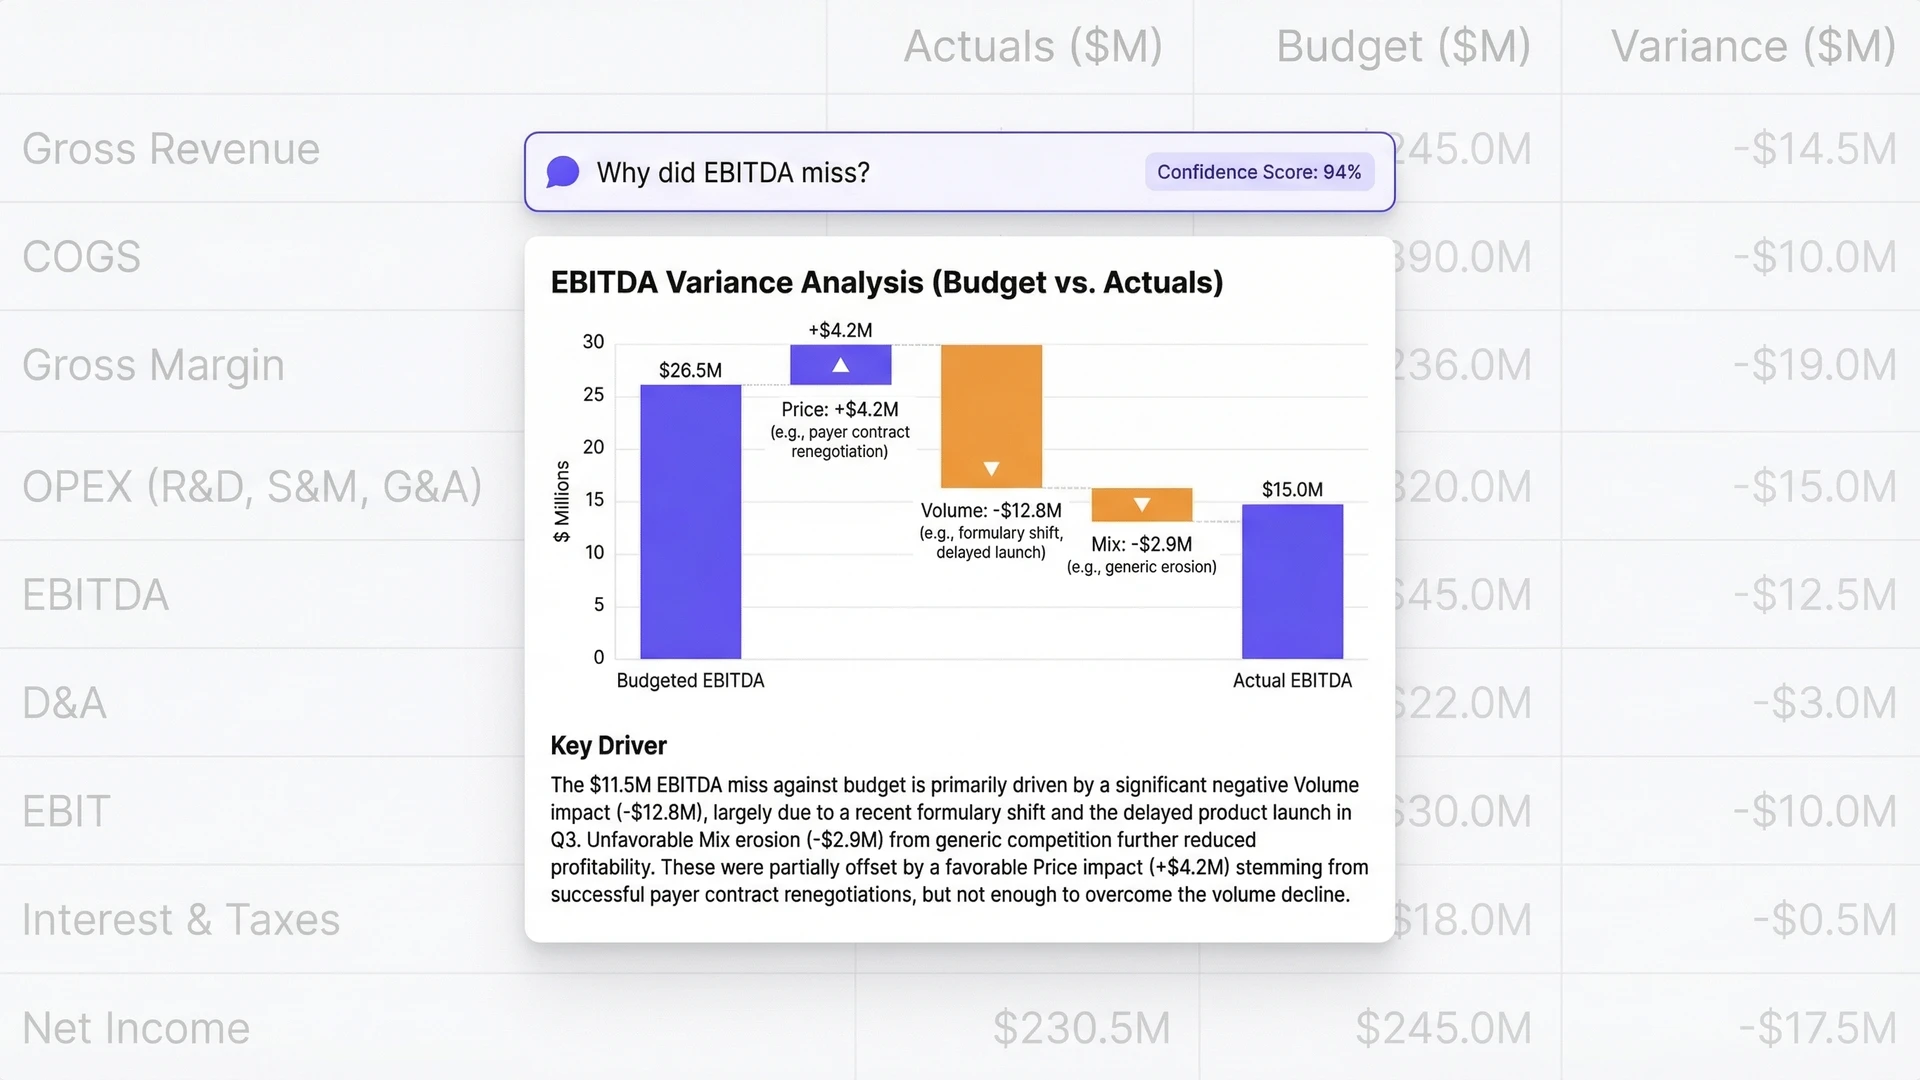
CFOs, FP&A analysts, and business partners can ask complex questions in plain English. The system translates to approved definitions, runs analysis, and returns explanations in seconds. Conversational analytics: Ask "Why is EBITDA 5% below forecast?" and get driver attribution ranked by impact—no analyst queue, no Excel pivot tables.
EBITDA swings 5% and you can know which cost centers, products, and regions drove it before the CFO asks. Automated analysis decomposes the change and ranks drivers by contribution. Automated root cause: AI tests all possible drivers simultaneously and quantifies each one's contribution—what took 3-5 days now takes seconds.
One semantic layer means revenue, EBITDA, and cost center hierarchies mean the same thing everywhere. Same question always produces the same answer across finance, operations, and leadership teams. Single source of truth: Governed definitions eliminate the "five analysts, five different numbers" problem that plagues monthly close.
AI agents watch metrics around the clock without human initiation. They detect meaningful variances, investigate automatically, and deliver explanations before your weekly review starts. Proactive monitoring: Catch budget overruns 4-6 weeks before quarterly reviews, when intervention is still possible—not after the damage compounds.
Every answer includes the data used, methods applied, and confidence level. Users can drill down to verify findings. In regulated finance environments, auditability is non-negotiable. Explainable AI: Every variance explanation traces back to source data, ensuring governance and compliance across all reporting cycles.
The results
The ROI Behind Faster Finance Decisions
40
%
10x
70%
$5M
Why tellius
How AI Analytics Changes Finance

Unify
Connect ERP, planning tools, CRM, and operational data through a governed semantic layer that encodes finance business logic. One truth instead of five competing versions from NetSuite, SAP, Anaplan, and departmental spreadsheets.

Explain
Ask questions in plain English and get instant answers with automated root cause analysis. Know why metrics moved across cost center, product, region, and business unit—not just what changed.

Act
Deploy AI agents that monitor continuously, investigate automatically, and deliver decision-ready briefs before your monthly close. Catch problems in days instead of quarters.
"Tellius agents catch budget overruns 4-6 weeks before our quarterly reviews, giving us time to course-correct instead of just explaining what went wrong. The shift from reactive reporting to proactive intelligence has been transformative for our finance team."

Ready to Deploy Agentic Finance Intelligence?
Join leading finance teams using AI agents to monitor 24/7, investigate automatically, and catch budget risks 4-6 weeks earlier—shifting from reactive reporting to proactive intelligence.
Continue the journey
Dig into our latest content related to agentic finance intelligence
.webp)
Best FP&A Software in 2026: The Tools That Plan, and the Layer That Explains Why
Modern FP&A teams need more than planning software—they need the ability to explain financial performance, identify the drivers behind change, and act faster on emerging risks and opportunities. This buyer's guide compares the leading FP&A platforms in 2026 across budgeting, forecasting, scenario modeling, financial consolidation, reporting, AI-assisted planning, and enterprise analytics. It also introduces a new evaluation framework: distinguishing the systems that plan from the intelligence layer that explains why.
.webp)
14 Best AI Tools for Finance Teams in 2026 | Comparison Guide
AI is rapidly reshaping how finance teams plan, analyze, and report on business performance. This guide compares 14 of the best AI tools for finance teams in 2026, covering platforms for financial analysis, forecasting, reporting, and automated insights. It explains how modern AI tools help finance professionals move beyond spreadsheets and manual reporting by automating data integration, uncovering drivers behind financial performance, and generating faster forecasts and variance explanations. The article also provides a practical framework for evaluating finance AI tools—highlighting which platforms are best for FP&A, financial analysis, operational planning, and executive reporting in today’s AI-driven finance stack.
What Is AI-Powered Financial Analytics? 2026 Guide
AI-powered financial analytics is transforming how finance teams analyze performance, forecast outcomes, and explain business results. Instead of relying on manual spreadsheets and static dashboards, modern AI analytics platforms use machine learning, natural language interfaces, and automated analysis to uncover the drivers behind financial metrics in seconds. This guide explains how AI-powered financial analytics works, the core technologies behind it, and how finance teams use it for tasks like variance analysis, forecasting, anomaly detection, and executive reporting. It also explores how AI shifts finance from reactive reporting to proactive, insight-driven decision-making by automatically identifying trends, investigating root causes, and generating clear explanations of what’s impacting business performance.

Heading
Heading 1
Heading 2
Heading 3
Heading 4
Heading 5
Heading 6
Lorem ipsum dolor sit amet, consectetur adipiscing elit, sed do eiusmod tempor incididunt ut labore et dolore magna aliqua. Ut enim ad minim veniam, quis nostrud exercitation ullamco laboris nisi ut aliquip ex ea commodo consequat. Duis aute irure dolor in reprehenderit in voluptate velit esse cillum dolore eu fugiat nulla pariatur.
Block quote
Ordered list
- Item 1
- Item 2
- Item 3
Unordered list
- Item A
- Item B
- Item C
Bold text
Emphasis
Superscript
Subscript
The Challenge Every Pharma Commercial Leader Faces
You're drowning in data from IQVIA, claims databases, CRM systems, and competitive intelligence platforms—yet when executives ask "Why did our numbers change?" the answer is always: "We'll need a few days to investigate."
The Problem Isn't Lack of Data — It's Lack of Insights
Traditional dashboards show what happened, not why
Root cause analysis takes days or weeks of manual investigation
Non-technical users can't explore data without submitting IT requests
Insights arrive too late to prevent revenue loss
Multiple tools and data sources create fragmented views
Field teams spend 40% of their time preparing reports instead of selling
Agentic Analytics Changes Everything
Deploy AI agents that work 24/7—continuously monitoring your business, automatically investigating changes, and proactively alerting you to risks and opportunities. From weeks of manual analysis to seconds of AI-generated insights. From reactive reporting to agentic intelligence. From data silos to unified, self-operating analytics.
Introducing Pharma Intelligence
Unified decision intelligence across your entire commercial operation
Pharma teams depend on fast, accurate insights across HCP targeting, field execution, market access, contracting, brand growth, patient services, and incentive compensation. Pharma Intelligence brings all these capabilities together—powered by AI analytics and agentic workflows—to help organizations unify data, explain performance, detect risks, and drive next-best actions across every commercial function.
📊 Analytics Solutions for Every Commercial Function
📊
Analytics Solutions for Every Commercial Function
Each hub addresses critical challenges with unified data, instant root cause analysis, and AI-powered insights. Choose your area to explore how we solve your specific pain points.

Field Force Sales Effectiveness
📝
34 Questions
⏱️
6,000 words
Pharma teams depend on fast, accurate insights across HCP targeting, field execution, market access, contracting, brand growth, patient services, and incentive compensation. Pharma Intelligence brings all these capabilities together—powered by AI analytics and agentic workflows—to help organizations unify data, explain performance, detect risks, and drive next-best actions across every commercial function.
Critical Capabilities:
HCP targeting & segmentation (AI-powered scoring)
Territory performance vs. potential (real-time)
Call quality & message effectiveness (NLP analysis)
Prescriber churn prediction (early warning alerts)
Pre-call planning (automated contextual briefs)

Brand Performance & KPIs
📝
31 Questions
⏱️
6,500 words
Transform business reviews and root cause analysis with instant TRx/NBRx explanations, automated market share decomposition, and complete narrative generation. Uncover hidden opportunities worth millions while reducing prep time from 2 weeks to 2 days—eliminating the endless Excel work and manual investigation cycle.
Critical Capabilities:
TRx/NBRx anomaly detection & auto-explanation
Market share decomposition (instant driver analysis)
Root cause analysis (multi-variable, seconds not days)
Business review automation (narrative + visuals)
Competitive intelligence (continuous tracking)

Market Access Performance
📝
30 Questions
⏱️
5,500 words
Track formulary changes, prior auth approval rates, and payer mix shifts with unified access intelligence—identifying exactly where coverage restrictions cost you scripts before they impact revenue. Get automated alerts on formulary movements, access barriers, and abandonment patterns with recommended interventions.
Critical Capabilities:
Formulary impact alerts (position change detection)
Prior authorization tracking (approval rate trends)
Payer mix dynamics (coverage shift analysis)
Abandonment prediction (access barrier identification)
Copay program ROI (effectiveness measurement)

Contracting & Payer Strategy
📝
30 Questions
⏱️
5,500 words
Optimize contract performance with unified tracking of rebate effectiveness, volume commitments, and ROI across all payer agreements. Model negotiation scenarios, measure contract impact in real-time, and identify which agreements deliver value and which underperform—with recommended actions before renewals.
Critical Capabilities:
Performance vs. expectations (continuous tracking)
Rebate effectiveness (automated optimization)
Scenario modeling (what-if negotiations)
Gross-to-net decomposition (contract-level)
Value-based outcomes (automated tracking)

HCP Targeting & Segmentation
📝
30 Questions
⏱️
5,500 words
Identify high-potential prescribers with AI-powered lookalike modeling, calculate physician lifetime value in real-time, and dynamically adjust segmentation as market conditions change. Find opportunities before competitors while optimizing targeting continuously—without manual deciling or static segment updates.
Critical Capabilities:
High-potential identification (AI-powered scoring)
Lookalike modeling (predictive targeting)
Prescriber LTV calculation (real-time updates)
Dynamic micro-segmentation (adaptive)
Acquisition optimization (prescriber journey)
⚡
Two Powerful Approaches to Analytics Transformation
⚡ Two Powerful Approaches to Analytics Transformation
Combine conversational interfaces for instant answers with agentic intelligence that works proactively—solving both immediate needs and long-term efficiency.

Conversational Analytics & AI Foundations
📝
25 Questions
⏱️
4,500 words
The foundation: Ask questions in plain English and get instant answers. Conversational interfaces democratize data access, automated root cause analysis explains why metrics moved, and predictive models forecast future performance. Essential AI capabilities that transform static dashboards into interactive intelligence.
Foundational AI Capabilities:
Conversational analytics (natural language queries)
Automated root cause analysis (driver decomposition)
Predictive modeling (prescription trend forecasting)
Machine learning (segmentation & targeting)
Unified data integration (IQVIA, CRM, claims, digital)

Agentic Analytics: AI Agents That Work 24/7
📝
25 Questions
⏱️
4,500 words
The evolution: AI agents work continuously 24/7—monitoring your business, automatically investigating anomalies, and proactively alerting you to risks and opportunities before you ask. Move from asking questions to receiving answers you didn't know you needed. This is what separates reactive analytics from agentic intelligence.
Agentic Capabilities:
24/7 monitoring (continuous surveillance)
Automatic anomaly investigation (self-initiated RCA)
Proactive risk alerts (before revenue impact)
Self-optimizing workflows (adaptive intelligence)
Automated business narratives (review generation)
Platform & Technology Questions
Understanding Pharma Intelligence and agentic analytics at the platform level
What is agentic analytics for pharmaceutical commercial operations
Agentic analytics represents the evolution from reactive reporting to proactive intelligence. Unlike traditional analytics where users must ask questions and wait for answers, agentic analytics deploys AI agents that work continuously—monitoring your business 24/7, automatically investigating anomalies, and proactively alerting you to risks and opportunities before you ask. In pharmaceutical commercial operations, this means AI agents track hundreds of metrics across brand performance, field execution, market access, and HCP engagement simultaneously. When meaningful changes occur—like a TRx decline, formulary restriction, or prescriber disengagement—agents automatically perform root cause analysis and deliver specific, actionable recommendations with full context.
How does Pharma Intelligence unify data across commercial functions?
Pharma Intelligence automatically integrates data from IQVIA (prescription trends, market share), Symphony (claims data), CRM systems (Veeva, Salesforce for field activity), payer databases (formulary status, prior auth rates), competitive intelligence, and internal systems. The platform creates a unified semantic layer that harmonizes these disparate sources, resolving HCP identities, aligning geographies, and standardizing metrics. This means field teams, brand managers, market access leaders, and contracting teams all work from the same single source of truth. When an AI agent detects a TRx decline, it can instantly correlate field activity, payer changes, competitive moves, and HCP prescribing patterns—insights impossible when data sits in silos.
What's the difference between AI analytics and agentic analytics?
AI analytics provides conversational interfaces and automated insights—you ask "Why did NBRx decline?" and get instant answers with root cause analysis. This is valuable and represents a major improvement over traditional BI. Agentic analytics goes further: AI agents work autonomously without human prompting. They continuously monitor your business, automatically detect meaningful changes, investigate root causes on their own, and proactively send you alerts with recommendations. Think of it as the difference between having a very smart assistant who answers your questions (AI analytics) versus having a team of analysts working 24/7 who investigate issues and bring you insights before you know to ask (agentic analytics). Most organizations need both layers working together.
What ROI can we expect from deploying agentic analytics?
Typical pharmaceutical companies see $10-17M in annual value creation per brand with 6-9 month payback periods and 1,700%+ first-year ROI. Value comes from four areas: analyst time savings (70-85% reduction, ~$645K annually), proactive issue detection (catching formulary changes, prescriber churn, access barriers 2-4 weeks earlier saves $3-4M), AI-identified opportunities (underserved segments, high-potential HCPs, contract optimization worth $5-10M), and improved forecasting accuracy ($2-3M in better resource allocation). Beyond quantifiable ROI, organizations report dramatically improved executive satisfaction, faster business reviews (2 weeks to 2 days), and field teams spending time selling instead of preparing reports. The platform essentially pays for itself within the first quarter through time savings alone.
How do AI agents work across field force, brand, and market access?
AI agents operate across all commercial functions simultaneously, detecting insights that span multiple teams. For example: an agent monitoring market access detects Aetna added step therapy requirements affecting 8,200 covered lives. It automatically investigates the brand impact (estimated -$2.3M TRx), identifies affected territories and HCPs, analyzes which field reps need to adjust messaging, and calculates the patient support program implications. Within minutes, the agent sends coordinated alerts to market access (escalate with payer), brand team (update forecasts), field leadership (prioritize affected HCPs), and patient services (expect abandonment increase). This cross-functional intelligence—impossible with siloed tools—enables coordinated responses that protect revenue.
How long does deployment take and what resources are needed?
Typical deployment takes 6-12 weeks from kickoff to full production. Week 1-3: Data integration (IQVIA, CRM, claims, payer sources). Week 4-6: Semantic layer configuration and pharma-specific metric definitions. Week 7-9: Agent deployment, alert configuration, and user training. Week 10-12: Optimization and rollout. Required resources: Executive sponsor (5% time), 2-3 business analysts (50% time during deployment), IT liaison (25% time for data access), and key business users for UAT. Post-deployment, platform is largely self-operating—AI agents handle monitoring and investigation automatically. Most organizations need only 1-2 FTEs for ongoing administration, far less than traditional BI platforms that require constant analyst support.
How does this compare to traditional pharma analytics platforms?
Traditional platforms (Tableau, Power BI, Qlik) require users to build dashboards, write SQL, and manually investigate every question. Pharma-specific platforms (IQVIA OCE, Veeva CRM Analytics) provide pre-built reports but still require manual analysis. Neither offers AI agents that work autonomously. With agentic analytics, AI agents continuously monitor and investigate automatically—no dashboard building, no SQL, no waiting. Conversational interfaces let anyone ask questions in plain English. Root cause analysis happens instantly, not in 3-5 days. Business reviews generate automatically. Most importantly: you receive insights proactively before issues impact revenue, rather than discovering problems in retrospective reports. Organizations typically keep existing platforms for specific use cases while Pharma Intelligence becomes the primary decision intelligence layer.
How Agentic Analytics Transforms Your Workflow
How Agentic Analytics Transforms Your Workflow
Unified Data Integration
Automatically connect and harmonize data from IQVIA, Symphony, CRM (Veeva, Salesforce), claims databases, competitive intelligence, and internal systems. No more manual data pulls or Excel wrestling.
Ask Questions in Plain English
Conversational analytics lets anyone ask questions like "Why did NBRx decline in the Northeast last month?" and receive instant answers with automated driver analysis. No SQL, no waiting for reports.
Deploy AI Agents
Agentic analytics agents work 24/7—continuously monitoring hundreds of metrics across all dimensions. When meaningful changes occur, agents automatically investigate root causes, quantify business impact, and send prioritized alerts with specific, actionable recommendations. No human prompting required.
Receive Proactive Insights & Recommendations
Get specific, prioritized alerts with context and next steps: "Prior auth denials increased 18% with Aetna in Q3. Estimated TRx impact: -$2.3M. Root cause: New step therapy requirement. Recommend: Escalate to market access team within 48 hours, review formulary status across all major payers." Know what to do, not just what happened.
Jump to Your Specific Challenge
AI agents answer your questions across three levels: foundational understanding, agentic capabilities, and business impact measurement.
🎯
Understanding Challenges & Best Practices
🎯 Understanding Challenges & Best Practices
🤖
AI Agents & Agentic Capabilities
🤖 AI Agents & Agentic Capabilities
💰
Platform Evaluation & Business Impact
💰 Platform Evaluation & Business Impact
Real Results from Deploying Agentic Analytics
How AI agents deliver measurable business impact across pharmaceutical commercial operations
Top 10 Pharma — Oncology Brand
85% reduction in monthly review prep with automated business narratives
AI agents identified $12M opportunity in underserved community oncology
Proactive formulary alerts detected risk 3 weeks earlier, saved $8M
ROI: 2,200% in first year with agentic monitoring
Specialty Pharma — Neurology
Analyst team reduced from 4 FTEs to 2 with agentic automation
15% NBRx improvement through AI-optimized HCP targeting
Agentic anomaly detection prevents $3-5M revenue loss annually
Payback period: 7 months from agent deployment
Mid-Size Pharma — Cardiovascular
AI agents generate weekly reviews in 2 hours vs. 2 days
Root cause analysis: instant vs. 3-5 days of manual investigation
Agents found $18M in hidden payer contract optimization opportunities
Executive satisfaction: 4.2 → 9.1/10 with agentic insights
Calculate Your ROI from Agentic Analytics
See what you could save by deploying AI agents across your commercial operations
Typical ROI from Agentic Analytics Deployment
Value from AI agents: Analyst time savings ($645K), proactive issue detection ($3-4M), AI-identified opportunities ($5-10M), improved forecasting ($2-3M), 24/7 monitoring & investigation (at fraction of human cost)
Ready to Deploy Agentic Analytics?
Join leading pharma companies using AI agents to monitor 24/7, investigate automatically, and deliver proactive insights—reducing analysis time by 70-85% while protecting millions in revenue.
Explore Agentic Analytics Resources
What is Agentic Analytics?
Complete Technology Guide
Customer Success Stories
Real Results from Agent Deployment
Pharma Intelligence Platform
Unified Decision Intelligence
Expert Webinars
Live Agentic Analytic Demos