From Manual Slide-Writing to Automated Executive Narratives
Traditional finance reporting shows numbers in PowerPoint. AI-powered commentary generation turns variance analysis into executive summaries automatically. Finance teams spend days writing management commentary for board decks and business reviews—explaining the same numbers analysts already investigated. Leadership wants business context, not raw data. This guide walks through how AI transforms management commentary and executive reporting for finance teams.
What is AI-Powered Financial Reporting?
AI-powered management commentary generation and automated reporting uses natural language processing to convert financial analysis into plain-English executive summaries automatically. Instead of manually writing board deck commentary, monthly business review narratives, and EBITDA explanations from scratch, AI generates first-draft management commentary from variance analysis results—explaining why EBITDA moved, which drivers contributed, and what actions are recommended.
Unlike manual narrative writing where analysts spend days crafting PowerPoint commentary from scratch, AI-powered management commentary converts quantified variance drivers into executive prose in seconds—structuring explanations consistently and ensuring the same drivers produce the same narrative format across all business units. Tellius is an AI-powered management reporting platform purpose-built for finance—combining conversational analytics for instant answers and agentic analytics for automated commentary generation.
The Problem
Finance leaders spend days writing commentary that explains analysis already completed
need subhead?
Finance leaders operate without consistent commentary, audit trails, or automated narrative generation

Analysts investigate variances all week, then leaders write PowerPoint slides the next week—duplicating work between analysis and storytelling.
Dashboards show "EBITDA down 5%" but nobody explains which cost centers drove it—so leaders write commentary from scratch every cycle.
Three leaders present the same variance, three different stories emerge—because commentary creation is manual, subjective, and format-free.
CFOs answer "why over budget?" verbally because written summaries take 3+ hours to prepare—leaving no documentation or audit trail.
Close takes 14 days because Week 1 is variance hunting and Week 2 is slide-writing—when both should happen simultaneously.
Board presentations stay surface-level because time pressure forces "revenue declined 10%" instead of "revenue declined 10%: 60% Product A, 40% timing" explanations.

What good automated executive reporting looks like

Automated commentary generation: AI converts variance analysis into plain-English executive summaries ready for leadership review.
First-draft summaries: AI generates EBITDA commentary, margin explanations, and performance summaries automatically.
Consistent storytelling: Same variance data produces same commentary structure across all business units and time periods.
Instant executive summaries: Ask "Explain EBITDA performance" and get board-ready commentary in seconds.
Compressed close cycles: Variance investigation and commentary generation happen simultaneously—reducing total cycle time by 50-70%.
Comprehensive commentary: AI generates multi-level explanations—headline summary plus detailed driver decomposition.
The results
The payoff from automating close commentary & reporting
14 → 2
days
10x faster
100%
.svg)
2+
Why tellius
How AI Transforms Management Reporting

Unify
Variance analysis results, driver decomposition, and root cause explanations automatically feed into commentary generation—no manual data transfer required.

Explain
AI converts quantified variance drivers into plain-English management commentary: "EBITDA declined 5% primarily due to higher Sales & Marketing OpEx (60% contribution), driven by unplanned headcount additions."

Act
Automated commentary generation produces board-ready summaries for monthly reviews, quarterly presentations, and ad-hoc leadership questions in seconds instead of hours.
Questions & Answers
Real Questions from Finance Leaders
Below, we've organized real questions from finance leaders about management commentary and reporting into three parts. Every answer is grounded in actual executive reporting challenges.
Part 1: Management Reporting Fundamentals
1. How can I use AI for financial reporting?
AI transforms financial reporting by automating the mechanical work between variance analysis and executive communication—specifically narrative generation, driver explanation, and multi-audience report assembly.
For variance-to-commentary translation, when variance analysis identifies "EBITDA declined 5%, driven 60% by Sales & Marketing OpEx and 40% by revenue timing," AI converts this into executive prose: "EBITDA of $12.5M came in 5% below plan, driven primarily by higher Sales & Marketing spending (60% contribution) from accelerated hiring, with additional impact from enterprise deal delays (40%). Full-year guidance maintained based on Q1 pipeline conversion expectations."
For multi-level summary generation, AI produces three versions from one analysis. The executive summary for the CFO runs 3 sentences, operational detail for business partners spans 2 paragraphs with cost center breakout, and strategic context for the board is outcome-focused and forward-looking. Each version emphasizes different aspects of the same underlying variance drivers.
For report assembly from templates, once you define preferred structure following a headline-to-drivers-to-context-to-outlook flow, AI applies this consistently across monthly close, quarterly reviews, and ad-hoc requests. Same variance produces same narrative format every cycle—eliminating the "three analysts, three different stories" problem.
What AI doesn't replace includes strategic judgment on messaging and tone, forward-looking guidance based on pipeline and market intelligence, risk assessment and mitigation recommendations, and board-specific context that requires executive judgment. The practical split is that AI handles "what happened and why" (mechanical, quantified, repeatable) while CFOs handle "what it means and what we're doing about it" (strategic, contextual, judgment-based). This shifts reporting prep from 14 days (10 days mechanical, 4 days strategic) to 4 days (1 day mechanical via AI, 3 days strategic refinement).
2. What should be included in a board finance presentation?
A board finance presentation typically includes three categories of content: financial performance, operational metrics, and strategic context.
Financial performance covers revenue, EBITDA, and net income compared against budget and prior year, along with key variance drivers and explanations, margin trends and profitability analysis, and cash flow and liquidity position. Operational metrics include customer acquisition, retention, and churn rates, unit economics and efficiency metrics, headcount and OpEx trends, and capital allocation and CAPEX priorities. Strategic context addresses market conditions and competitive dynamics, risk factors and mitigation plans, investment priorities and tradeoffs, and forward-looking guidance and scenarios.
The challenge is balancing depth and brevity—boards want business context, not raw data dumps. Traditional presentations require extensive manual writing to explain why performance changed and what it means strategically.
AI-powered narrative generation automates this storytelling, converting variance drivers into plain-English explanations like "EBITDA declined 5% due to higher Sales & Marketing OpEx (60% contribution), driven by accelerated hiring to support new product launch with estimated 6-9 month payback based on pipeline growth."
3. How do CFOs explain financial performance to the board?
CFOs explain financial performance through structured narratives that connect numbers to business drivers.
The traditional approach involves presenting headline numbers like revenue, EBITDA, and EPS, showing variance charts comparing actual versus budget, manually writing commentary explaining why performance differed, highlighting key risks and opportunities, and providing forward-looking guidance. This requires CFOs to synthesize analysis completed by FP&A teams, add strategic context, and craft a coherent story—taking days of preparation.
The AI-powered approach changes this workflow fundamentally. Variance analysis automatically identifies drivers. AI generates narrative explaining performance: "EBITDA declined 5% vs. budget primarily due to higher operating expenses (60% contribution) and revenue timing delays (25%), partially offset by favorable COGS (15%)." The CFO reviews and adds strategic context. The final narrative combines automated driver explanation with executive perspective.
The AI handles the mechanical work of quantifying drivers and structuring explanations while CFOs focus on strategic interpretation and forward-looking guidance.
4. What is a monthly business review in finance?
A monthly business review (MBR) is a recurring meeting where finance presents actual performance against budget, explains variances, updates forecasts, and discusses business trends.
MBR components typically include a performance summary covering P&L actuals versus budget and forecast, key variance drivers by segment, margin and efficiency trends, and cash flow and working capital position. Deep dives explain why specific variances occurred, provide root cause analysis on significant gaps, and connect operational drivers to financial results. The forward view includes updated forecast and guidance, risk factors and mitigation plans, and strategic initiatives and investments.
Traditional MBRs require extensive preparation—analysts investigate variances all week, then finance leaders spend days writing PowerPoint narratives. By the time the MBR happens, the cycle begins again for next month.
AI-powered MBR preparation automates this workflow. Variance analysis happens automatically as data arrives. AI generates narrative summaries of performance drivers. The CFO reviews and refines commentary instead of writing from scratch. This compresses MBR prep from 10-14 days to 2-3 days, allowing more time for forward-looking discussion instead of backward-looking explanation.
5. What are the key metrics CFOs report to the board?
Key metrics vary by industry and company stage, but typically span four categories.
Financial performance includes revenue total and by segment and by product, EBITDA and margins, operating cash flow, and EPS and diluted shares outstanding. Growth and efficiency metrics cover revenue growth rate both YoY and QoQ, customer acquisition cost (CAC), lifetime value to CAC ratio, and sales efficiency and payback periods. Balance sheet and liquidity encompasses cash and liquidity position, debt levels and covenants, working capital metrics including DSO, DPO, and inventory turns, and capital allocation across CAPEX, M&A, and buybacks. Strategic indicators include market share and competitive position, customer retention and churn, product pipeline and innovation metrics, and operational efficiency such as headcount productivity and unit economics.
The challenge isn't tracking these metrics—it's explaining why they moved. Boards want business context, not just numbers. Traditional reporting requires manual narrative writing for every significant metric change.
AI-powered narrative generation automates this explanation, producing commentary for each metric that explains drivers, quantifies contribution, and provides context.
6. What is narrative reporting in finance?
Narrative reporting in finance means explaining financial performance through written commentary, not just charts and tables. Instead of showing "Revenue declined 10%," narrative reporting explains what happened, why it happened, what it means, and what to do.
A complete narrative covers four elements. What happened: "Revenue declined $5M (10%) vs. budget." Why it happened: "Primarily driven by volume shortfall in Product A (-$3M, 60% of variance) and delayed enterprise deals in Q4 (-$2M, 40%)." What it means: "Product A volume decline reflects competitive pressure in mid-market segment. Enterprise deal delays are timing-related, expected to close in Q1." What to do: "Accelerating Product B launch to offset Product A pressure; tightening enterprise sales forecasting process."
Traditional narrative reporting requires finance teams to manually write this commentary for every significant variance—a time-intensive process that delays reporting cycles.
AI-powered narrative reporting automates this workflow. Variance analysis identifies drivers automatically. AI converts quantified drivers into plain-English explanations. Finance leaders review and add strategic context. Final narrative combines automated driver explanation with executive perspective. This shifts finance from spending 80% of time writing narratives to spending 80% of time on strategic interpretation.
7. What should management commentary include for revenue, margin, and cash flow?
A comprehensive management commentary covers four dimensions for each metric: performance, drivers, context, and outlook.
For revenue, performance means actual versus budget and forecast with variance quantified. Drivers include price, volume, mix, and timing decomposition with contribution percentages. Context addresses market conditions, competitive dynamics, and seasonality factors. Outlook covers updated forecast, risk factors, and strategic initiatives.
For margin, performance encompasses gross margin, EBITDA margin, and operating margin trends. Drivers span COGS changes, OpEx by category, and leverage or deleveraging effects. Context includes input cost inflation, efficiency programs, and investment priorities. Outlook addresses margin trajectory, mitigation plans, and profitability initiatives.
For cash flow, performance tracks operating cash flow and free cash flow versus expectations. Drivers include working capital movements such as DSO, DPO, and inventory, plus CAPEX timing. Context covers seasonal patterns, one-time items, and financing activities. Outlook addresses liquidity position, capital allocation priorities, and covenant headroom.
Traditional narrative writing requires finance teams to manually structure these explanations—often taking 2-3 days per metric to research drivers, write commentary, and validate with stakeholders. AI-powered narrative generation automates this structure, producing comprehensive explanations for revenue, margin, and cash flow simultaneously from underlying variance analysis.
8. How does financial analysis support CFO decision-making?
Financial analysis supports CFO decision-making across three time horizons: explaining past performance, informing current decisions, and predicting future outcomes.
For explaining past performance, variance analysis answers why EBITDA missed, performance attribution reveals which segments drove growth, and trend analysis shows what changed versus last quarter. For informing current decisions, projection accuracy helps determine whether to adjust the forecast, efficiency analysis identifies where to cut costs, and ROI measurement reveals which investments are paying off. For predicting future outcomes, scenario modeling explores what happens if revenue grows 10%, sensitivity analysis shows how margin responds to cost changes, and financial modeling calculates breakeven points.
Traditional financial analysis is time-intensive, requiring analysts to build Excel models, test hypotheses manually, and write findings in PowerPoint. By the time analysis is ready, CFOs are making decisions based on incomplete information or gut instinct.
AI-powered financial analysis accelerates this workflow. Variance analysis and root cause happen automatically. Scenario modeling runs in seconds instead of hours. Narratives generate instantly from analysis results. This gives CFOs access to rigorous financial analysis in real-time, enabling faster, more informed decisions.
Part 2: Automating Management Reporting
9. How do I automate board reporting for finance?
Automating board reporting requires three components working together: automated data integration, automated variance analysis, and automated narrative generation.
Automated data integration connects ERP systems for actuals, planning tools for budget, and operational systems for drivers into a unified semantic layer that ensures consistent definitions with real-time or near-real-time refresh that eliminates manual data pulls.
Automated variance analysis uses AI to identify and quantify performance drivers automatically. Root cause analysis happens without manual hypothesis testing, and driver attribution is ranked by contribution.
Automated narrative generation converts variance analysis into plain-English executive summaries where narrative structure adapts to performance drivers—whether revenue, costs, or timing—and output is board-ready commentary requiring only CFO review and strategic context.
Traditional board reporting involves Week 1 for data collection and variance investigation, Week 2 for PowerPoint assembly and narrative writing, and Week 3 for review cycles and refinement. AI-powered board reporting compresses this to Day 1-2 for data refresh and automated analysis, Day 3 for CFO review and strategic context addition, and Day 4 for final presentation assembly. This reduces board prep from 14 days to 4 days while improving narrative quality and consistency.
10. How can I reduce time spent preparing CFO presentations?
Reducing CFO presentation time requires automating mechanical work while preserving strategic content.
Traditional CFO presentation prep takes 10-16 days. Data collection consumes 2-3 days, variance analysis another 2-3 days, chart creation 1-2 days, narrative writing 3-5 days, and review and refinement 2-3 days.
AI-powered automation compresses this to 2-4 days. Data collection shifts from days to hours through automated integration with ERP and planning tools. Variance analysis moves from days to seconds with AI-powered root cause decomposition. Chart creation becomes template-based, taking minutes instead of hours. Narrative writing generates automatically from variance drivers in seconds.
What remains manual—and should remain manual—is strategic interpretation including forward-looking guidance, risk assessment and mitigation plans, and executive judgment on messaging. The shift isn't replacing finance leadership; it's freeing them from mechanical work to focus on strategic content.
Platforms like Tellius provide this automation through pre-built ERP and planning tool connectors, automated variance analysis and root cause, AI-powered narrative generation, and template-based presentation assembly.
11. What's the best way to summarize financial performance for executives?
The best executive summary follows a three-part structure: headline, driver explanation, and context with outlook.
The headline runs one sentence: "EBITDA declined 5% vs. budget, driven primarily by higher operating expenses." The driver explanation runs 2-3 sentences: "The variance was driven by Sales & Marketing OpEx 60% above plan ($2.5M), due to accelerated hiring to support new product launch. Revenue came in 2% below plan ($800K), primarily from delayed enterprise deal closures. COGS performance was favorable (+$300K), offsetting part of the OpEx overrun." Context and outlook runs 2-3 sentences: "Higher S&M spend is strategic investment with expected 6-9 month payback based on pipeline growth. Enterprise deal delays are timing-related; $600K expected to close in Q1. Full-year EBITDA guidance maintained at $45-47M based on revenue acceleration in second half."
This structure provides immediate answer (what happened), quantified explanation (why it happened), and business context (what it means). Traditional summaries often lack quantified drivers or bury key messages in dense text. AI-powered narrative generation automatically structures summaries this way—ensuring executives get clear, actionable explanations.
12. How do I convert flux analysis into a narrative summary?
Flux analysis compares period-over-period performance such as Q4 versus Q3 or 2024 versus 2023. Converting this into narrative requires explaining what changed, why it changed, and what's the trend.
What changed: "Revenue increased $5M (10%) Q4 vs. Q3." Why it changed: "Growth driven by seasonal uptick in Product A ($3M, 60% contribution) and new customer wins in Enterprise segment ($2M, 40%)." What's the trend: "Product A shows consistent Q4 seasonal pattern (average 15% sequential growth last 3 years). Enterprise new logo momentum continues—Q4 marks third consecutive quarter of acceleration."
The traditional approach calculates flux by subtracting Q3 from Q4, builds Excel models to decompose drivers, researches seasonal patterns and trends, and manually writes narrative synthesizing findings. This takes 2 days of manual work.
The AI-powered approach has the system automatically calculate flux and identify drivers. AI generates narrative: "Revenue increased $5M Q4 vs. Q3, driven by Product A seasonal strength ($3M) and Enterprise new logos ($2M). Product A performance consistent with historical Q4 pattern; Enterprise momentum continues three-quarter acceleration." The finance leader reviews and adds context. This converts flux analysis from a 2-day manual process to seconds of automated generation.
13. How can I automatically generate management commentary for monthly results?
Automatically generating management commentary requires three capabilities working together.
Automated variance analysis connects to data sources including ERP, planning, and operational systems, calculates variances automatically when close completes, and identifies and ranks drivers by contribution.
Natural language generation converts quantified drivers into plain-English sentences, structures narrative following a headline-to-drivers-to-context flow, and adapts to performance patterns whether growth or decline, revenue or costs.
Template-based customization applies CFO-defined preferred narrative style and structure, adapts templates to company-specific terminology, and ensures output matches executive communication standards.
Example automated commentary: "November EBITDA came in at $3.8M, 8% below plan ($3.2M unfavorable variance). The shortfall was driven primarily by higher Sales & Marketing OpEx ($2.0M, 62% of variance), due to accelerated hiring and conference spend. Revenue underperformance contributed $1.5M (47%), driven by enterprise deal slippage. COGS came in favorable by $300K (9% offset), reflecting improved supply chain efficiency."
This commentary generates automatically from variance analysis in seconds, providing first-draft narratives that CFOs review and refine rather than writing from scratch.
14. How do I build a board-ready financial story using AI?
Building a board-ready financial story using AI involves four steps.
Automated data preparation has AI integrate actuals, budget, and forecast from multiple sources. Variance calculations happen automatically. Data quality issues are flagged for review.
AI-powered root cause analysis identifies performance drivers automatically, ranks drivers by statistical contribution, and quantifies impact across all dimensions including product, region, and cost center.
Natural language generation converts variance drivers into executive narrative. Structure follows performance summary to driver explanation to business context. Output adapts to magnitude and direction of variance.
CFO refinement involves reviewing automated narrative for accuracy, adding strategic context and forward-looking perspective, and refining messaging based on board priorities.
Output example: "Q4 EBITDA of $12.5M came in 6% below plan, driven by higher operating expenses (70% contribution) and revenue timing delays (30%). OpEx variance primarily reflects accelerated product development investment ($1.5M) to maintain competitive position. Revenue delays are pipeline-related; $800K expected to convert in Q1. Despite Q4 miss, full-year EBITDA exceeded guidance at $48.2M (+2% vs. $47M midpoint)."
This process reduces board deck preparation from 2 weeks to 2-3 days while improving narrative quality through consistent structure and quantified driver explanations.
15. How can I use AI to generate FP&A packs with narrative commentary tailored for different audiences?
AI-powered FP&A packs work by automating analysis first, then tailoring narrative by audience.
Automating the analysis means AI automatically performs variance and driver analysis comparing actual versus plan, MoM, and YoY, identifying the few material factors—price, volume, mix, cost efficiency—that explain performance. This replaces manual flux analysis and ensures every narrative is grounded in the same facts.
Tailoring the story by audience means from the same insights, AI generates different narratives. Executives receive focus on what changed, why it matters, and what decisions are required. Operations receives focus on which teams, products, or processes drove results and what actions are needed. The board receives focus on trajectory versus plan, strategic implications, risks, and outlook.
Adding forward-looking context means AI incorporates forecasts, leading indicators, and scenarios so commentary explains not just what happened, but what's likely to happen next.
Delivering board-ready outputs means narratives embed directly into dashboards or slides alongside visual KPIs and variance bridges, reducing spreadsheet-heavy reporting.
16. How do I make finance reports more visual and less spreadsheet-heavy?
Visual best practices include using waterfall charts for variance decomposition, trend lines for period-over-period comparison, heatmaps for multi-dimensional performance across product and region, and bullet graphs for actual versus budget comparison. Limit tables to detail sections and lead with visuals.
What to visualize: headline metrics like revenue, EBITDA, and cash flow work well as trend charts. Variance drivers display best as waterfall charts showing contribution. Performance by segment suits heatmaps or ranked bar charts. Forecast versus actuals fits bullet graphs with variance bands.
When to use tables: detailed backup supporting executive summary, multi-period historical trends requiring precise values, and granular segment or account-level detail.
The key is narrative flow. Visuals tell the story at executive level while tables provide supporting detail for deeper questions.
AI-powered reporting platforms automate visualization. Variance waterfalls generate automatically from driver analysis. Charts update dynamically as data refreshes. Visual templates ensure consistent formatting across cycles.
17. What's the best format for presenting budget vs actual to the board?
The best budget versus actual format depends on board preferences, but generally follows a layered structure.
The executive summary slide includes headline metrics showing revenue, EBITDA, and EPS with variance versus budget, a variance waterfall showing key drivers, and a 2-3 sentence narrative explaining performance.
Performance detail slides cover one major P&L line each. The revenue slide shows actual versus budget by segment, P/V/M decomposition if applicable, and key drivers narrative. The EBITDA slide includes a bridge chart flowing from Revenue through COGS through OpEx to EBITDA, variance explanation for each component, and margin trend analysis. The cash flow slide covers operating cash flow versus budget, working capital movements, and liquidity position and runway.
Backup detail includes segment and product detail for deep dives, cost center-level OpEx breakouts, and historical trends and comparisons.
The goal is layered detail where executives see summaries first and drill into detail as needed. AI-powered presentation generation automates this structure by generating executive summary from variance analysis, creating waterfall charts automatically, producing narratives for each P&L component, and assembling slides in a consistent template.
18. How do I connect data from NetSuite or SAP to executive dashboards?
Connecting ERP data to executive dashboards requires three layers.
Data integration includes pre-built connectors for NetSuite, SAP, and Oracle, automated extraction of GL actuals, budget, and forecast, and near-real-time refresh taking hours instead of days.
The semantic layer maps ERP account codes to business-friendly terms, defines consistent hierarchies for products, regions, and cost centers, and handles multiple chart of accounts structures.
The dashboard layer calculates executive KPIs automatically from ERP data, generates variance waterfalls from budget versus actual, and provides drill-down capability to account-level detail.
The traditional approach exports GL data to Excel manually, builds pivot tables and calculations, copies charts to PowerPoint, and updates manually each cycle. The AI-powered approach provides direct connection to NetSuite and SAP with no exports, automated variance calculation and driver analysis, executive dashboard that refreshes automatically, and narrative commentary that generates from variance drivers.
This eliminates manual data handling, reduces errors, and accelerates dashboard preparation from days to hours.
19. What should a CFO dashboard include?
A CFO dashboard should prioritize actionable insights over comprehensive data.
Core metrics that should always be visible include revenue showing actual, budget, and forecast, EBITDA and margin percentage, operating cash flow, and liquidity and runway.
Performance indicators include variance versus budget flagged as favorable or unfavorable, trend versus prior period indicating accelerating or decelerating, and forecast accuracy comparing actual versus prior forecast.
Alert flags highlight metrics exceeding variance thresholds, trends indicating future risks, and budget categories at risk of overrun.
Drill-down capability allows clicking revenue to see breakdown by segment, product, and region, clicking EBITDA to see margin bridge across revenue, COGS, and OpEx, and clicking variances to see root cause analysis.
Narrative summary includes AI-generated explanation of key movements, driver attribution for significant variances, and recommended actions or investigations.
The best dashboards combine metrics showing what happened with insights explaining why it matters—not just status reporting.
AI-powered dashboards from platforms like Tellius provide automated variance highlighting, one-click drill-down to root cause, natural language summaries of performance, and proactive alerts when metrics cross thresholds.
20. How do I explain complex financial variances in simple terms for non-finance executives?df
Explaining complex variances in simple terms requires structure and analogy.
Structure follows four parts. Headline states the variance in one sentence. Driver quantifies the main cause in one sentence. Context explains why it matters in one sentence. Action states next steps in one sentence.
Example: Headline: "EBITDA came in 8% below plan in Q4." Driver: "70% of the gap was higher Sales & Marketing spend ($2.5M over budget)." Context: "This reflects accelerated hiring to support new product launch—strategic investment with 6-9 month expected payback." Action: "Monitoring pipeline closely; if conversion rates meet expectations, full-year impact should be positive."
Avoid accounting jargon like accruals, deferrals, and capitalization. Avoid multi-variable explanations that say "it was partly A, and also B, plus C." Avoid percentage-on-percentage like "margins compressed 200 bps."
Use absolute dollar impacts like "$2.5M over budget." Use attribution percentages like "70% of the gap." Use business analogies like "hiring ahead of revenue—like building capacity before demand arrives."
AI-powered narrative generation automatically structures explanations this way, ensuring complex variances are explained clearly for non-finance audiences.
21. Can AI generate executive summaries from financial data?
Yes. AI-powered natural language generation can convert financial variance analysis into executive summaries automatically.
How it works: Variance analysis has AI identify drivers and quantify contribution. Narrative structure applies template following headline to drivers to context. Language generation converts quantified drivers into plain-English sentences. Output is executive summary ready for CFO review.
Example input from variance analysis: EBITDA is -5% versus budget. Driver 1 is Sales & Marketing OpEx +$2.5M at 60% contribution. Driver 2 is Revenue -$1.5M at 36% contribution. Driver 3 is COGS favorable +$500K providing 12% offset.
AI-generated output: "Q4 EBITDA of $12.5M came in 5% below plan, driven primarily by higher Sales & Marketing spend (60% of variance) and revenue shortfall (36%). The OpEx overrun reflects accelerated hiring to support new product launch. Revenue underperformance was concentrated in enterprise segment due to deal timing. Favorable COGS performance ($500K) partially offset these headwinds."
The AI handles mechanical writing while preserving accuracy and structure. CFOs review and add strategic context rather than writing from scratch.
22. How do I build a finance narrative that tells a story, not just reports numbers?
Building a narrative that tells a story requires three elements: arc, causation, and stakes.
Arc follows beginning to middle to end. Beginning describes where you expected to be based on budget, forecast, and plan. Middle describes where you actually landed based on actuals and performance. End describes where you're going based on outlook, guidance, and actions.
Causation explains why things happened. Not just "revenue declined 10%" but "revenue declined 10% because enterprise deals slipped due to extended procurement cycles, reflecting macro uncertainty."
Stakes explains why it matters. Not just "OpEx increased 15%" but "OpEx increased 15%, driven by strategic hiring ahead of product launch. If launch succeeds, payback is 6 months; if it falters, we'll need to cut $2M to preserve margin."
Bad narrative shows numbers only: "Revenue was $50M (+2% vs. plan). EBITDA was $12M (-5% vs. plan). OpEx was $18M (+15% vs. plan)."
Good narrative tells story: "Revenue of $50M slightly exceeded plan (+2%), but product mix shifted toward lower-margin segments. This, combined with higher OpEx from accelerated hiring ($2.5M over plan), compressed EBITDA to $12M, 5% below budget. The OpEx investment positions us for new product launch in Q1—critical to hitting full-year targets."
AI-powered narrative generation handles the mechanical structure while CFOs add stakes and strategic context.
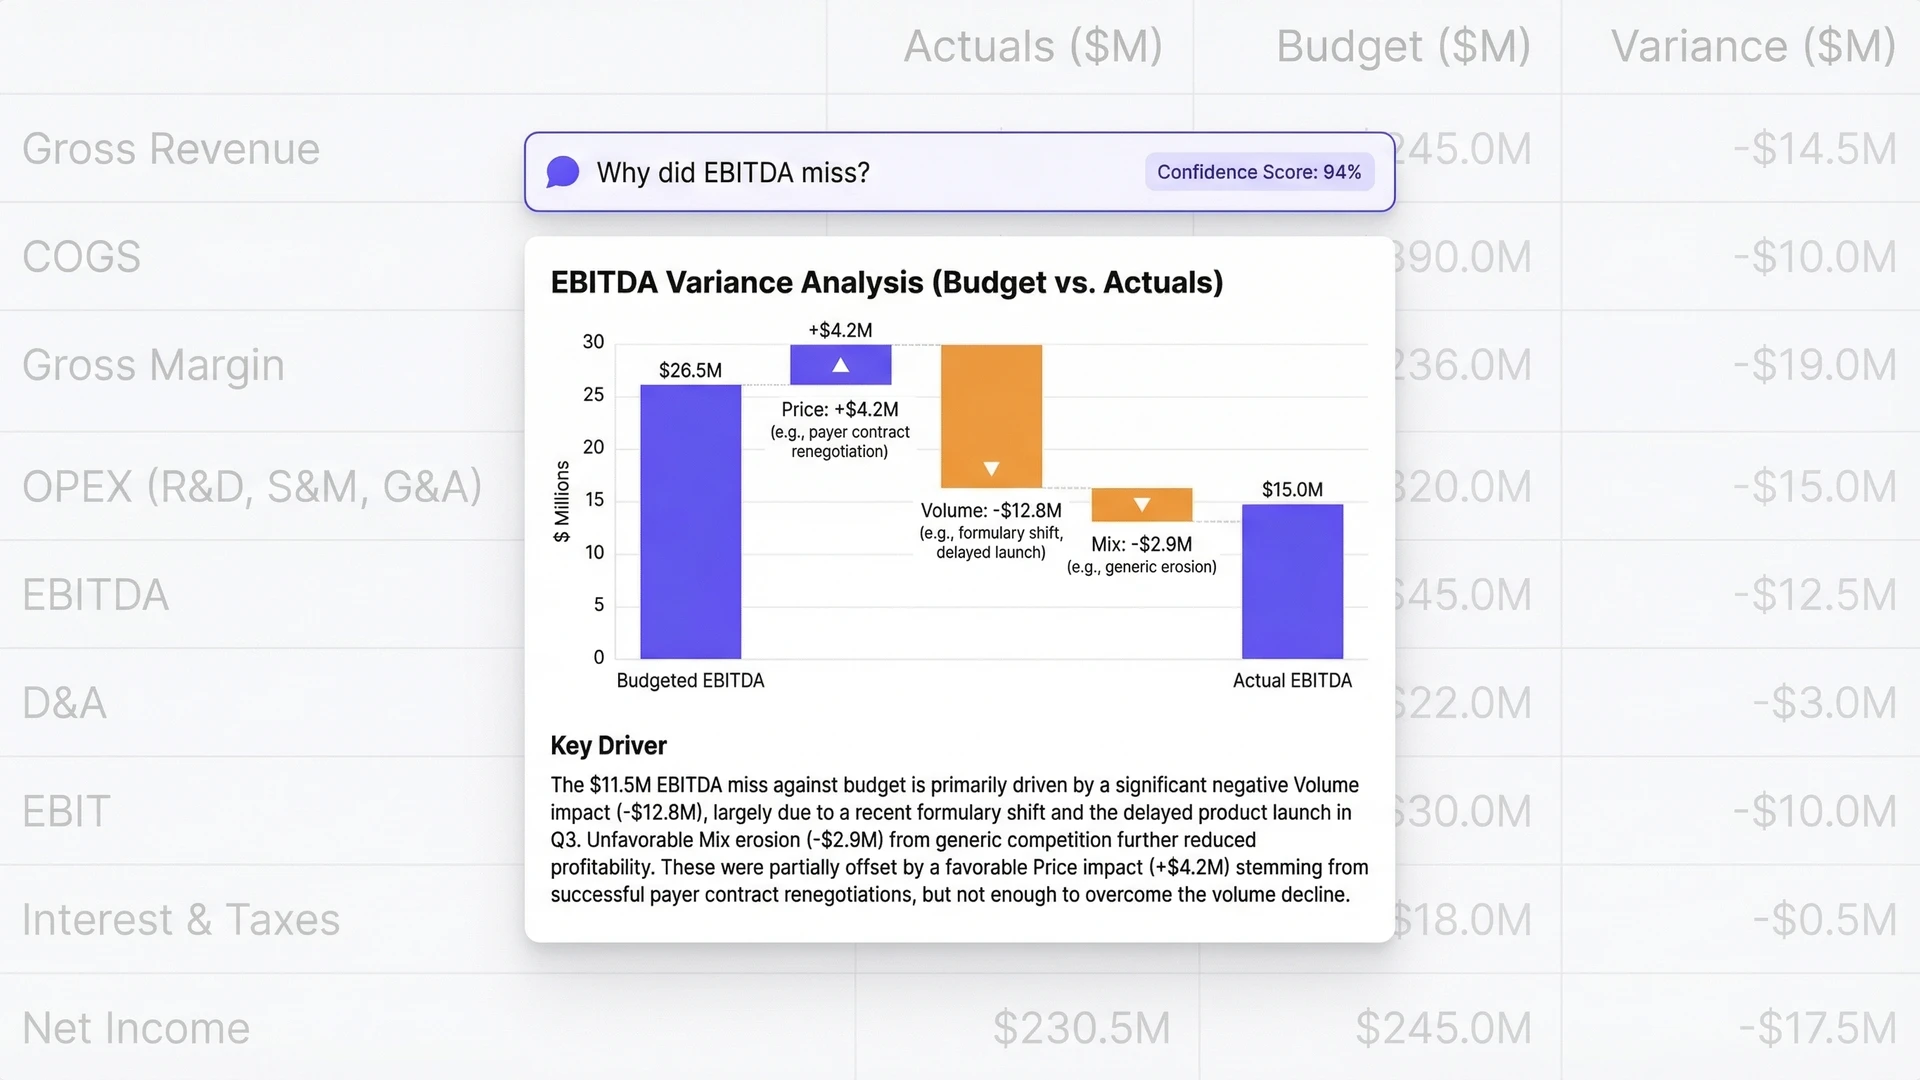
23. How do I explain EBITDA performance to the board?
Explaining EBITDA performance to the board requires structured decomposition across five elements.
Headline variance: "EBITDA of $12.5M came in 6% below plan ($800K unfavorable)." Revenue contribution: "Revenue underperformance contributed $500K (62% of variance), driven by enterprise deal delays." COGS contribution: "COGS came in favorable by $200K (25% offset), reflecting supply chain efficiency gains." OpEx contribution: "OpEx exceeded plan by $500K (63% of variance), primarily from Sales & Marketing hiring to support new product launch." Strategic context: "Despite Q4 miss, full-year EBITDA of $48.2M exceeded guidance. Q4 OpEx investment positions us for accelerated growth in 2025, with expected 6-9 month payback."
Visual format uses an EBITDA bridge or waterfall chart. Start with Budgeted EBITDA of $13.3M. Show Revenue impact of -$500K. Show COGS impact of +$200K. Show OpEx impact of -$500K. End with Actual EBITDA of $12.5M.
AI-powered platforms automatically generate this structure. The variance waterfall creates automatically from analysis. Narrative explains each bridge component. Strategic context is added by the CFO.
Part 3: Platform Selection & Implementation
24. What capabilities should narrative generation tools have for finance reporting?
Narrative generation tools for finance require five specific capabilities beyond generic AI writing.
Variance-aware generation means the tool must understand that "EBITDA declined 5%" requires explaining which drivers contributed and by how much. Generic writing tools produce summaries; finance tools produce driver attribution like "driven primarily by Sales & Marketing OpEx (60% contribution) and revenue timing (40%)."
Multi-level decomposition means the tool should generate explanations at different depths—headline summary for executives, operational detail for business partners, strategic context for board. This isn't just length adjustment; it's emphasis and framing adaptation.
Template enforcement means the tool should apply consistent structure across all reports—headline to drivers to context to outlook—without requiring prompts each time. Finance leaders define preferred narrative flow once; the tool applies it automatically.
Terminology consistency means "EBITDA," "variance," "P/V/M," and "margin bridge" should produce the same output structure regardless of how questions are phrased. Generic tools produce different narratives depending on prompt wording.
Source traceability means every sentence in generated commentary should link to underlying variance analysis. When the narrative says "Sales & Marketing contributed 60%," users should be able to drill to the calculation. This is non-negotiable for governance and audit.
25. What's the best AI platform for generating financial commentary and board decks?
Software that automates board presentations needs four layers.
The data layer connects to ERP, planning, CRM, and operational systems with a unified semantic layer for consistent definitions and automated refresh on schedule or trigger.
The analysis layer performs automated variance calculation and root cause analysis, trend detection and anomaly flagging, and scenario modeling and sensitivity analysis.
The narrative layer provides natural language generation from variance drivers, audience-specific commentary for board versus management, and customizable templates and tone.
The presentation layer offers automated slide generation from templates, dynamic charts and tables from live data, and version control and collaboration.
Platforms with these capabilities include Tellius for full-stack automation from data to narrative to presentation, Workiva and Certent for strong presentation assembly but limited AI narrative generation, and Anaplan or Adaptive plus BI tools where data and analysis are strong but narrative generation requires add-ons.
Most finance teams don't need to replace existing tools—they need to add an intelligence layer like Tellius that sits on top and automates the narrative generation workflow.
26. Which AI tools can generate management commentary automatically?
AI tools that generate management commentary need natural language generation capabilities specifically trained on finance.
Purpose-built finance platforms like Tellius provide finance-native NLG that understands variance decomposition, P/V/M analysis, and EBITDA bridges. Tellius generates commentary directly from automated variance analysis results.
Generic NLG platforms like Arria NLG and Narrative Science (Quill) offer general-purpose NLG engines that can be customized for finance. These require significant configuration and don't include variance analysis capabilities.
Generic AI assistants like ChatGPT, Claude, and Copilot can generate management commentary if you provide variance analysis and structure manually. They lack governance, don't integrate with source systems, and require prompting for every report.
Key differentiators for finance commentary include domain knowledge (does it understand finance terminology like EBITDA, P/V/M, and variance decomposition), automation (does it generate commentary directly from data, or require manual analysis first), governance (are summaries auditable and traceable to source data), and customization (can commentary style and templates be tailored to company standards).
Tellius is the only platform that combines all four—providing automated variance analysis and commentary generation in one integrated workflow.
27. How does AI-powered management commentary differ from manual narrative writing?
Manual narrative writing requires finance teams to investigate variances, identify drivers, structure explanations, and write commentary from scratch every reporting cycle. This takes 3-5 days per report and produces inconsistent results—three analysts investigating the same variance often produce three different stories.
AI-powered management commentary automates the mechanical work. Variance analysis identifies drivers automatically. AI converts quantified drivers into plain-English sentences. Structure follows consistent templates. Output adapts to audience needs.
Key differences: Manual writing takes 3-5 days per cycle. AI-powered commentary generates in seconds. Manual writing produces inconsistent structure and emphasis. AI-powered commentary applies consistent templates. Manual writing requires starting from scratch each month. AI-powered commentary builds on governed definitions and repeatable workflows. Manual writing makes attribution difficult to trace. AI-powered commentary links every statement to source data.
What AI doesn't replace includes strategic judgment on messaging and emphasis, forward-looking context based on pipeline and market conditions, risk assessment requiring executive judgment, and board-specific nuance based on relationship dynamics.
The practical split is that AI handles "what happened and why" while CFOs handle "what it means and what we're doing about it."
28. How do I ensure AI-generated commentary maintains executive quality and tone?
Maintaining executive quality requires configuration upfront and review processes ongoing.
Define tone parameters before deployment. Executive commentary should be direct without being blunt, confident without overpromising, and precise without being dense. Document examples of good and bad tone from past board decks. Use these to configure narrative templates.
Establish vocabulary standards covering words to use and words to avoid. Use "investment" not "spending" for strategic initiatives. Use "timing shift" not "miss" for revenue that moved between quarters. Use "headwind" not "problem" for external challenges. Build these into template configuration.
Configure attribution precision. Executives want quantified drivers like "60% of variance" not vague attribution like "primarily driven by." Ensure generated narratives include percentage contribution for every material driver.
Set complexity thresholds. When variance has more than 3-4 significant drivers, the narrative should summarize the top 2-3 and note "additional factors contributed X%." Avoid narratives that list 8 drivers with equal emphasis.
Implement CFO review checkpoints. Even with well-configured AI, executive commentary requires human review before board distribution. The workflow should be AI generates draft, CFO reviews and refines, not AI generates final. Configure approval workflows that enforce this.
Track quality over time. Monitor which AI-generated sentences CFOs edit most frequently. Use this feedback to refine templates and improve generation quality.
29. Where does AI actually add value in management reporting vs. what humans should do?
AI adds value in management reporting in four specific areas.
Speed through automation means commentary that took 3-5 days to write now generates in seconds. AI eliminates the manual loop of investigating variances, structuring explanations, and writing sentences.
Consistency across reports means same variance drivers produce same narrative structure every time. This eliminates the "three analysts, three different stories" problem and ensures brand-compliant executive communication.
Comprehensiveness in driver coverage means AI tests all possible drivers simultaneously and includes quantified contribution for each. Manual writing often focuses on one or two obvious drivers while missing important secondary factors.
Traceability to source data means every AI-generated statement links back to underlying variance analysis. This provides audit trail and governance that manual writing lacks.
What humans should do—and AI shouldn't replace—includes strategic judgment on messaging emphasis and tone, forward-looking guidance based on pipeline, market intelligence, and business strategy, risk assessment requiring executive judgment on likelihood and mitigation, board relationship management including what to emphasize and how to frame sensitive topics, and decision recommendations that synthesize analysis with strategic priorities.
The goal isn't replacing finance leadership; it's freeing them from mechanical writing so they can focus on strategic interpretation and decision support.
30. How do I evaluate the quality of AI-generated narratives during vendor demos?
Evaluating narrative quality requires testing with real scenarios, not polished demos.
Bring your own variance data. Provide vendors with actual variance analysis from a recent close—EBITDA down 5%, with specific drivers. Ask them to generate commentary on the spot. Compare output to what your team wrote manually. Does the AI narrative capture the same drivers? Is attribution accurate?
Test edge cases. Provide a quarter with unusual circumstances—one-time items, restatements, or offsetting variances. See how the AI handles complexity. Does it distinguish one-time from recurring? Does it explain offsetting factors clearly?
Request multiple audience versions. From the same variance data, ask for CFO summary (3 sentences), operational detail (2 paragraphs), and board narrative (outcome-focused). Evaluate whether each version is genuinely different or just longer/shorter. Good tools adjust emphasis and framing, not just length.
Check driver completeness. If your variance had 4 significant drivers, does the AI narrative mention all 4 with appropriate attribution? Or does it focus on 1-2 and ignore others? Comprehensive driver coverage distinguishes finance tools from generic summarizers.
Verify source linkage. Ask to see how each sentence in the narrative traces to underlying data. Can you click "60% contribution" and see the calculation? Audit trail is essential for governance.
Test terminology handling. Use your company's specific terms—your EBITDA definition, your segment names, your preferred phrasing. Does the AI apply these consistently or default to generic language?
31. What templates and style guides should finance teams prepare before implementing automated commentary?
Preparing templates and style guides before implementation accelerates deployment and improves output quality from day one.
Collect narrative examples from the past 4-6 quarters. Gather board decks, monthly commentary, and CFO presentations. Identify patterns in structure, tone, and terminology. Mark examples of narratives your CFO considers excellent versus those that required heavy editing.
Document preferred narrative structure. Most finance teams follow headline to drivers to context to outlook, but specifics vary. Does your CFO want drivers ranked by contribution or presented in logical order? Does context come before or after driver detail? Write this down explicitly.
Create terminology glossary. Define how your company refers to key concepts. "Revenue" versus "net revenue" versus "gross revenue." "EBITDA" versus "Adjusted EBITDA." "Headcount" versus "FTEs." "Budget" versus "plan" versus "forecast." AI will use these terms consistently once configured.
Specify tone guidelines. Collect phrases your CFO uses repeatedly and phrases they avoid. "Strategic investment" versus "cost overrun." "Timing shift" versus "miss." "Headwind" versus "challenge." Document these preferences for template configuration.
Define audience parameters. Describe what each audience needs. Board wants strategic context and outlook. CFO wants driver attribution and risk factors. Operations wants actionable detail and trend analysis. Write 2-3 sentences describing each audience's priorities.
Identify approval workflows. Document who reviews commentary before distribution. Define what "CFO approval" means—full rewrite authority or minor refinement only. Configure these workflows in the platform.
This preparation takes 1-2 weeks but saves 4-6 weeks during implementation by eliminating trial-and-error template refinement.
32. How do finance teams measure quality improvement from automated commentary generation?
Measuring quality improvement requires tracking both efficiency metrics and output quality indicators.
Efficiency metrics are straightforward. Track time from close completion to board deck delivery—baseline versus with automation. Track hours spent on narrative writing per reporting cycle. Track number of review iterations before CFO approval. Most teams see 60-80% reduction in writing time and 50% reduction in review cycles.
Output quality is harder to measure but more important. Track CFO edit rate by calculating what percentage of AI-generated sentences the CFO modifies before approval. High edit rates (above 40%) indicate template refinement needed. Target edit rate below 20% after 3-4 cycles.
Track driver completeness by asking whether narratives capture all material drivers, or do CFOs add missing factors during review. If CFOs consistently add the same types of drivers (timing factors, one-time items, segment detail), update templates to include these automatically.
Measure consistency across business units. If the same variance in two different segments produces narratively consistent explanations, automation is working. If similar variances produce different narrative structures, template enforcement needs tightening.
Survey stakeholder satisfaction. Ask board members, executives, and operations leaders whether commentary quality improved, stayed the same, or declined after automation. Quantitative metrics matter less than whether stakeholders find narratives more useful.
Track governance metrics. Count audit findings related to commentary accuracy before and after automation. Well-implemented AI commentary should reduce errors because attribution is calculated, not estimated.
33. How does automated commentary integrate into existing monthly close and board reporting workflows?
Automated commentary integrates at specific points in the close-to-board workflow without disrupting established processes.
During close (Days 1-5), existing processes continue unchanged. GL close happens in your ERP. Consolidation and adjustments follow normal procedures. Planning tool actuals refresh as scheduled. Automated commentary doesn't change close mechanics—it consumes close outputs.
Post-close analysis (Days 6-8) is where automation integrates. Once close completes, AI connects to actuals and budget data, calculates variances automatically, identifies and ranks drivers, and generates first-draft narratives. This replaces 3-5 days of manual variance investigation and narrative writing with hours of automated generation.
CFO review and refinement (Days 9-10) adapts slightly. Instead of reviewing analyst-written drafts and providing direction for rewrites, CFOs review AI-generated drafts and refine directly. The feedback loop shortens from "analyst writes, CFO reviews, analyst rewrites, CFO approves" to "AI generates, CFO refines, done."
Board deck assembly (Days 11-12) uses AI-generated narratives as inputs. Commentary embeds into existing PowerPoint templates. Charts and tables come from existing BI tools. The integration point is narrative content, not presentation format.
Distribution and pre-reads (Days 13-14) follow existing workflows. Approval routing, version control, and distribution use existing processes.
The net effect is compressing Days 6-10 from 5 days to 2 days while keeping all other workflow stages intact. Total cycle time drops from 14 days to 9-10 days without process disruption.
34. How does Tellius handle the variance-to-narrative workflow for executive reporting?
Tellius handles variance-to-narrative as an integrated workflow, not separate analysis and writing steps.
When close data arrives, Tellius automatically calculates variances across all configured dimensions—P&L line, segment, product, region, cost center. No manual variance calculation or Excel modeling required.
Driver decomposition happens immediately. Tellius identifies which factors drove each variance and quantifies contribution. For an EBITDA miss, output includes "Sales & Marketing OpEx +$2.5M (60% contribution), Revenue timing -$1.5M (36%), COGS favorable +$500K (12% offset)." This attribution is calculated, not estimated.
Narrative generation converts driver decomposition into prose automatically. The system applies configured templates—headline to drivers to context to outlook—and generates executive-ready sentences: "Q4 EBITDA of $12.5M came in 5% below plan, driven primarily by higher Sales & Marketing spend (60% of variance) from accelerated hiring, with additional impact from enterprise deal delays (36%)."
Multi-audience adaptation produces different versions from the same analysis. Executive summary runs 3 sentences with headline and top drivers. Operational detail spans 2 paragraphs with segment breakout and trend context. Board narrative focuses on strategic implications and outlook.
Template enforcement ensures every report follows the same structure. Once finance leaders define preferred narrative flow, Tellius applies it consistently across monthly close, quarterly reviews, and ad-hoc requests.
Source traceability links every sentence to underlying calculations. When the narrative says "60% contribution," users can drill to see exactly how that percentage was derived—enabling governance and audit.
The key difference from generic tools is that variance analysis, driver decomposition, and narrative generation happen in one connected workflow. You don't analyze in one tool and write in another.
Tellius has transformed how we prepare board materials. What used to take our team 2 weeks—data collection, variance analysis, PowerPoint writing—now takes 3 days. The AI-generated narratives give us a strong first draft that we refine rather than writing from scratch.

Ready to Transform Management Reporting?
Join leading finance teams using AI to automate commentary generation, reduce board prep time by 70-85%, and shift finance capacity from writing slides to strategic analysis.
Continue the journey
Dig into our latest content related to financial analysis.
.webp)
Best FP&A Software in 2026: The Tools That Plan, and the Layer That Explains Why
Modern FP&A teams need more than planning software—they need the ability to explain financial performance, identify the drivers behind change, and act faster on emerging risks and opportunities. This buyer's guide compares the leading FP&A platforms in 2026 across budgeting, forecasting, scenario modeling, financial consolidation, reporting, AI-assisted planning, and enterprise analytics. It also introduces a new evaluation framework: distinguishing the systems that plan from the intelligence layer that explains why.
.webp)
14 Best AI Tools for Finance Teams in 2026 | Comparison Guide
AI is rapidly reshaping how finance teams plan, analyze, and report on business performance. This guide compares 14 of the best AI tools for finance teams in 2026, covering platforms for financial analysis, forecasting, reporting, and automated insights. It explains how modern AI tools help finance professionals move beyond spreadsheets and manual reporting by automating data integration, uncovering drivers behind financial performance, and generating faster forecasts and variance explanations. The article also provides a practical framework for evaluating finance AI tools—highlighting which platforms are best for FP&A, financial analysis, operational planning, and executive reporting in today’s AI-driven finance stack.
What Is AI-Powered Financial Analytics? 2026 Guide
AI-powered financial analytics is transforming how finance teams analyze performance, forecast outcomes, and explain business results. Instead of relying on manual spreadsheets and static dashboards, modern AI analytics platforms use machine learning, natural language interfaces, and automated analysis to uncover the drivers behind financial metrics in seconds. This guide explains how AI-powered financial analytics works, the core technologies behind it, and how finance teams use it for tasks like variance analysis, forecasting, anomaly detection, and executive reporting. It also explores how AI shifts finance from reactive reporting to proactive, insight-driven decision-making by automatically identifying trends, investigating root causes, and generating clear explanations of what’s impacting business performance.

Heading
Heading 1
Heading 2
Heading 3
Heading 4
Heading 5
Heading 6
Lorem ipsum dolor sit amet, consectetur adipiscing elit, sed do eiusmod tempor incididunt ut labore et dolore magna aliqua. Ut enim ad minim veniam, quis nostrud exercitation ullamco laboris nisi ut aliquip ex ea commodo consequat. Duis aute irure dolor in reprehenderit in voluptate velit esse cillum dolore eu fugiat nulla pariatur.
Block quote
Ordered list
- Item 1
- Item 2
- Item 3
Unordered list
- Item A
- Item B
- Item C
Bold text
Emphasis
Superscript
Subscript
The Challenge Every Pharma Commercial Leader Faces
You're drowning in data from IQVIA, claims databases, CRM systems, and competitive intelligence platforms—yet when executives ask "Why did our numbers change?" the answer is always: "We'll need a few days to investigate."
The Problem Isn't Lack of Data — It's Lack of Insights
Traditional dashboards show what happened, not why
Root cause analysis takes days or weeks of manual investigation
Non-technical users can't explore data without submitting IT requests
Insights arrive too late to prevent revenue loss
Multiple tools and data sources create fragmented views
Field teams spend 40% of their time preparing reports instead of selling
Agentic Analytics Changes Everything
Deploy AI agents that work 24/7—continuously monitoring your business, automatically investigating changes, and proactively alerting you to risks and opportunities. From weeks of manual analysis to seconds of AI-generated insights. From reactive reporting to agentic intelligence. From data silos to unified, self-operating analytics.
Introducing Pharma Intelligence
Unified decision intelligence across your entire commercial operation
Pharma teams depend on fast, accurate insights across HCP targeting, field execution, market access, contracting, brand growth, patient services, and incentive compensation. Pharma Intelligence brings all these capabilities together—powered by AI analytics and agentic workflows—to help organizations unify data, explain performance, detect risks, and drive next-best actions across every commercial function.
📊 Analytics Solutions for Every Commercial Function
📊
Analytics Solutions for Every Commercial Function
Each hub addresses critical challenges with unified data, instant root cause analysis, and AI-powered insights. Choose your area to explore how we solve your specific pain points.

Field Force Sales Effectiveness
📝
34 Questions
⏱️
6,000 words
Pharma teams depend on fast, accurate insights across HCP targeting, field execution, market access, contracting, brand growth, patient services, and incentive compensation. Pharma Intelligence brings all these capabilities together—powered by AI analytics and agentic workflows—to help organizations unify data, explain performance, detect risks, and drive next-best actions across every commercial function.
Critical Capabilities:
HCP targeting & segmentation (AI-powered scoring)
Territory performance vs. potential (real-time)
Call quality & message effectiveness (NLP analysis)
Prescriber churn prediction (early warning alerts)
Pre-call planning (automated contextual briefs)

Brand Performance & KPIs
📝
31 Questions
⏱️
6,500 words
Transform business reviews and root cause analysis with instant TRx/NBRx explanations, automated market share decomposition, and complete narrative generation. Uncover hidden opportunities worth millions while reducing prep time from 2 weeks to 2 days—eliminating the endless Excel work and manual investigation cycle.
Critical Capabilities:
TRx/NBRx anomaly detection & auto-explanation
Market share decomposition (instant driver analysis)
Root cause analysis (multi-variable, seconds not days)
Business review automation (narrative + visuals)
Competitive intelligence (continuous tracking)

Market Access Performance
📝
30 Questions
⏱️
5,500 words
Track formulary changes, prior auth approval rates, and payer mix shifts with unified access intelligence—identifying exactly where coverage restrictions cost you scripts before they impact revenue. Get automated alerts on formulary movements, access barriers, and abandonment patterns with recommended interventions.
Critical Capabilities:
Formulary impact alerts (position change detection)
Prior authorization tracking (approval rate trends)
Payer mix dynamics (coverage shift analysis)
Abandonment prediction (access barrier identification)
Copay program ROI (effectiveness measurement)

Contracting & Payer Strategy
📝
30 Questions
⏱️
5,500 words
Optimize contract performance with unified tracking of rebate effectiveness, volume commitments, and ROI across all payer agreements. Model negotiation scenarios, measure contract impact in real-time, and identify which agreements deliver value and which underperform—with recommended actions before renewals.
Critical Capabilities:
Performance vs. expectations (continuous tracking)
Rebate effectiveness (automated optimization)
Scenario modeling (what-if negotiations)
Gross-to-net decomposition (contract-level)
Value-based outcomes (automated tracking)

HCP Targeting & Segmentation
📝
30 Questions
⏱️
5,500 words
Identify high-potential prescribers with AI-powered lookalike modeling, calculate physician lifetime value in real-time, and dynamically adjust segmentation as market conditions change. Find opportunities before competitors while optimizing targeting continuously—without manual deciling or static segment updates.
Critical Capabilities:
High-potential identification (AI-powered scoring)
Lookalike modeling (predictive targeting)
Prescriber LTV calculation (real-time updates)
Dynamic micro-segmentation (adaptive)
Acquisition optimization (prescriber journey)
⚡
Two Powerful Approaches to Analytics Transformation
⚡ Two Powerful Approaches to Analytics Transformation
Combine conversational interfaces for instant answers with agentic intelligence that works proactively—solving both immediate needs and long-term efficiency.

Conversational Analytics & AI Foundations
📝
25 Questions
⏱️
4,500 words
The foundation: Ask questions in plain English and get instant answers. Conversational interfaces democratize data access, automated root cause analysis explains why metrics moved, and predictive models forecast future performance. Essential AI capabilities that transform static dashboards into interactive intelligence.
Foundational AI Capabilities:
Conversational analytics (natural language queries)
Automated root cause analysis (driver decomposition)
Predictive modeling (prescription trend forecasting)
Machine learning (segmentation & targeting)
Unified data integration (IQVIA, CRM, claims, digital)

Agentic Analytics: AI Agents That Work 24/7
📝
25 Questions
⏱️
4,500 words
The evolution: AI agents work continuously 24/7—monitoring your business, automatically investigating anomalies, and proactively alerting you to risks and opportunities before you ask. Move from asking questions to receiving answers you didn't know you needed. This is what separates reactive analytics from agentic intelligence.
Agentic Capabilities:
24/7 monitoring (continuous surveillance)
Automatic anomaly investigation (self-initiated RCA)
Proactive risk alerts (before revenue impact)
Self-optimizing workflows (adaptive intelligence)
Automated business narratives (review generation)
Platform & Technology Questions
Understanding Pharma Intelligence and agentic analytics at the platform level
What is agentic analytics for pharmaceutical commercial operations
Agentic analytics represents the evolution from reactive reporting to proactive intelligence. Unlike traditional analytics where users must ask questions and wait for answers, agentic analytics deploys AI agents that work continuously—monitoring your business 24/7, automatically investigating anomalies, and proactively alerting you to risks and opportunities before you ask. In pharmaceutical commercial operations, this means AI agents track hundreds of metrics across brand performance, field execution, market access, and HCP engagement simultaneously. When meaningful changes occur—like a TRx decline, formulary restriction, or prescriber disengagement—agents automatically perform root cause analysis and deliver specific, actionable recommendations with full context.
How does Pharma Intelligence unify data across commercial functions?
Pharma Intelligence automatically integrates data from IQVIA (prescription trends, market share), Symphony (claims data), CRM systems (Veeva, Salesforce for field activity), payer databases (formulary status, prior auth rates), competitive intelligence, and internal systems. The platform creates a unified semantic layer that harmonizes these disparate sources, resolving HCP identities, aligning geographies, and standardizing metrics. This means field teams, brand managers, market access leaders, and contracting teams all work from the same single source of truth. When an AI agent detects a TRx decline, it can instantly correlate field activity, payer changes, competitive moves, and HCP prescribing patterns—insights impossible when data sits in silos.
What's the difference between AI analytics and agentic analytics?
AI analytics provides conversational interfaces and automated insights—you ask "Why did NBRx decline?" and get instant answers with root cause analysis. This is valuable and represents a major improvement over traditional BI. Agentic analytics goes further: AI agents work autonomously without human prompting. They continuously monitor your business, automatically detect meaningful changes, investigate root causes on their own, and proactively send you alerts with recommendations. Think of it as the difference between having a very smart assistant who answers your questions (AI analytics) versus having a team of analysts working 24/7 who investigate issues and bring you insights before you know to ask (agentic analytics). Most organizations need both layers working together.
What ROI can we expect from deploying agentic analytics?
Typical pharmaceutical companies see $10-17M in annual value creation per brand with 6-9 month payback periods and 1,700%+ first-year ROI. Value comes from four areas: analyst time savings (70-85% reduction, ~$645K annually), proactive issue detection (catching formulary changes, prescriber churn, access barriers 2-4 weeks earlier saves $3-4M), AI-identified opportunities (underserved segments, high-potential HCPs, contract optimization worth $5-10M), and improved forecasting accuracy ($2-3M in better resource allocation). Beyond quantifiable ROI, organizations report dramatically improved executive satisfaction, faster business reviews (2 weeks to 2 days), and field teams spending time selling instead of preparing reports. The platform essentially pays for itself within the first quarter through time savings alone.
How do AI agents work across field force, brand, and market access?
AI agents operate across all commercial functions simultaneously, detecting insights that span multiple teams. For example: an agent monitoring market access detects Aetna added step therapy requirements affecting 8,200 covered lives. It automatically investigates the brand impact (estimated -$2.3M TRx), identifies affected territories and HCPs, analyzes which field reps need to adjust messaging, and calculates the patient support program implications. Within minutes, the agent sends coordinated alerts to market access (escalate with payer), brand team (update forecasts), field leadership (prioritize affected HCPs), and patient services (expect abandonment increase). This cross-functional intelligence—impossible with siloed tools—enables coordinated responses that protect revenue.
How long does deployment take and what resources are needed?
Typical deployment takes 6-12 weeks from kickoff to full production. Week 1-3: Data integration (IQVIA, CRM, claims, payer sources). Week 4-6: Semantic layer configuration and pharma-specific metric definitions. Week 7-9: Agent deployment, alert configuration, and user training. Week 10-12: Optimization and rollout. Required resources: Executive sponsor (5% time), 2-3 business analysts (50% time during deployment), IT liaison (25% time for data access), and key business users for UAT. Post-deployment, platform is largely self-operating—AI agents handle monitoring and investigation automatically. Most organizations need only 1-2 FTEs for ongoing administration, far less than traditional BI platforms that require constant analyst support.
How does this compare to traditional pharma analytics platforms?
Traditional platforms (Tableau, Power BI, Qlik) require users to build dashboards, write SQL, and manually investigate every question. Pharma-specific platforms (IQVIA OCE, Veeva CRM Analytics) provide pre-built reports but still require manual analysis. Neither offers AI agents that work autonomously. With agentic analytics, AI agents continuously monitor and investigate automatically—no dashboard building, no SQL, no waiting. Conversational interfaces let anyone ask questions in plain English. Root cause analysis happens instantly, not in 3-5 days. Business reviews generate automatically. Most importantly: you receive insights proactively before issues impact revenue, rather than discovering problems in retrospective reports. Organizations typically keep existing platforms for specific use cases while Pharma Intelligence becomes the primary decision intelligence layer.
How Agentic Analytics Transforms Your Workflow
How Agentic Analytics Transforms Your Workflow
Unified Data Integration
Automatically connect and harmonize data from IQVIA, Symphony, CRM (Veeva, Salesforce), claims databases, competitive intelligence, and internal systems. No more manual data pulls or Excel wrestling.
Ask Questions in Plain English
Conversational analytics lets anyone ask questions like "Why did NBRx decline in the Northeast last month?" and receive instant answers with automated driver analysis. No SQL, no waiting for reports.
Deploy AI Agents
Agentic analytics agents work 24/7—continuously monitoring hundreds of metrics across all dimensions. When meaningful changes occur, agents automatically investigate root causes, quantify business impact, and send prioritized alerts with specific, actionable recommendations. No human prompting required.
Receive Proactive Insights & Recommendations
Get specific, prioritized alerts with context and next steps: "Prior auth denials increased 18% with Aetna in Q3. Estimated TRx impact: -$2.3M. Root cause: New step therapy requirement. Recommend: Escalate to market access team within 48 hours, review formulary status across all major payers." Know what to do, not just what happened.
Jump to Your Specific Challenge
AI agents answer your questions across three levels: foundational understanding, agentic capabilities, and business impact measurement.
🎯
Understanding Challenges & Best Practices
🎯 Understanding Challenges & Best Practices
🤖
AI Agents & Agentic Capabilities
🤖 AI Agents & Agentic Capabilities
💰
Platform Evaluation & Business Impact
💰 Platform Evaluation & Business Impact
Real Results from Deploying Agentic Analytics
How AI agents deliver measurable business impact across pharmaceutical commercial operations
Top 10 Pharma — Oncology Brand
85% reduction in monthly review prep with automated business narratives
AI agents identified $12M opportunity in underserved community oncology
Proactive formulary alerts detected risk 3 weeks earlier, saved $8M
ROI: 2,200% in first year with agentic monitoring
Specialty Pharma — Neurology
Analyst team reduced from 4 FTEs to 2 with agentic automation
15% NBRx improvement through AI-optimized HCP targeting
Agentic anomaly detection prevents $3-5M revenue loss annually
Payback period: 7 months from agent deployment
Mid-Size Pharma — Cardiovascular
AI agents generate weekly reviews in 2 hours vs. 2 days
Root cause analysis: instant vs. 3-5 days of manual investigation
Agents found $18M in hidden payer contract optimization opportunities
Executive satisfaction: 4.2 → 9.1/10 with agentic insights
Calculate Your ROI from Agentic Analytics
See what you could save by deploying AI agents across your commercial operations
Typical ROI from Agentic Analytics Deployment
Value from AI agents: Analyst time savings ($645K), proactive issue detection ($3-4M), AI-identified opportunities ($5-10M), improved forecasting ($2-3M), 24/7 monitoring & investigation (at fraction of human cost)
Ready to Deploy Agentic Analytics?
Join leading pharma companies using AI agents to monitor 24/7, investigate automatically, and deliver proactive insights—reducing analysis time by 70-85% while protecting millions in revenue.
Explore Agentic Analytics Resources
What is Agentic Analytics?
Complete Technology Guide
Customer Success Stories
Real Results from Agent Deployment
Pharma Intelligence Platform
Unified Decision Intelligence
Expert Webinars
Live Agentic Analytic Demos