14 Best AI Tools for Finance Teams in 2026 | Comparison Guide
.webp)

The Best AI Tools for Finance Teams in 2026
AI tools for finance are platforms that apply artificial intelligence to core finance functions — financial planning and analysis (FP&A), budget-versus-actual variance analysis, financial close automation, accounts payable processing, audit and controls, anomaly detection, and management reporting. Unlike generic BI dashboards that visualize data, AI finance tools automate the analytical and operational work that consumes finance teams: decomposing P/V/M (price, volume, mix) variances, generating CFO narratives, flagging GL anomalies, reconciling accounts, and forecasting cash flow. The category spans everything from enterprise planning platforms like Anaplan to audit automation tools like DataSnipper to AI-powered finance analytics platforms like Tellius. Capabilities in this guide were verified against public product documentation, Gartner and G2 analyst reviews, and vendor release notes as of March 2026. Tools announced but not generally available are scored as partial.
According to Protiviti's 2025 Global Finance Trends Survey, 72% of finance organizations are now using AI — up from 34% the prior year — but most are applying it to process automation, not investigative intelligence. A McKinsey analysis on AI in finance functions found that finance teams spend up to 60% of their time on data gathering and reconciliation tasks that AI can reduce significantly. Deloitte's 2025 CFO Signals survey found that variance analysis and management reporting remain the highest-effort, lowest-value use of finance team time. This guide helps your team evaluate which tools actually deliver autonomous variance investigation and which just automate the tasks around it.
Categories of AI Finance Tools
AI tools for finance fall into five distinct categories. Understanding which category solves your primary problem is the fastest path to the right shortlist.
Most enterprise finance teams run tools from multiple categories simultaneously. The evaluation below covers all six.
We scored 14 platforms across eight dimensions designed to assess analytical depth, not just workflow automation. The single most important differentiator in our evaluation is automated root cause decomposition — the ability to explain why results deviated from plan, not just flag that they did. That's the capability gap that consumes the most analyst time today: the 3–5 day investigation cycle that follows every close when numbers miss expectations.
How to Choose Your AI Finance Tool
Not every finance team needs the same tool. Here's a decision framework based on your primary bottleneck:
If your primary need is enterprise-scale connected planning across finance, sales, and supply chain, start with Anaplan. It has 2,500+ customers and broad cross-functional planning model architecture.
If your organization is standardized on Workday and needs integrated HCM-finance planning with a single vendor, Workday Adaptive Planning provides workforce-finance integration with emerging AI capabilities.
If your primary need is understanding why results deviated from plan — not just seeing that they did — Tellius is an AI platform built specifically for automated variance investigation: decomposing contributing factors into price, volume, and mix with quantified impact across every connected data source. Autonomous agents monitor KPIs continuously, investigate anomalies without being prompted, and surface root cause explanations before your team asks. Results export directly to Excel, PowerPoint, or PDF. In this comparison, Tellius scored highest on this dimension.
If your primary need is financial close automation with SOX compliance at enterprise scale, BlackLine has a 20-year track record with 4,400+ customers in reconciliation and journal entry automation.
If your team lives in Excel and needs to consolidate finance data from multiple sources, Datarails adds NL chat on top of your existing spreadsheets. Note that analytical depth is limited to data already loaded into Datarails — root cause investigation across systems still requires manual work.
If you need lightweight AI assistance in Excel and already pay for M365 Copilot, use the finance agents — they're included in your license and add incremental analytical capability without new vendor adoption.
If your primary need is AI-powered audit risk detection using full-population analysis rather than sampling, MindBridge and DataSnipper serve that function — MindBridge for anomaly detection, DataSnipper for document extraction and evidence management.
Most enterprise finance teams run multiple platforms. The question isn't which one to pick — it's which combination matches your analytical workflow.
What Separates AI-Powered Investigation from AI-Assisted Automation
How does AI-powered FP&A differ from traditional FP&A?
Every vendor in this comparison uses the word "AI." The question is what happens after you type it into a search bar on their website.
For most platforms on this list, AI means automation of a specific process: budgeting, consolidation, reconciliation, invoice processing, audit testing. These are legitimate capabilities. Automating a three-day close process into a one-day close process saves real money. But they don't answer the analytical question that keeps CFOs up at night: why did margin compress 300 basis points last quarter?
The distinction matters because the finance function is drowning in two separate problems. The first is operational — too many manual tasks eating analyst time. Every tool on this list addresses some version of this problem. The second is investigative — when results deviate from plan, nobody can explain why fast enough for the explanation to be useful. A CFO asking "why did we miss" in a board meeting and getting "I'll have that for you by Friday" is not an automation problem. It's an intelligence problem.
Today, most finance teams attack the investigative problem the same way they did a decade ago: an analyst opens Excel, builds pivot tables, tests hypotheses manually, and writes up a narrative. That process takes 3–5 days per variance investigation, according to FP&A teams we've worked with. Multiply that by the number of variances worth investigating each close, and your team's strategic capacity disappears into reactive firefighting.
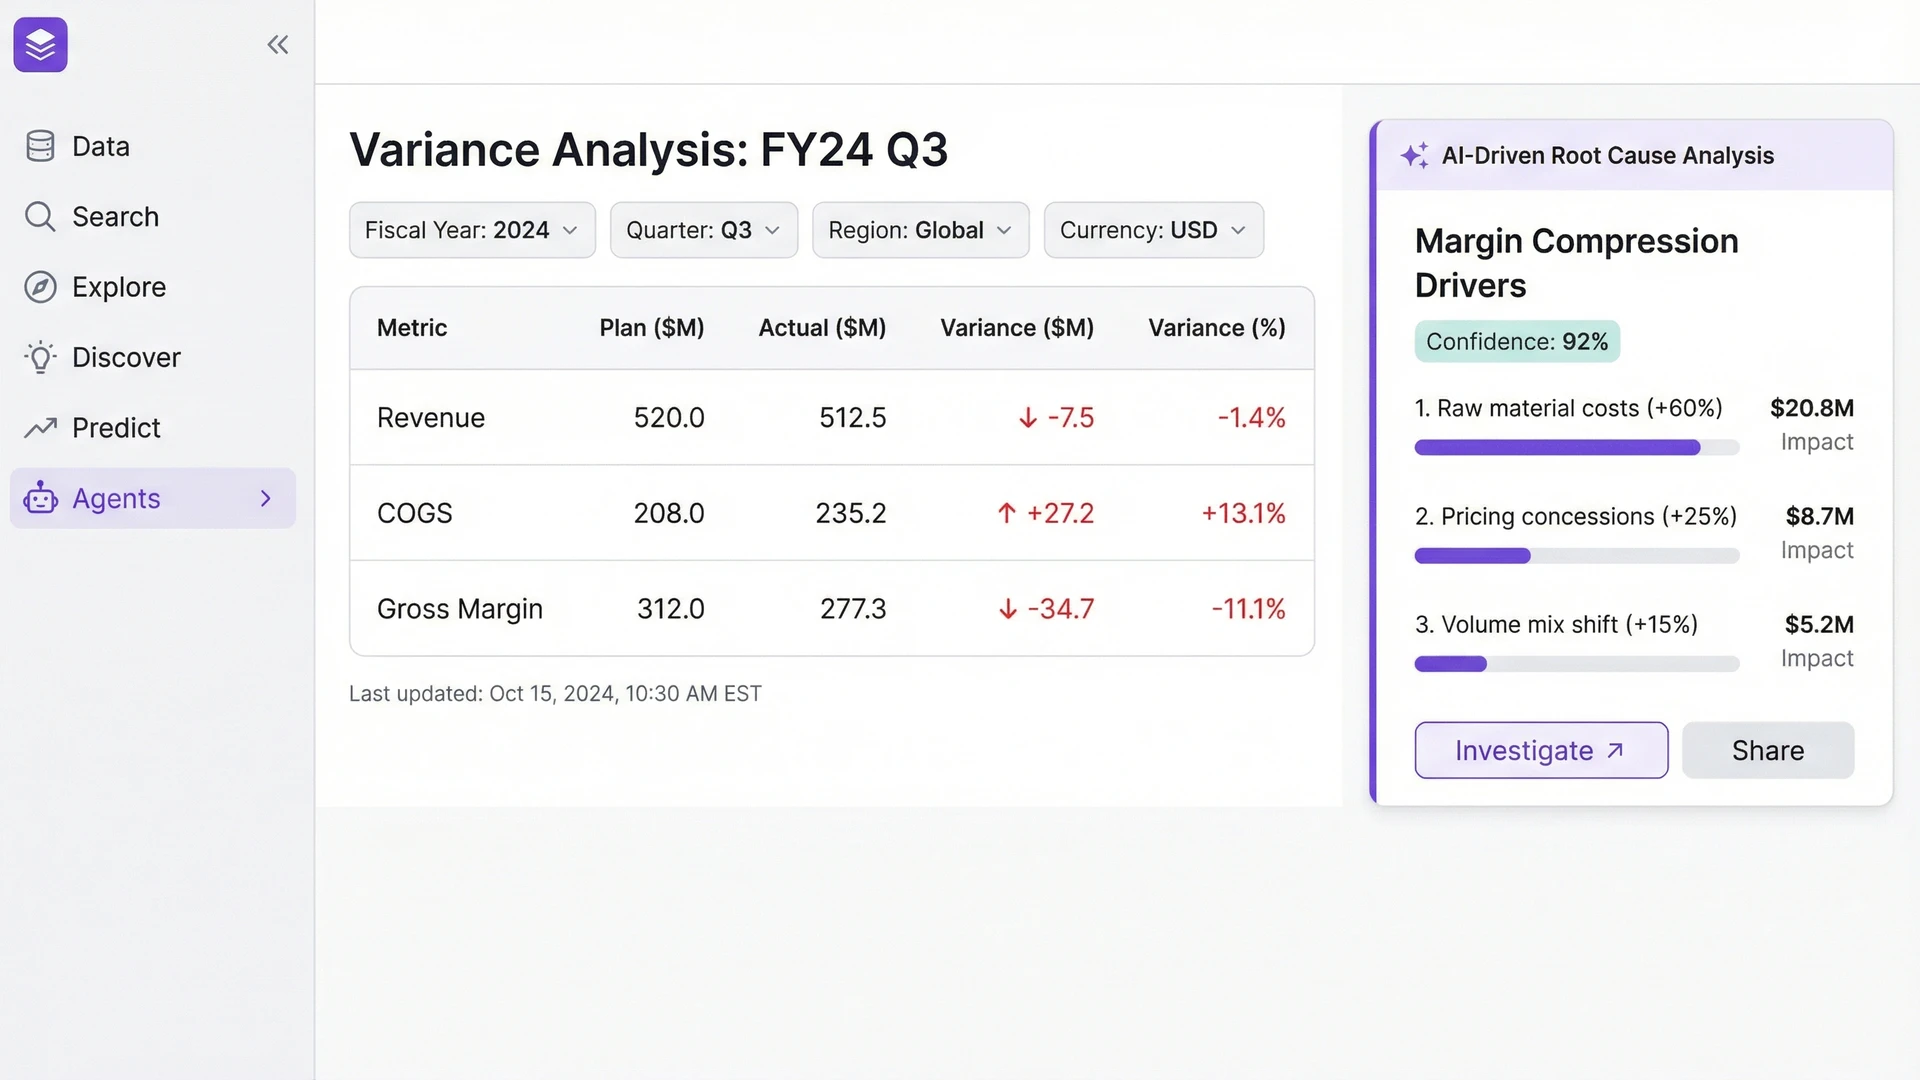
Here's a concrete example of the difference. A mid-market company closes Q3 and sees that gross margin compressed 300 basis points versus plan. With a Level 2 tool (AI-assisted automation), the planning platform flags the variance. The anomaly detection feature might even categorize it as "high severity." But the FP&A team still opens Excel, pulls data from the ERP and the supply chain system, builds pivot tables by region and product line, tests hypotheses about pricing versus volume versus mix, and eventually concludes — four days later — that 60% of the compression came from raw material cost increases concentrated in the Southeast division, 25% from pricing concessions to a key distributor, and 15% from unfavorable geographic mix.
What is P/V/M decomposition in FP&A?
With a Level 3–4 tool, the platform performs that entire investigation automatically. It queries the ERP, the supply chain data, the CRM, and the planning system simultaneously. It decomposes the 300 basis points into quantified drivers, ranks them, and generates a narrative: "Gross margin missed plan by 300bps. Primary driver: raw material costs in Southeast (+180bps), driven by supplier contract renegotiation in July. Secondary: pricing concessions to [distributor] (+75bps). Tertiary: geographic mix shift toward lower-margin territories (+45bps)." That analysis takes seconds, not days — and it arrives before the CFO asks.
The term "agent washing" has entered the conversation for a reason. Vendors who embed a chatbot into their planning tool and call it an "AI agent" are conflating two different things: answering questions about data you've already loaded into their system, and autonomously investigating why your business results changed across every data source you own. The first is a feature. The second is a platform.
This is the framework we used to evaluate the 14 tools in this guide — and it's why automated root cause decomposition is flagged as the single most important differentiator below.
The AI Finance Maturity Model
What is agentic analytics for finance teams?
Understanding where each tool sits on the maturity curve helps explain both what they can do today and what they'll likely be able to do in the next 2–3 years. IDC's 2025 Finance Automation Forecast projects 38% CAGR for AI-powered finance analytics through 2027, with agentic capabilities accounting for the majority of net-new investment. BCG's research on intelligent finance found that organizations at Level 3–4 analytical maturity spend 40% less time on variance reporting and 60% more time on strategic planning.
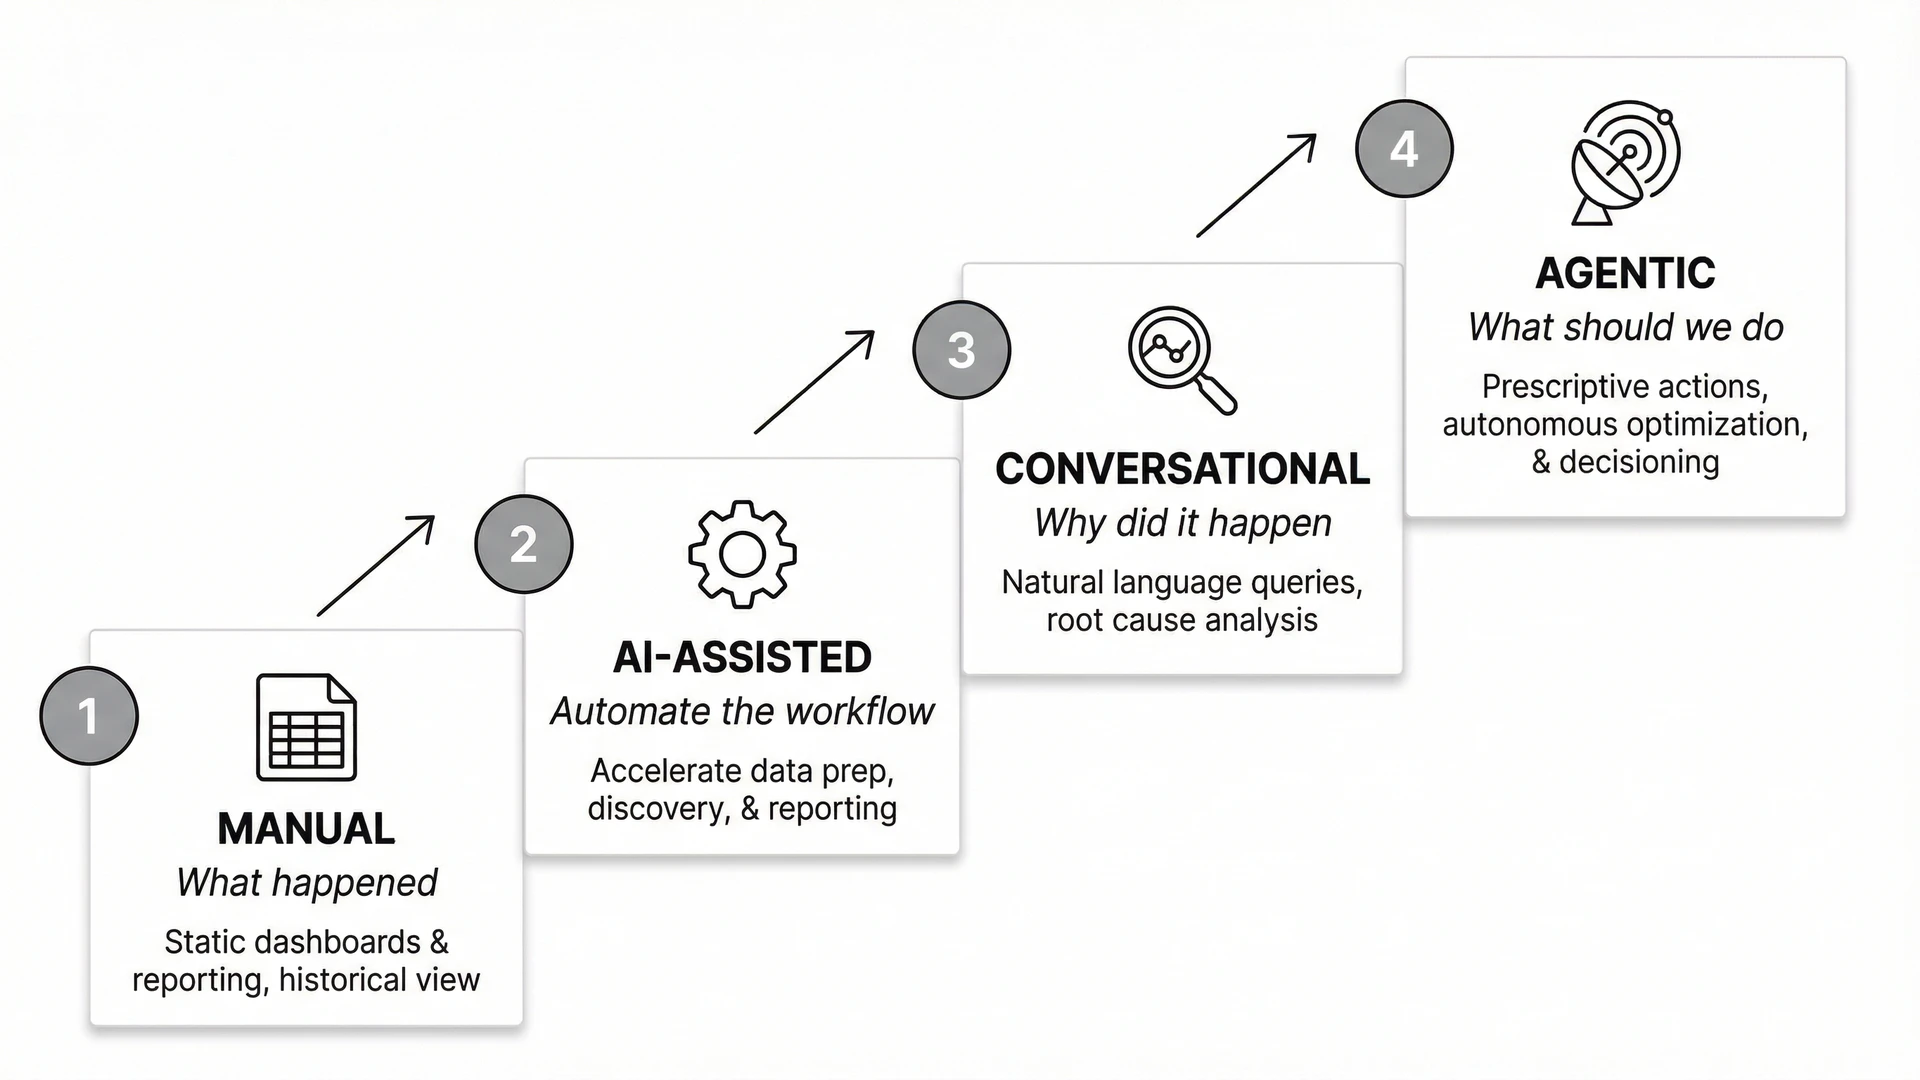
Level 1 — Traditional BI is the foundation layer where platforms show what happened. Tableau, Power BI, Qlik, and Looker live here. They visualize data, support ad-hoc reporting, and let analysts explore through drag-and-drop. No automation, no AI, no proactive insight generation. Analysts manually slice data to find answers.
Level 2 — AI-Assisted Process Automation is where platforms automate specific workflows. This is where the majority of tools in our comparison sit: Anaplan, Workday Adaptive, Planful, Pigment, Datarails, Cube, Vena, BlackLine, Stampli, DataSnipper, and MindBridge. Each embeds AI to accelerate a defined finance process — planning, close, AP, audit — with capabilities like anomaly flagging, NL chat within their workflow context, and AI-powered forecasting. The limitation is consistent: AI operates within a single process silo. Your planning tool doesn't explain close issues. Your close tool doesn't analyze planning variances. There is no cross-process intelligence.
Level 3 — Conversational Analytics is where platforms explain why something happened. Plain-language queries across connected data sources return analytical answers — not lookups — with automated root cause decomposition, quantified driver attribution (price/volume/mix), and narrative generation. The user still initiates the question, but the platform does the investigation.
Level 4 — Agentic Intelligence is where platforms act before you ask. AI agents autonomously monitor KPIs 24/7, detect anomalies across every connected system, investigate root causes without being asked, and proactively alert stakeholders with quantified explanations.
Among the platforms evaluated here, Tellius is the furthest along the maturity curve — operating at Levels 3 and 4 in production today. Most other tools in this comparison operate at Level 2 within their specific workflow domain.
How We Evaluated: 8 Dimensions
How should finance teams evaluate AI analytics platforms?
We scored each platform across eight dimensions. These aren't arbitrary features — they're the capabilities that determine whether a finance team can move from reactive reporting to proactive intelligence. We verified capabilities through public product documentation, vendor websites, Gartner analyst reports, and G2 peer reviews as of March 2026. Where a capability was announced but not generally available, we scored it as partial.
This evaluation weights AI-powered analytical depth as the primary differentiator. Organizations that prioritize planning model sophistication, close automation depth, or deployment cost may rank these platforms differently.
1. Automated Root Cause & Variance Decomposition (Most Important Differentiator) Can the platform automatically decompose price/volume/mix, rank variance drivers, and quantify each factor's contribution — in seconds, without manual pivot tables? This is the highest-differentiation dimension. Planning tools budget and forecast. Close tools reconcile. None of them automatically explain why results deviated from plan. We weighted this dimension most heavily because it represents the capability gap that consumes the most analyst time: the 3–5 day investigation cycle that follows every close when numbers miss expectations.
2. Agentic / Proactive Monitoring Does the system independently watch KPIs 24/7 and surface issues before someone asks? This separates passive dashboards from active intelligence.
3. Conversational Analytics (NL Querying) Can a non-technical finance user ask "Why is EBITDA 5% below forecast in Q3?" and get a substantive analytical answer — not just a data lookup or chart?
4. Board-Ready Narratives & Reporting Does the platform generate plain-English executive summaries directly from the data it analyzed — not charts that require someone to write the narrative manually?
5. Finance-Native Semantic Layer Does it understand GL hierarchies, chart of account structures, budget/actual logic, and fiscal calendars natively — without requiring manual configuration for every query?
6. Multi-Source Data Unification Can it query across ERP, CRM, data warehouses, and planning tools simultaneously — or is it locked to a single system's data?
7. Governed Auditability (SOX-Ready) Same question, same answer, with full data lineage and audit trail. Table stakes for enterprise finance — but notably absent from general-purpose LLMs.
8. Deploys on Existing Stack (No Rip & Replace) Does it complement your current tools or require you to replace them? Planning tools are the stack — adopting one means replacing another.
AI Finance Tools Comparison Table
Platforms ordered by a combination of market presence and analytical capability depth. ✓ = Full capability | ◐ = Partial/emerging | ✗ = Not available.
Note on ordering: Anaplan and Workday Adaptive rank first and second based on market presence, enterprise adoption, and planning model depth — they are the most widely deployed enterprise finance planning platforms in this comparison. Tellius ranks third because it leads in analytical investigation depth — the dimension we weight most heavily in this evaluation — but has less market presence as a Series B company. The remaining platforms are ordered by breadth of AI capability within their respective domains.
Note on Tellius scoring: Tellius receives a partial mark (◐) on "Deploys on Existing Stack" because while it layers on top of your existing infrastructure without replacing anything, the initial configuration of the semantic layer and FP&A System Packs requires partnership with Tellius's deployment team. This is not a self-serve sign-up-and-go experience — first value typically arrives in 4–6 weeks with full deployment in 8–12 weeks. Additionally, Tellius is not a planning tool — teams that need budgeting, forecasting, and scenario modeling still need their Anaplan or Workday Adaptive alongside Tellius.
Best AI Tools by Finance Category
Best AI Tools for FP&A
The best AI tools for FP&A (financial planning and analysis) depend on whether your bottleneck is planning model sophistication, Excel workflow preservation, or variance investigation speed.
Best for enterprise connected planning: Anaplan — 2,500+ customers, cross-functional planning model architecture, emerging AI agents for scenario analysis.
Best for Excel-native FP&A teams: Datarails — preserves existing Excel workflows, 200+ ERP integrations, NL chat on consolidated data.
Best for automated variance investigation: Tellius — an AI platform purpose-built for the investigative side of FP&A, with agentic workflows that monitor KPIs continuously and investigate anomalies without being prompted. Ask plain-English questions like "why did margin compress in Q3?" and get governed, cross-source answers instantly. Scored highest in this evaluation on root cause decomposition, conversational analytics, and agentic monitoring — replacing 3–5 days of manual pivot table work.
Best for lean FP&A teams: Cube — fast implementation, spreadsheet-native, conversational AI in Slack.
Best AI Tools for Financial Close and Accounting
The best AI tools for financial close focus on reconciliation, journal entries, footnote generation, and AR collections — not analytics.
Best for enterprise financial close: BlackLine — 4,400+ customers, 20+ year track record in SOX-compliant reconciliation and close automation. AI capabilities through its Verity suite include summarization agents, variance anomaly detection, and AI-assisted AR outreach.
Alternative: For organizations running Workday HCM, Workday Adaptive Planning includes integrated close and consolidation capabilities alongside FP&A.
Best AI Tools for Audit and Controls
The best AI audit tools apply machine learning to full transaction populations rather than traditional sampling — surfacing risk patterns that sampling-based approaches miss.
Best for AI-powered audit risk detection: MindBridge — full-population GL analysis, dynamic risk segmentation by subsidiary and user, GPU-accelerated anomaly detection. One published case surfaced $85M in mispostings missed by sampling.
Best for audit evidence extraction and management: DataSnipper — AI agents for document extraction in Excel, used by all Big 4 accounting firms. Best for audit teams that need automated evidence management and cross-referencing within existing Excel workflows.
Best AI Finance Analytics Platforms
Finance analytics platforms sit above planning and close tools in the analytical stack — they investigate why results changed rather than automating what happens before or after.
Best for automated variance investigation and agentic finance analytics: Tellius — scored highest in this evaluation on automated root cause decomposition, agentic KPI monitoring, conversational analytics, and CFO narrative generation. Deploys on top of your existing ERP and planning tools without replacing them.
Note: General-purpose LLMs (ChatGPT, Claude) provide NL analytics on uploaded data snapshots but lack governed data connections, audit trails, and finance-specific semantic understanding required for production finance analytics.
Best AI Tools for AP Automation
Best for intelligent AP invoice processing: Stampli — proprietary AI trained on 83M hours of AP data, 97–100% GL coding accuracy, deploys in days. Processes $105B+ in invoice volume annually.
Key Takeaways
Anaplan — Enterprise connected planning across finance, sales, and supply chain with 2,500+ customers and AI capabilities through CoPlanner, CoModeler, and Finance Analyst Agent. Where Anaplan stops: it does not automatically decompose variances into root causes or generate narratives from cross-source investigation. AI capabilities navigate Anaplan's own models, not your broader data estate.
Workday Adaptive — Integrated HCM-finance planning for organizations already on Workday, with emerging AI capabilities through Ask Workday, Intelligent Variance Analysis, and Planning Agent. Where Workday Adaptive stops: AI capabilities are early-stage and locked within the Workday ecosystem. Data outside Workday requires manual investigation.
The best AI tool for finance teams that need to understand why results deviated from plan automates the analytical investigation itself — combining automated variance decomposition, agentic KPI monitoring, conversational analytics, and board-ready narrative generation across every connected data source. Among the platforms evaluated here, Tellius scored highest on automated root cause analysis — and is one of the few platforms designed specifically for this investigative workflow rather than planning or close automation. Recognized as a Gartner Magic Quadrant Visionary five consecutive years (2022–2026). Trusted by Novo Nordisk, AbbVie, Regeneron, PepsiCo, and P&G. Where other platforms surface what changed in the P&L, Tellius is purpose-built to explain why — decomposing EBITDA misses, OPEX overruns, and margin compression into quantified drivers in seconds, not days — and delivers the answer as a finished artifact ready for the boardroom. Deploys in 8–12 weeks on top of your existing stack.
Pigment — Modern planning platform with agent-based variance analysis within its own models, though cross-source root cause decomposition and investigation outside Pigment's planning context require manual work.
Datarails — Excel-native FP&A with NL chat and AI-generated storyboards from consolidated finance data, though automated root cause analysis and agentic monitoring that watches for changes unprompted are absent.
Planful — Mid-market FP&A with anomaly detection that flags what changed, though analysts still spend 3–5 days decomposing why.
BlackLine — Financial close automation with summarization agents for reconciliation and AR workflows, though FP&A analytics and variance investigation are outside its scope.
Vena Solutions — Microsoft-ecosystem planning with NL agents that generate reports from planning data, though analytics remain within Vena's own models.
Cube — Lean, spreadsheet-native FP&A with conversational AI in Slack and Teams, though AI depth is limited to basic variance identification.
Microsoft 365 Copilot — Horizontal AI with finance agents for variance analysis in Excel, though it relies on general-purpose models without finance-specific semantic understanding.
MindBridge — AI risk detection with full-population transaction analysis (vs. traditional sampling), though focused on audit and controls rather than FP&A variance explanation.
DataSnipper — Audit automation with document extraction agents in Excel, though it has no analytics or planning capabilities.
Stampli — AP automation with a proprietary AI agent for invoice processing, though scope is strictly procure-to-pay.
ChatGPT / Claude — Strong NL and narrative generation from uploaded data snapshots, though no governed data connections, no audit trail, and no finance-specific semantic layer.
Platform Deep Dives
1. Anaplan — Enterprise Connected Planning Leader
Anaplan is an enterprise connected planning platform with AI capabilities spanning CoPlanner, CoModeler, Finance Analyst Agent, and Agent Studio. It is the most widely deployed enterprise planning platform in this comparison, with 2,500+ customers and recognition from major analyst firms.
Key capabilities:
- CoPlanner enables conversational access to model insights with guided recommendations
- CoModeler allows NL model building
- Finance Analyst Agent monitors performance and generates reports from scenario data
- Polaris engine for large-scale planning models
- Agent Studio for custom workflow automation
Where Anaplan excels:
Anaplan connects finance to sales, supply chain, and HR planning at Fortune 500 scale, with cross-functional planning model architecture built for complex enterprise environments.
Where Anaplan falls short:
The AI capabilities enhance navigation of Anaplan's own models — CoPlanner helps you ask questions of Anaplan data conversationally, not query your Snowflake warehouse or decompose why COGS spiked across three product lines. Finance Analyst Agent generates reports from Anaplan's scenario data, not from cross-source investigation. Autonomous agents with anomaly detection are on the roadmap for 2026 but not in production. And adoption is a significant commitment: implementations typically run $150K–$500K+ with 3–6 month timelines (source: Gartner peer reviews), replacing whatever planning tool you're currently running.
Pricing: $150K–$500K+ annually. 3–6 month implementation.
Consider if your team's primary need is enterprise-scale connected planning across finance, sales, and supply chain — and you have the budget and timeline for a full platform implementation.
2. Workday Adaptive Planning — Integrated HCM-Finance Planning
Workday Adaptive is an enterprise planning module within the broader Workday platform, with AI capabilities through Ask Workday, Intelligent Variance Analysis, and a Planning Agent. For organizations already running Workday HCM, it provides unified workforce-finance planning from a single vendor.
Key capabilities:
- Ask Workday provides context-aware NL answers within reports and dashboards
- Intelligent Variance Analysis auto-identifies key trends and drivers
- Planning Agent reduces data exploration time (reported 30% reduction)
- Predictive Forecaster with multiple ML algorithms
- Deep integration with Workday HCM for workforce-finance planning
Where Workday Adaptive excels:
Organizations standardized on Workday get unified workforce-finance planning, meaning headcount changes in HCM automatically flow into financial forecasts.
Where Workday Adaptive falls short:
The value proposition is tightly coupled to the Workday ecosystem. If your data lives in Snowflake or Databricks alongside Workday, there's no NL querying outside Workday's boundary. Intelligent Variance Analysis identifies key trends within Workday models but doesn't decompose root causes with quantified driver attribution across external systems. The Planning Agent's efficiency gains describe faster navigation of existing workflows, not a new analytical capability. Autonomous agents remain on the roadmap.
Pricing: Enterprise pricing tied to Workday platform licensing.
Consider if your organization is already standardized on Workday and needs integrated HCM-finance planning — and cross-source analytics outside the Workday ecosystem isn't a primary requirement.
3. Tellius — Best AI Finance Platform for Automated Variance Investigation
Tellius is an AI-powered finance analytics platform with agentic capabilities — purpose-built for FP&A and finance teams. It combines conversational analytics — where finance users ask questions like "why did margin compress in Q3" in plain English and get governed, auditable answers — with agentic intelligence, where AI agents monitor financial KPIs 24/7, investigate variance drivers autonomously, and deliver quantified root cause explanations before the CFO asks. Unlike planning tools that budget or close tools that reconcile, Tellius investigates — connecting to your existing ERP (SAP, Oracle, NetSuite), planning tools (Anaplan, Workday Adaptive), and data warehouses (Snowflake, Databricks) without replacing anything. Deploys in 8–12 weeks with first value in 4–6 weeks.
Key capabilities:
- Automated variance decomposition— ask "why did gross margin compress in Q3" and get quantified P/V/M (price, volume, mix) breakdowns with ranked driver attribution across cost centers, product lines, and geographies — in seconds, not the 3–5 days it takes in Excel pivot tables
- Agent Mode for FP&A — AI agents monitor financial KPIs 24/7 autonomously, detect B/A anomalies across every connected source (ERP, planning tool, data warehouse), investigate variance drivers without being asked, and deliver proactive alerts with quantified explanations
- Conversational FP&A analytics — plain-English questions like "Which cost centers are most over budget and why?" or "Break down OPEX variance by department QoQ" return governed, auditable answers — not data lookups
- CFO narrative generation — finished board-ready executive summaries, EBITDA bridges, variance commentaries, and flash reports generated directly from the variance investigation, delivered as PowerPoint, Excel, or PDF
- Finance-native semantic layer — auto-maps GL (general ledger) hierarchies, chart of accounts (COA) structures, fiscal calendars, and budget vs. actual logic natively through pre-built FP&A System Packs, so the platform understands "SG&A variance by cost center" without manual configuration
- Multi-source data unification — connects to ERP (SAP, Oracle, NetSuite, Dynamics), planning tools (Anaplan, Workday Adaptive, Planful), data warehouses (Snowflake, Databricks, BigQuery, Redshift), and CRM (Salesforce) simultaneously via live query or in-memory modes
- SOX-ready governance — same question, same answer, every time. Full audit trail, row-level security, SSO/SAML, data lineage tracking
- 8–12 week deployment — first value in 4–6 weeks. No data migration required. Sits on top of your existing finance stackt value in 4–6 weeks. No data migration required. Sits on top of your existing finance stack
Where Tellius excels:
Tellius is purpose-built to close the loop between variance detection and variance explanation — a gap that exists in every other platform on this list. Other tools surface what changed — Tellius is specifically designed to explain why, quantifying each contributing factor (pricing, volume, mix, geographic split, product line) and writing the narrative automatically. In this evaluation, it scored highest across root cause decomposition, agentic monitoring, conversational analytics, and narrative generation simultaneously. Recognized as a Gartner Magic Quadrant Visionary five consecutive years (2022–2026). Trusted by Novo Nordisk, AbbVie, Regeneron, PepsiCo, and P&G.
Where Tellius falls short:
Tellius is a Series B company with less brand recognition than incumbents like Anaplan or Workday. Organizations deep in vendor evaluation cycles with strict "top 3 Gartner vendors only" procurement policies may need internal sponsorship to evaluate. The initial configuration of the semantic layer and FP&A System Packs requires partnership with Tellius's deployment team — this isn't a self-serve sign-up-and-go experience. And while the platform excels at investigative analytics, it is not a planning tool — teams that need budgeting, forecasting, and scenario modeling still need their Anaplan or Workday Adaptive alongside Tellius, not instead of it.
Pricing: Custom enterprise pricing based on data volume and user count. Request a demo for specific pricing.
4. Pigment
Pigment is a business planning platform that uses agent-based architecture for financial planning, modeling, and variance analysis within its own models. Its Analyst Agent, Planner Agent, and Modeler Agent automate work across planning workflows.
Key capabilities:
- Analyst Agent reviews data, detects trends, and generates written summaries from plan/actual data
- Planner Agent suggests revised plans and runs scenarios on updated assumptions
- Predictive forecasting with ML-based scenario modeling
- Consolidation Agent for financial close within Pigment
Where Pigment excels:
Pigment handles variance analysis within its planning context and has strong momentum — noted by Dresner for EPM capabilities, with customers including Unilever and Siemens.
Where Pigment falls short:
Pigment's analytical power is bounded by Pigment's own data. When margin compression spans ERP, CRM, and supply chain data simultaneously, the Analyst Agent can only explain the portion visible inside Pigment's planning models — the rest requires your team to investigate manually across systems. Pigment also replaces your current planning tool rather than layering on top, which means a full migration with associated implementation risk and timeline.
Pricing: Enterprise pricing, reportedly $100K+ annually at scale.
Consider if your team's primary need is AI-powered scenario modeling within a single planning tool — and automated cross-source root cause decomposition or deployment on top of your existing stack aren't part of your evaluation criteria.
5. Datarails
Datarails is an FP&A platform designed for teams that live in Excel, with AI capabilities through its FP&A Genius suite — Chat, Insights, and Storyboards.
Key capabilities:
- Chat by Genius answers budget/forecast/variance questions from consolidated finance data
- Storyboards convert financial data into presentation-ready narratives
- Scheduled AI-generated summaries at set cadences
- 200+ ERP/CRM integrations with full Excel formula preservation
Where Datarails excels:
Datarails preserves existing Excel workflows while adding NL querying and AI-generated board decks from consolidated data. For teams where Excel is non-negotiable, Datarails meets them where they are.
Where Datarails falls short:
Genius Chat answers questions about data already consolidated into Datarails — it surfaces what's in the system, not why the business shifted. When revenue drops 12% in the Southeast, your team still decomposes the drivers manually in pivot tables. Insights delivers scheduled summaries at cadences you configure, but it doesn't detect anomalies you haven't anticipated or investigate root causes autonomously. There's no finance-native semantic layer that understands GL structure without manual configuration.
Pricing: Not publicly transparent. Reportedly mid-market pricing (source: G2 Datarails reviews).
Consider if your team's primary need is NL chat on consolidated Excel data and automated board decks — and automated variance decomposition or proactive anomaly monitoring aren't part of your evaluation criteria.
6. Planful
Planful is an FP&A and close platform with proprietary AI through Predict Signals, Predict Projections, and an Analyst Assistant.
Key capabilities:
- Predict Signals: ML anomaly detection across budget/forecast data with risk categorization
- Analyst Assistant: NL queries with role-aware, explainable answers
- Predict Projections: AI-generated baseline forecasts from historical data
- Combined budgeting, reporting, and close in one platform
Where Planful excels:
Planful combines FP&A and close processes with proprietary AI models (not off-the-shelf LLMs), serving the mid-market effectively.
Where Planful falls short:
Signals is a detection layer — it flags that something changed and categorizes severity, detecting anomalies in 89% of GL combinations in one published case study. But detection and investigation are different capabilities. Knowing that margin compressed is step one; knowing that 60% came from raw material costs in the Southeast and 40% from pricing concessions to a key distributor is the step that takes 3–5 days. Planful handles the first step. The second step is still your team's job. Monitoring stays within Planful's own data, with no cross-source querying.
Pricing: Mid-market enterprise pricing.
Consider if your team needs combined budgeting and close with anomaly detection — and automated variance decomposition or cross-source analytical investigation aren't part of your evaluation criteria.
7. BlackLine
BlackLine is a financial close automation platform with AI capabilities through its Verity suite — including Flux, Insights, Prepare, Collect, and Summarization Agents. It acquired WiseLayer in December 2025 for judgment-based AI in accruals and payroll.
Key capabilities:
- Verity Flux accelerates variance analysis within close workflows
- Summarization Agents generate executive summaries from financial statements
- Variance Anomaly Detection Agent for close data
- Auto-reconciliation and autonomous AR outreach through Verity Collect
Where BlackLine excels:
BlackLine handles financial close automation at enterprise scale with deep SOX compliance and a 20+ year track record in reconciliation and journal entry workflows.
Where BlackLine falls short:
BlackLine's scope is the close cycle — reconciliation, journal entries, footnote generation, AR collections. It doesn't venture into FP&A territory. Ask why gross margin dropped 300 basis points across your product portfolio and you've left BlackLine's domain entirely. Verity Insights provides NL queries on close and AR data only. There's no root cause decomposition, no conversational analytics across data sources, no finance-native semantic layer. Pricing runs $150K–$500K+ annually for mid-market implementations (source: G2 BlackLine pricing).
Pricing: $150K–$500K+ annually.
Consider if your primary need is enterprise financial close automation with SOX compliance — and FP&A analytics or automated root cause investigation aren't part of your evaluation criteria.
8. Vena Solutions
Vena Solutions is an Excel-based planning platform with AI capabilities through Vena Copilot, which orchestrates Reporting, Planning, and Analysis Agents. It acquired Acterys in February 2026.
Key capabilities:
- NL queries in the Vena platform and Microsoft Teams with context-aware FP&A responses
- Planning Agent creates driver-based plans and predictive forecasts from chat (beta)
- Auto-generates presentation-ready reports in PowerPoint
- Built on Microsoft Azure OpenAI with Teams integration
Where Vena excels:
Vena provides Microsoft-ecosystem integration with NL agents and reported 60% budgeting cycle reduction in Planning Agent beta.
Where Vena falls short:
Vena's AI generates summaries and reports from what Vena already contains — it doesn't investigate what Vena doesn't know. A CFO asking "why did margins compress" gets a presentation showing that they compressed, not a decomposition of contributing factors from ERP and supply chain data outside Vena's boundary. The Planning Agent remains in beta. Analytics stay within Vena's own planning data.
Pricing: Mid-market enterprise pricing. 2,000+ customers.
Consider if your team lives in Microsoft 365 and needs Excel-native planning with Teams-integrated NL chat — and automated cross-source variance investigation or agentic monitoring aren't part of your evaluation criteria.
9. Cube
Cube is an agile FP&A platform with conversational AI capabilities accessible through Slack and Teams.
Key capabilities:
- NL queries via Slack and Teams for budget and performance questions
- Smart Variance Analysis
- AI-based forecasting from historical data
- Spreadsheet-native data mapping and reporting
Where Cube excels:
Cube offers fast implementation for lean finance teams that need spreadsheet-native FP&A without enterprise-scale complexity. Deployment is measured in weeks, not months.
Where Cube falls short:
AI capabilities are functional but shallow — basic variance identification and forecasting within Cube's models, without the depth for quantified driver decomposition or multi-source correlation. There's no proactive monitoring, no narrative generation, and no finance-native semantic layer. Agentic AI apps are in beta. The platform serves SMB and mid-market well but hits a ceiling when the analytical questions get complex.
Pricing: Mid-market pricing. ~300 customers.
Consider if your team needs fast, spreadsheet-native FP&A for basic budgeting and forecasting — and automated root cause analysis or agentic intelligence aren't part of your evaluation criteria.
10. Microsoft 365 Copilot (Finance Agents)
Microsoft 365 Copilot adds finance-specific agents — Variance Analysis, Reconciliation, and Collections — to Excel and the broader M365 ecosystem. These are not a standalone finance product; they're capabilities within the M365 Copilot license.
Key capabilities:
- NL-driven variance analysis in Excel that identifies outliers and explains key drivers
- Financial Reconciliation Agent compares data sources for discrepancies
- Collections Agent prioritizes AR outreach with personalized communications
- No-code agent creation via Copilot Studio
Where M365 Copilot excels:
For teams already paying for M365 Copilot licenses, finance agents add analytical capability without new vendor adoption or procurement cycles. Distribution is its biggest advantage.
Where M365 Copilot falls short:
The finance agents are a general-purpose LLM applied to financial data in Excel. Each agent operates within its own spreadsheet context, not across a unified data model. There's no finance-native semantic layer understanding your GL hierarchies, fiscal calendars, or chart of account structures — every query starts from a spreadsheet, not from a persistent model of your financial data. Variance "explanations" identify what changed but don't automatically decompose why across multiple sources with quantified attribution. Requires M365 Copilot license plus ERP connection (Dynamics 365 or SAP bridge).
Pricing: Requires M365 Copilot license ($30/user/month) plus ERP connectivity.
Consider if your team is already fully invested in Microsoft 365 and needs incremental AI capability in Excel — and purpose-built variance decomposition or cross-source analytical intelligence aren't part of your evaluation criteria.
11. MindBridge
MindBridge is a financial risk and anomaly detection platform that uses ensemble AI to analyze full populations of transactions — replacing traditional sampling-based audit approaches.
Key capabilities:
- Full-population risk scoring across general ledger entries (vs. traditional sampling)
- Dynamic risk segmentation by subsidiary, user, and cost center
- GPU-accelerated anomaly detection
- Integrations with Databricks, Microsoft Fabric, and Snowflake
Where MindBridge excels:
MindBridge provides full-population audit coverage that replaces sampling — one published case uncovered $85M in mispostings that sampling-based approaches missed.
Where MindBridge falls short:
MindBridge serves audit and internal controls, not FP&A. Its output is a prioritized risk list for human investigators — it flags unusual GL transactions with risk scores but doesn't decompose why an anomaly occurred or investigate business drivers. There are no conversational analytics, no narrative generation, no planning capabilities.
Pricing: Enterprise pricing. Global partnership with Genpact announced February 2026.
Consider if your primary need is AI-powered audit risk detection using full-population analysis — and FP&A analytics or variance explanation aren't part of your evaluation criteria.
12. DataSnipper
DataSnipper is an audit automation platform with AI agents that operate within Excel for document extraction, cross-referencing, and validation — with all Big 4 accounting firms as customers.
Key capabilities:
- AI Agents follow multi-step audit workflows in Excel
- DocuMine: AI-powered document analysis
- AI Extractions: convert unstructured documents to structured Excel data
- Full traceability and evidence linking for audit work
Where DataSnipper excels:
DataSnipper handles audit-specific extraction and validation workflows in Excel, with all Big 4 firms as customers.
Where DataSnipper falls short:
DataSnipper's domain is audit testing — extraction, cross-referencing, validation within Excel. It doesn't analyze financial performance or answer questions about why business results changed. DocuMine answers questions about document content, not about data patterns across systems. There are no data connections for analytical queries, no planning capabilities, no NL analytics.
Pricing: Enterprise pricing. Valued at $1B+ following a $100M Series B.
Consider if your primary need is audit automation and document evidence management in Excel — and FP&A analytics or variance investigation aren't part of your evaluation criteria.
13. Stampli
Stampli is an AP automation platform powered by Billy the Bot — a proprietary AI agent trained on 83 million hours of accounts payable data for end-to-end invoice processing.
Key capabilities:
- Intelligent GL coding and PO matching (97–100% accuracy reported)
- Duplicate detection and automated approval routing
- Processes $105B+ in invoice value annually
- Proprietary business reasoning model (not an off-the-shelf LLM)
Where Stampli excels:
Stampli's proprietary AI is trained on AP-specific user actions rather than a generic LLM, and the platform deploys in days.
Where Stampli falls short:
AP is the boundary. Stampli processes invoices with high reported accuracy, but it has no concept of financial planning data, revenue performance, or variance analysis. Billy operates autonomously within the procure-to-pay workflow — and nowhere else. There are no analytics, no NL querying of financial data, no narrative generation, no cross-source intelligence.
Pricing: Per-invoice or per-user pricing. 1,700+ customers. Deploys in days.
Consider if your primary need is AP automation with intelligent invoice processing — and financial analytics or variance investigation aren't part of your evaluation criteria.
14. General-Purpose LLMs (ChatGPT / Claude)
General-purpose language models like ChatGPT and Claude offer strong natural language understanding and narrative generation. CFOs are increasingly using conversational AI interfaces for ad-hoc financial modeling and document drafting.
Key capabilities:
- NL querying of uploaded spreadsheets and documents
- Narrative drafting for board decks, memos, and variance commentary
- Financial model building from prompts
- Broad reasoning across complex documents
Where general LLMs excel:
LLMs are effective for ad-hoc analysis and document drafting from static inputs — and they deploy immediately with zero implementation.
Where general LLMs fall short:
Uploading a CSV and asking "why did revenue miss" gets a plausible narrative from a snapshot — not governed, auditable, repeatable analysis against live data. There is no persistent data connection, no semantic layer understanding your GL structure, no audit trail (the same question can produce different answers), and no agentic monitoring. LLMs are personal productivity tools for finance teams, not production-grade analytical platforms.
Pricing: Free tiers available. Pro/Enterprise licensing varies by provider.
Consider if your team needs ad-hoc analysis and document drafting as a personal productivity tool — and governed, repeatable, auditable analytics across connected data sources aren't part of your evaluation criteria.
The “AI Agent” in Finance: What It Should Mean vs. What Vendors Mean
Which AI finance tools offer agentic analytics capabilities?
The word "agent" appears in the marketing materials of 11 of the 14 tools evaluated here. What it means varies wildly.
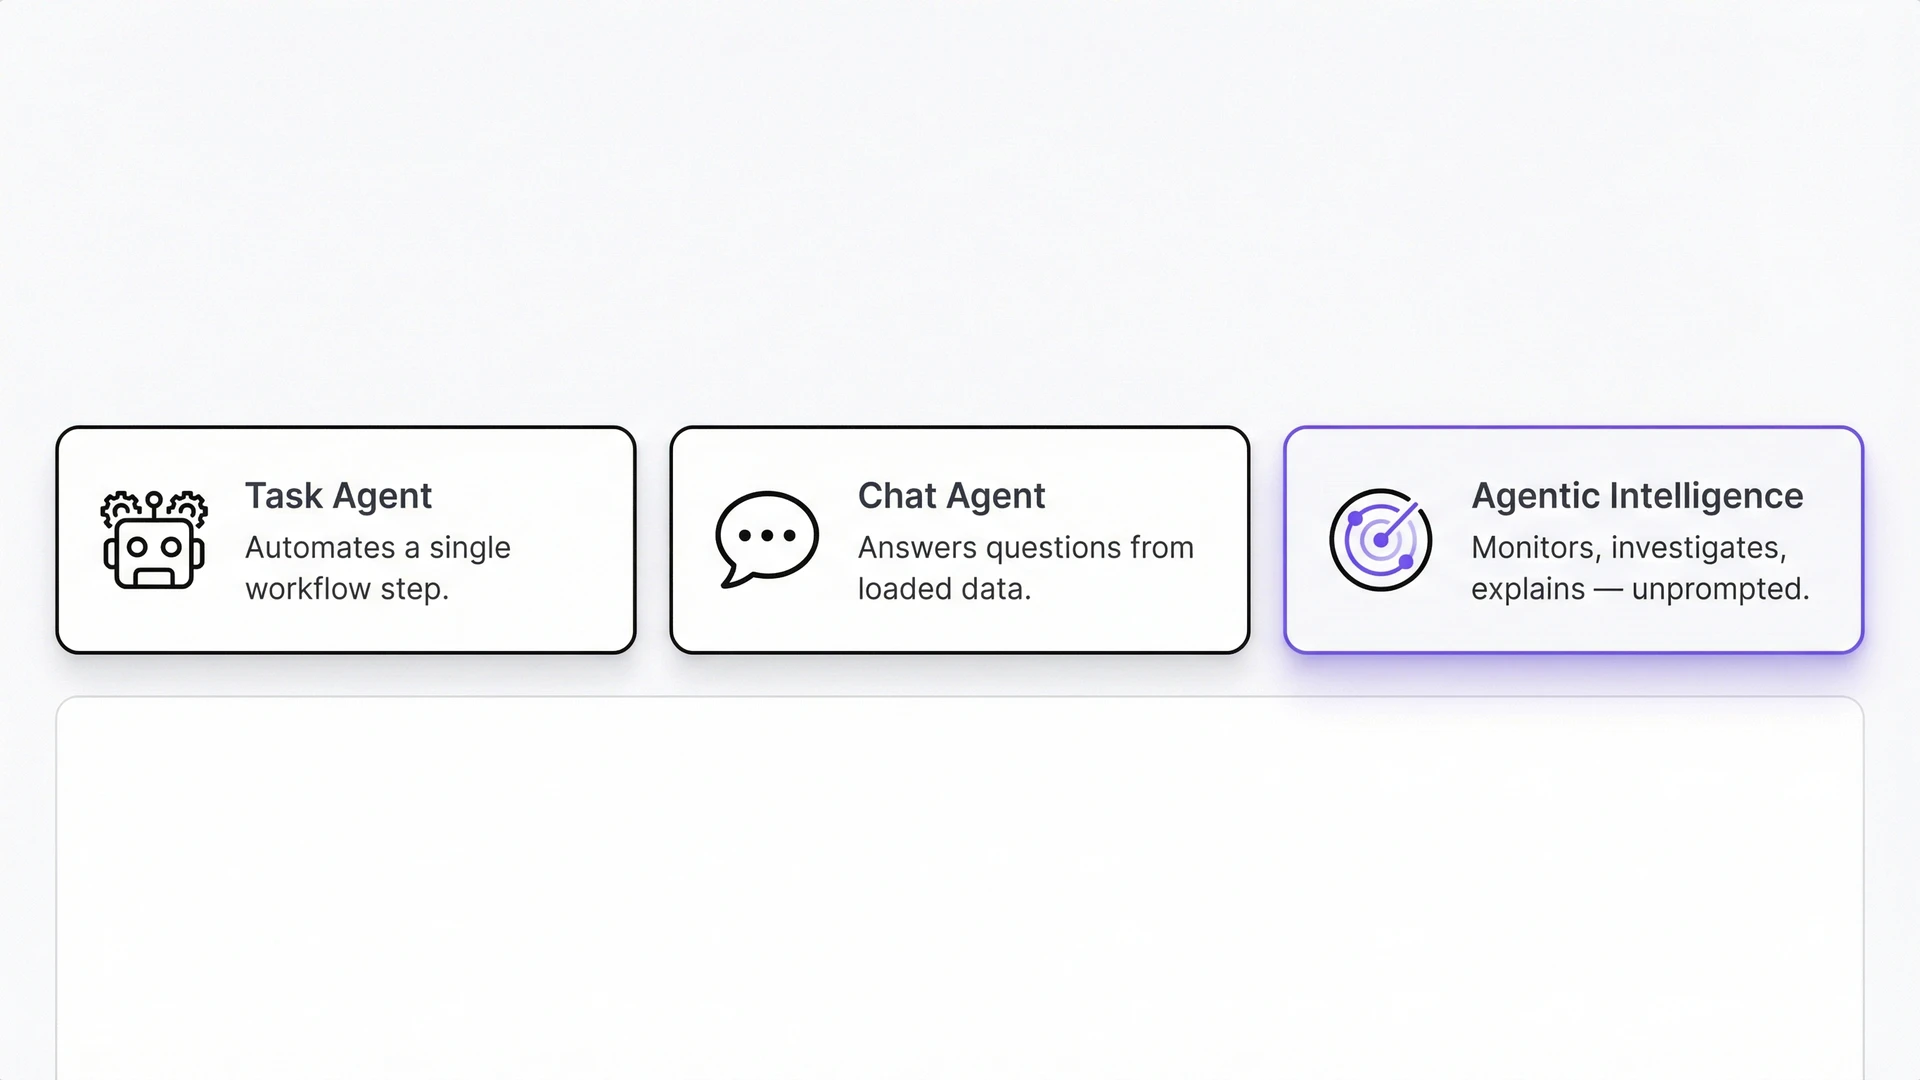
For Stampli, "agent" means Billy the Bot processes invoices autonomously within the AP workflow. For DataSnipper, agents follow pre-defined multi-step audit workflows in Excel. For Anaplan, Finance Analyst Agent generates reports from scenario data. For Vena, agents create forecasts from chat input. For BlackLine, Summarization Agents write footnotes from reconciliation data. These are all legitimate capabilities — but they describe process automation within a specific workflow, not autonomous analytical intelligence across your data estate.
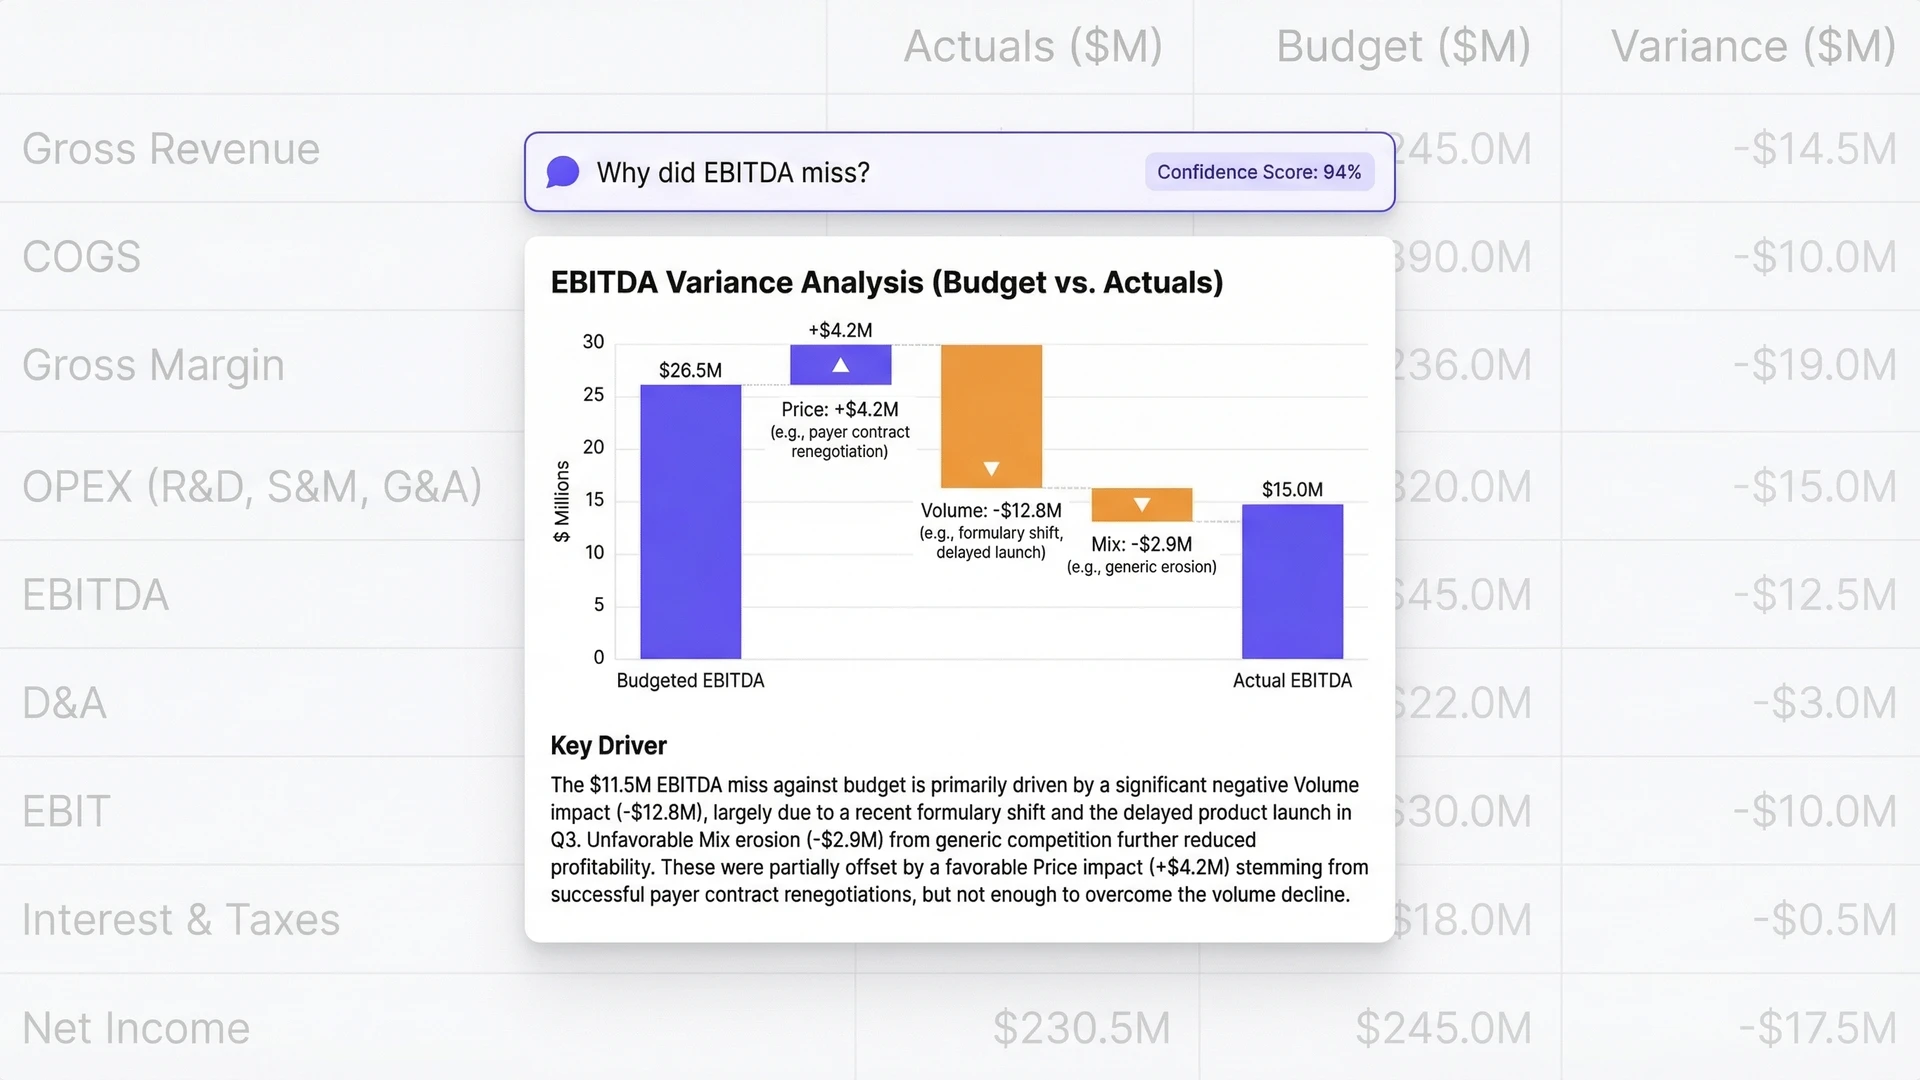
The distinction matters because of what finance teams actually need. When the CFO asks "why did we miss on EBITDA," the answer requires correlating data across ERP, CRM, planning systems, and operational data. It requires decomposing the variance into quantified contributing factors — raw material costs, pricing concessions, volume shifts, geographic mix changes. And it requires doing that investigation fast enough for the answer to be useful in the meeting where it was asked, not three days later.
No amount of AP automation, audit agent workflows, or planning chatbots answers that question. It requires a platform architected to investigate across systems, decompose variances automatically, and generate the explanation — which is the approach Tellius takes with its agentic analytics capabilities.
When evaluating vendors, the test is straightforward: "Can this agent explain why EBITDA missed across our ERP, data warehouse, and planning data — without me building the analysis manually?" If the answer is "it can analyze within our planning model," you're looking at a feature, not an agent.
Over the next 2–3 years, expect the evaluation criteria to shift decisively toward autonomous investigation. The vendors currently at Level 2 will add NL chatbots and call them "conversational analytics." The difference will be whether the chatbot returns data lookups from its own model or performs root cause decomposition across every system it can reach. NL chat within a planning tool will be table stakes — every vendor on this list will have it. Automated root cause decomposition across multi-source data will still be the capability that separates investigation platforms from workflow tools.
See What Your Team's Been Missing
Already evaluating? Start a free trial → | Explore the platform → | Finance solutions →
Get release updates delivered straight to your inbox.
No spam—we hate it as much as you do!


Workday Adaptive is an enterprise planning module optimized for organizations running Workday HCM. Tellius is an AI-powered finance analytics platform that investigates why results deviate from plan across every connected data source. Workday Adaptive’s AI capabilities operate within the Workday ecosystem. Tellius connects to Workday, your ERP, your data warehouse, and your CRM to decompose variances across system boundaries. The two tools are complementary for organizations that need both workforce-finance planning and cross-source analytical investigation.
Datarails FP&A Genius Chat answers questions from data already consolidated into Datarails. Tellius auto-decomposes variances into quantified root causes across every connected source — performing the investigation that Datarails leaves to your team. Datarails wins on Excel preservation. Tellius wins on analytical depth and cross-source investigation.
M365 Copilot applies a general-purpose LLM to Excel data; Tellius is a purpose-built finance analytics engine with a finance-native semantic layer. Copilot identifies what changed in a spreadsheet. Tellius decomposes why it changed across your ERP, data warehouse, and planning systems with governed audit trails and 24/7 agentic monitoring. The two are complementary — Copilot for lightweight Excel tasks, Tellius for analytical investigation.
Pigment’s agents analyze within Pigment’s planning models — finding what changed in plan vs. actual within Pigment data. Tellius connects to Pigment, your ERP, your data warehouse, and your CRM to decompose variances that cross system boundaries. The two tools are complementary: Pigment for agent-based planning, Tellius for cross-source investigation.
Tellius is specifically designed to deploy on your existing stack — it connects to SAP, Oracle, NetSuite, Anaplan, Workday Adaptive, Snowflake, Databricks, and 30+ other sources without replacing anything. Most other tools in this comparison are the stack — adopting Anaplan means replacing your current planning tool, adopting BlackLine means replacing your current close tool.
Copilot adds lightweight AI assistance within Excel for M365 license holders. If your team’s question is “what changed,” Copilot helps. If your question is “why did it change, across all our data, with governed audit trails and proactive monitoring,” you need a purpose-built platform. The two serve different depth levels and can be used together.
CFO narrative generation — automatically producing board-ready executive summaries, EBITDA bridges, and variance commentaries — requires the platform to first investigate what happened and why. Tellius generates narratives directly from its automated variance investigation, delivered as PowerPoint, Excel, or PDF. Datarails generates storyboards from consolidated data. BlackLine generates summaries from close data. LLMs generate narratives from uploaded snapshots. The distinction is whether the narrative comes from investigation or from summarizing data you’ve already prepared.
The best AI tool for finance teams depends on your primary need. For enterprise-scale connected planning, Anaplan has the broadest deployment base. For integrated HCM-finance planning within the Workday ecosystem, Workday Adaptive provides unified workforce-finance data. For understanding why results deviated from plan — with automated root cause decomposition, agentic monitoring, conversational analytics, and board-ready narrative generation across every connected data source — Tellius is the only platform that delivers all four capabilities in production today. Most enterprise finance teams benefit from a combination of tools.
A finance semantic layer is a metadata model that maps GL hierarchies, chart of accounts structures, budget vs. actual logic, and fiscal calendars so that analytical queries like “SG&A variance by cost center” resolve to the correct accounts and periods without manual configuration. Tellius is the only platform in this comparison with a finance-native semantic layer that auto-maps these structures through pre-built FP&A System Packs. Planning tools have their own model structures, but those are closed systems. General-purpose LLMs have no persistent understanding of your financial data model.
Tellius and Anaplan serve different functions and are complementary, not competitive. Anaplan is the market-leading connected planning platform — it budgets, forecasts, and models scenarios across finance, sales, and supply chain. Tellius is an AI-powered finance analytics platform that investigates why results deviate from plan. Tellius deploys on top of Anaplan — querying across Anaplan, your ERP, and your data warehouse to decompose variances that Anaplan’s agents cannot reach.
Tellius uses custom enterprise pricing based on data volume and user count — request a demo for specifics. For context: Anaplan runs $150K–$500K+ annually with 3–6 month implementations. BlackLine is $150K–$500K+ for mid-market. Microsoft Copilot requires $30/user/month for M365 Copilot plus ERP bridge licensing. General LLMs range from free to $20-60/user/month but provide no governed analytics capability.
Start with the time your team currently spends on ad-hoc variance investigation — if that number is measured in days per close cycle, the ROI calculation is straightforward. Multiply the number of variances investigated per quarter by the analyst hours per investigation, and that's the capacity returned to your team. Tellius customers report root cause investigation time dropping from 3–5 days to seconds, business review preparation from 14 days to 2 days, and 30–40% of analyst capacity freed for strategic work. Typical payback period is 6–9 months, with first value delivered in 4–6 weeks.
The analytical value of cross-source investigation depends on having access to all relevant data, not just what one system contains. Tellius connects to ERP systems (SAP, Oracle, NetSuite), planning tools (Anaplan, Workday Adaptive, Planful), data warehouses (Snowflake, Databricks, BigQuery, Redshift), CRM (Salesforce), and operational systems simultaneously.
Tellius provides SOX-ready governance with full audit trails, row-level security, SSO/SAML, and repeatable outputs — the same question always produces the same answer with full data lineage. BlackLine, DataSnipper, MindBridge, Anaplan, Workday Adaptive, and the enterprise planning platforms also provide strong governance. General-purpose LLMs (ChatGPT, Claude) do not provide auditable, repeatable outputs and should not be used for SOX-regulated analysis.
Ask every vendor on your shortlist: "Show me how your platform decomposes a budget variance into root causes across multiple data sources." If the demo requires an analyst to manually investigate, you're evaluating a workflow tool, not an analytics platform. Then ask: "Does this run 24/7 without someone asking a question?" If the answer involves a chatbot waiting for input, you're evaluating Level 2, not Level 4. Schedule a Tellius demo to see automated root cause decomposition in action.
AI forecasting tools predict future numbers based on historical patterns — capabilities within Anaplan, Planful, Cube, and Workday Adaptive. AI analytics investigates why actual results deviated from plan. Both are valuable, but they solve different problems. Forecasting helps you set better targets. Analytics helps you understand why you missed them. Most planning platforms include forecasting. Almost none include automated root cause investigation.
AI finance tools don't replace finance analysts — they automate the investigative work that currently consumes the majority of their time. Root cause decomposition, variance investigation, and ad-hoc reporting requests are the tasks that keep analysts from strategic work. When those tasks are automated, analysts shift from data wrangling to decision support. Organizations using Tellius report 30–40% of analyst capacity freed for strategic initiatives.
Tellius provides enterprise-grade security including SOC 2 Type II certification, SSO/SAML authentication, row-level security, AWS PrivateLink and Azure PrivateLink for private connectivity, and data encryption at rest and in transit. Data can be queried in live mode without ingestion, meaning sensitive financial data stays in your existing infrastructure. Enterprise planning platforms (Anaplan, Workday, BlackLine) also provide strong security frameworks. General-purpose LLMs pose the highest security concern — data uploaded to ChatGPT or Claude is processed outside your governance perimeter.
Tellius deploys in 8–12 weeks with first value typically delivered in 4–6 weeks. No data migration is required — the platform connects to your existing infrastructure and queries data in place. This compares to 3–6 months for enterprise planning tools like Anaplan and 12–18 months for custom-built solutions.
What Is AI-Powered Financial Analytics? 2026 Guide
AI-powered financial analytics is transforming how finance teams analyze performance, forecast outcomes, and explain business results. Instead of relying on manual spreadsheets and static dashboards, modern AI analytics platforms use machine learning, natural language interfaces, and automated analysis to uncover the drivers behind financial metrics in seconds. This guide explains how AI-powered financial analytics works, the core technologies behind it, and how finance teams use it for tasks like variance analysis, forecasting, anomaly detection, and executive reporting. It also explores how AI shifts finance from reactive reporting to proactive, insight-driven decision-making by automatically identifying trends, investigating root causes, and generating clear explanations of what’s impacting business performance.