

Manufacturing variance analysis: how to recover lost margin

Your variance commentary is perfect. Your margin is still gone.
Manufacturing variance analysis explains the difference between standard and actual production cost by separating material price, material usage, yield, scrap, labor, and overhead drivers. Explanation debt begins when those drivers are documented in the close but do not become owned corrective actions. The same cost then returns next month with a familiar explanation underneath it.
Consider an illustrative quarter with a $3.2 million unfavorable manufacturing variance. Finance can reconcile the bridge to the dollar, identify material usage at one plant, and write commentary leadership accepts. Those steps do not change the yield on Monday's production run.
An October 2024 FP&A discussion captured the habit in miniature. An analyst asked for more reasons to keep "up their sleeve" for actual-versus-budget variances. The most popular answer was "Timing difference," followed by "Phasing always". Another commenter objected that FP&A involves analysis rather than excuses.
They disagreed about what finance owes the business, but both were describing the same operating loop. Gross margin misses plan. Finance builds the bridge, finds the driver, and adds two clean sentences to the deck. Leadership accepts the explanation and moves on. Three months later, the same plant and often the same part appear on the next bridge.
Explanation debt is the accumulating value of variances that have been explained but not converted into an owned response. The debt grows when a recoverable driver remains open. The organization pays through another week of scrap, another supplier overcharge, or another production run below standard yield.
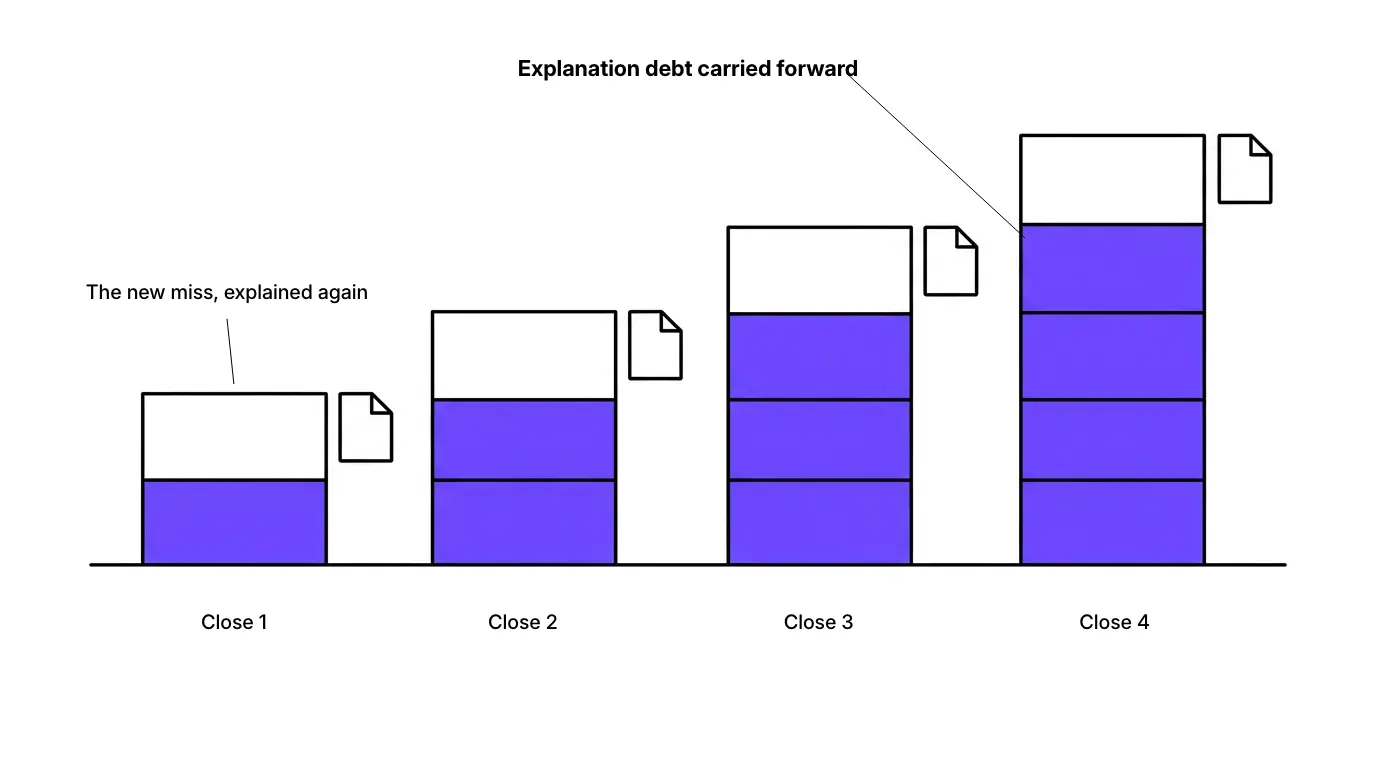
How explained variance turns into explanation debt
Variance analysis was designed as a control. It compares what production should have cost with what it did cost, then decomposes the gap far enough to expose the operating cause. Standard costing, purchase price variance, yield analysis, and the margin bridge already do useful work. Any recovery method that ignores those controls will lose the finance team before the first plant review.
The break occurs after the explanation. A line called "material usage, unfavorable" has no owner by job title. A plant-costing practitioner gives a useful example: route the variance to the shift supervisor whose scrap rate moved or the buyer who approved a substitute material. Otherwise, the report becomes a monthly ritual with no behavioral consequence.
The number and the fix also live in different systems. Finance computes the variance in the ERP and works the bridge in a spreadsheet. Engineering may record the root cause in a quality system. Procurement handles a supplier claim through email or its sourcing platform. No durable record connects the variance, the affected part and work orders, the corrective action, the expected dollar relief, and the date.
Stale standards make the handoff worse. One manufacturing accountant described a company that stopped rolling material, labor, and overhead standards after an ownership change. Price and production variances accumulated until they became an "almost meaningless pile of noise". The team then forecast the variances and explained the variance to that forecast. The financial impact remained real, but spreading it across thousands of products made the operating signal hard to use.
Capacity runs out before anyone closes the loop. In a joint AFP and APQC study, finance teams spent 42% of their time collecting and validating data and another 33% administering the process. Only 25% remained for value-added analysis. The combined 75% was only two points better than the same measure in 2010. (APQC)
Newer surveys tell a similar story. The 2024 FP&A Trends research found that 35% of FP&A time went to insight generation and action. Its 2025 survey put data collection and validation at 46%, while only 17% of organizations rated their data quality as good. (2024 survey, 2025 survey) A team that spends close week reconciling data has little time left to check whether the plant fix changed the next production run.
The cost reaches beyond the original miss
An untreated yield problem keeps consuming material. The next forecast has to carry the cost forward or assume a recovery with no owner. When the same explanation reaches leadership again, the review shifts from "what happened?" to "why is this still happening?" Finance usually gets that question even when the repair belongs to engineering or operations.
Review time can also move toward the loudest variance instead of the largest recoverable one. A $500,000 commodity pass-through may be unavoidable under the contract, while a $90,000 invoice error is recoverable. Ranking both as unfavorable purchase price variance hides the claim inside the market movement.
This distinction matters when input costs move for months at a time. The ISM Prices Index registered 58.5 in December 2025, its fifteenth consecutive month of rising raw-material prices. ISM attributed the run in part to higher steel and aluminum prices moving through the value chain and tariffs on imported goods. (National Association of Manufacturers summary of the December 2025 ISM report) A standard set near the start of that run can be wrong in the same direction for more than a year.
Some of that purchase price variance belongs in the forecast. Some may be a contract claim. The Bureau of Labor Statistics guidance on price-adjustment clauses shows why the distinction requires contract detail: the agreement needs to name the index, the base period, the adjustment frequency, and the calculation method. Finance cannot separate a valid index pass-through from an overbilling by looking at the standard cost alone.
Faster explanation leaves the debt in place
Modern analysis can test drivers across many dimensions and rank them by contribution faster than a team working through pivot tables. That speed matters during close. It creates more time to act, but it does not create the action.
AI analytics for finance can isolate the plant, product family, part, supplier, or work order behind a miss. A recovery workflow has to carry that finding into a different set of records: the owner, the response, the expected relief, the target date, and the evidence used to estimate it. It also needs a forward view of margin if the action lands and if it slips.
Variance monitoring and variance recovery therefore run on different clocks:
Early warning is valuable because it preserves the intervention window. An alert that ends in commentary only adds speed to the same explanation debt.
The data has to meet at the grain of the fix
The recovery loop cannot run on a monthly manufacturing-variance total. A price-volume bridge by product family needs revenue and cost below the family rollup. Usage and yield need part, plant, and work-order detail matched to the standard in effect for that period. Purchase price analysis needs invoice lines joined to contract terms and the relevant commodity index.
Those sources rarely line up on their own. Standards change midyear. Plants run different ERP instances. Purchasing and engineering use different identifiers for the same part. The general ledger closes on a different schedule from the manufacturing and purchasing subledgers. A polished bridge built on mismatched grain will survive until the plant finds the first number it cannot reproduce. Then the meeting becomes a reconciliation exercise again.
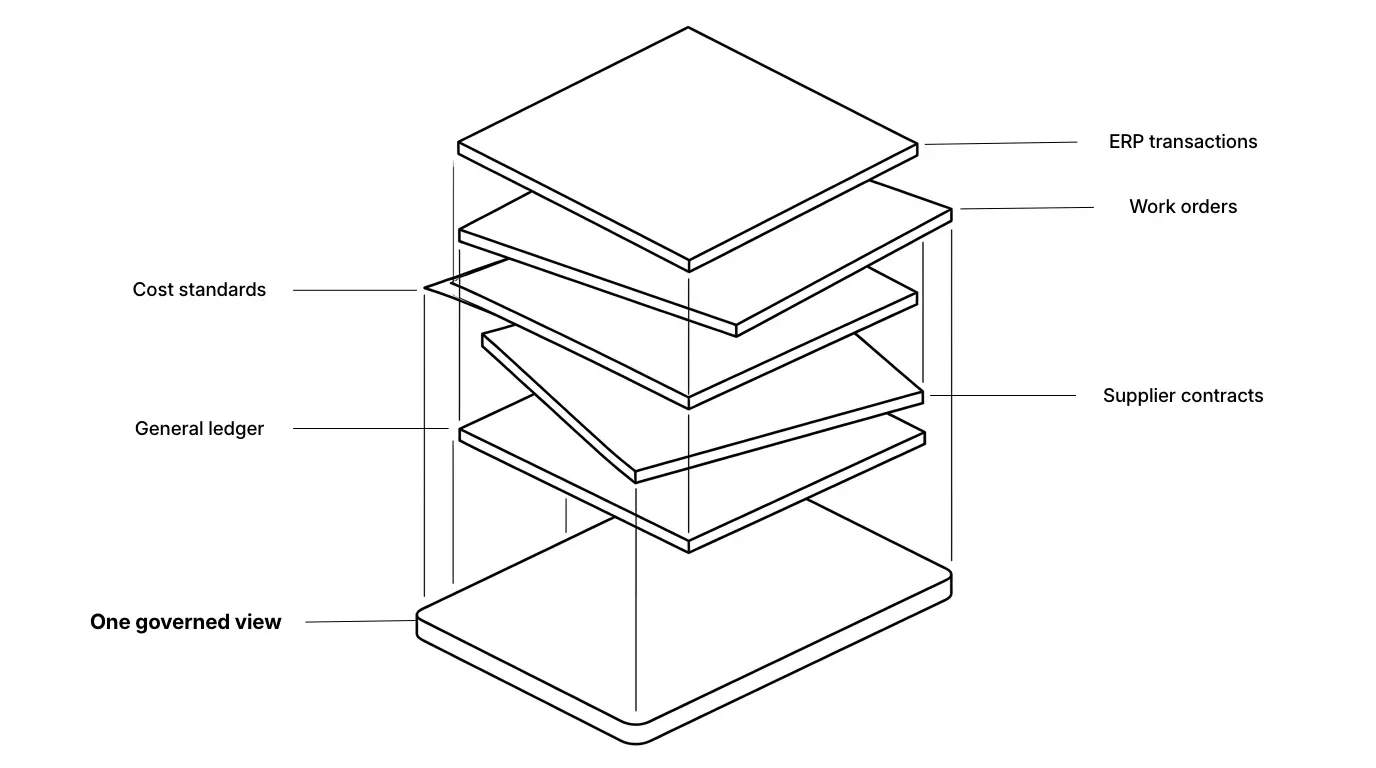
Finance and operations need views computed from the same underlying rows. The engineer can work in yield, scrap units, and cost per part while finance sees gross-margin impact. Shared lineage removes the data dispute and leaves the useful argument: what changed, whether it is recoverable, and what the organization will do about it.
Watch the variance-to-recovery workflow
The walkthrough follows one illustrative Q3 margin miss from the P&L to part LA-238, then into committed relief and a recovered-margin outlook. It begins with the work required to make the analysis credible: connecting ERP, work-order, standards, contract, and supplier data at compatible grain. The app is described in plain English and built on that governed model before the workflow runs.
The Mission and the App have separate jobs. A Mission repeats the investigation against fresh close data and delivers the result. The App gives finance, engineering, supply chain, and operations a shared place to inspect drivers, commit fixes, and track recovery. The figures are illustrative.
The five steps from variance to recovered margin
The operating loop is Explain → Classify → Own → Commit → Recover. Each step creates a record the next step can use.
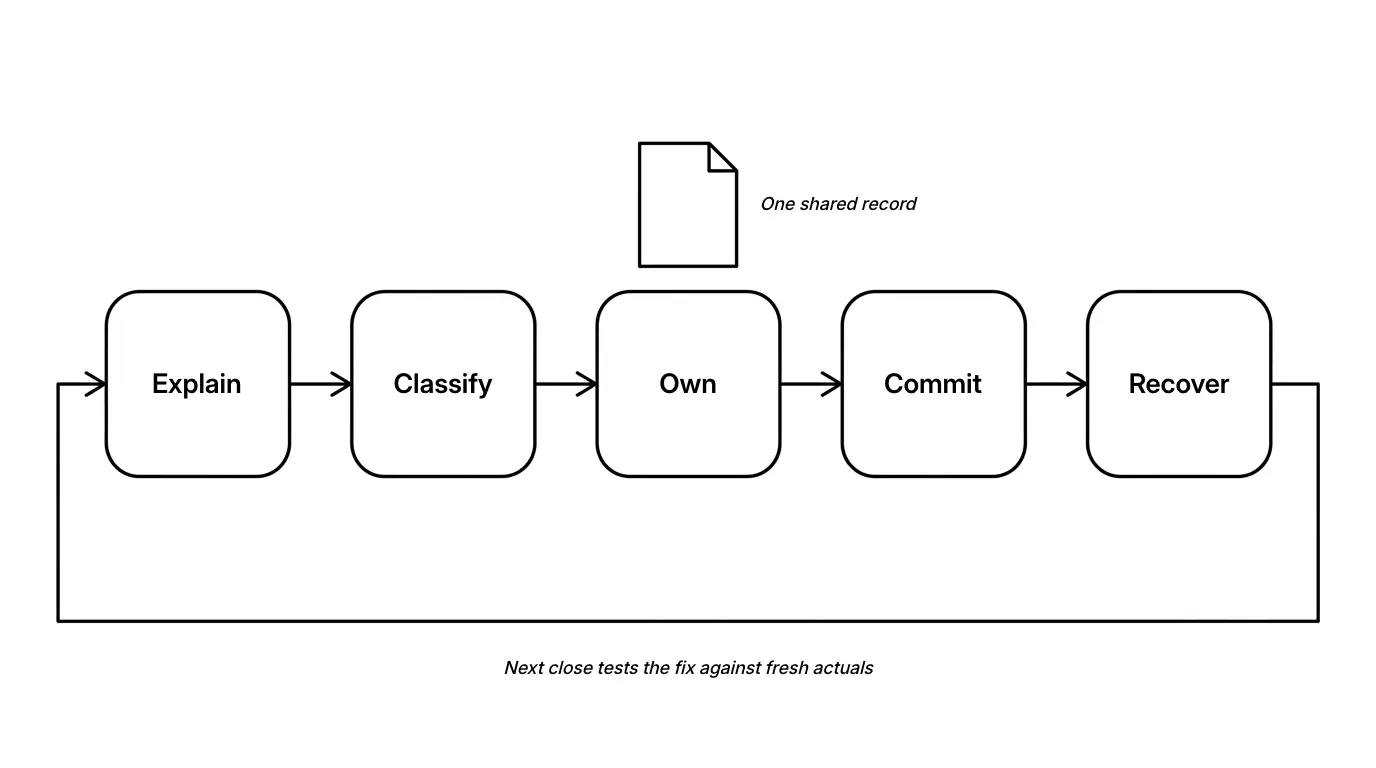
Explain at the level where someone can act
"Manufacturing variance is unfavorable" is a financial headline. An actionable explanation identifies the family, the variance type, and the physical driver. In the walkthrough, one product family drives the miss, material usage is the variance type, and LA-238 is running four points below standard yield with its scrap cost attached.
The analysis is deep enough when a person in one function can recognize the work as theirs. A plant total still needs investigation. A part, work-order cohort, supplier invoice, or line-specific scrap pattern gives the owner somewhere to start.
Classify the response before assigning the owner
An unfavorable variance does not automatically create recoverable margin. Classification prevents teams from turning structural cost into fictional savings or sending accounting noise to the plant.
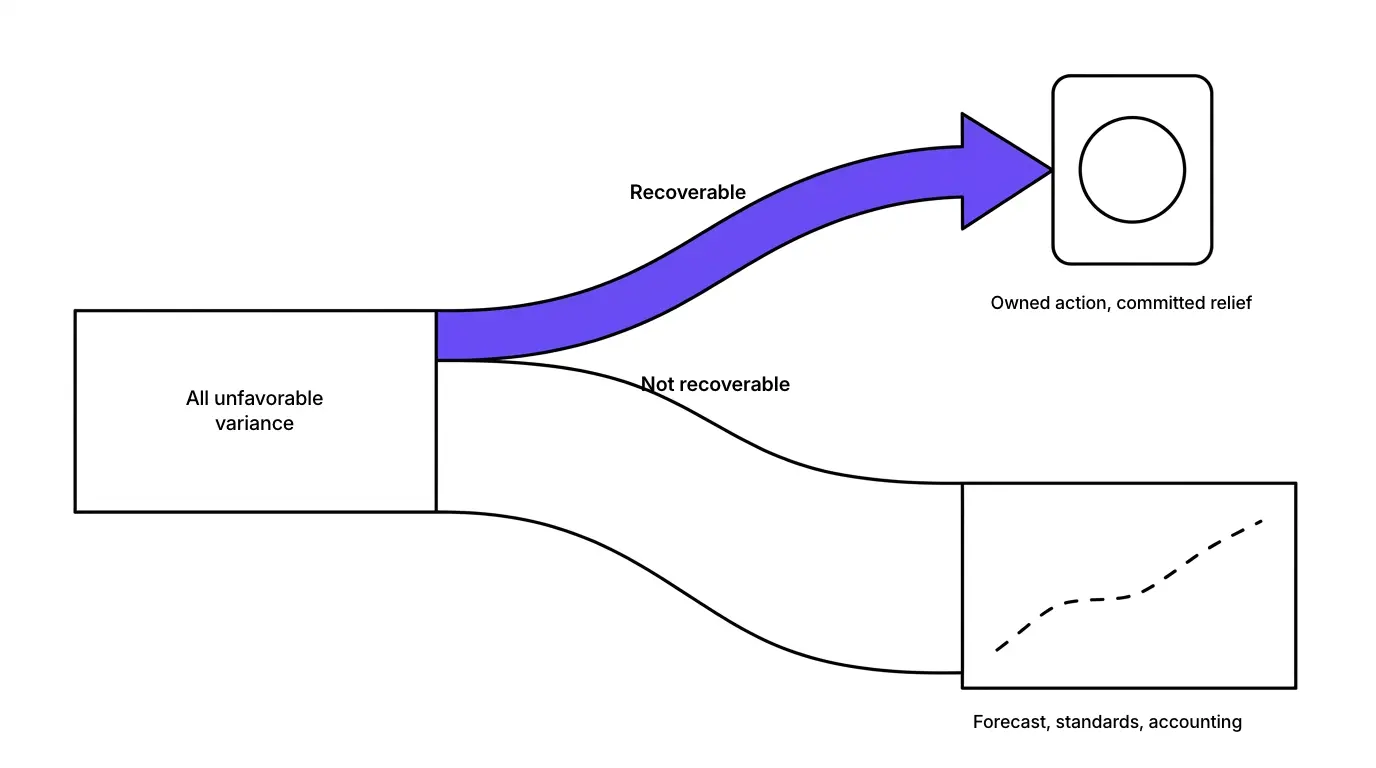
This classification also keeps standard governance separate from recovery. Updating a stale standard can restore the usefulness of future variance analysis, but it does not recover the cost already incurred.
Own the driver in the owner's language
The flagged driver should arrive inside the owning function's view of the same data. Engineering sees yield against standard, scrap units, affected work orders, and the cost by part. Supply chain sees invoice price against the contract formula, including the index movement and any unsupported exposure. Operations sees open actions and the margin at risk.
An owner should not have to reverse-engineer a finance PDF before beginning the work. Ownership becomes real when the record names a person rather than a department and gives that person the evidence required to accept or challenge it.
Commit a number, a date, and the evidence
A corrective action records the affected part or supplier, the root cause, the response, the owner, the expected dollar relief, the target date, and the evidence behind the estimate. The relief remains an estimate until it reaches actuals. Confidence and dependencies belong on the record so finance does not present the full amount as guaranteed.
In the walkthrough, the action for LA-238 carries $52,000 of expected relief and a due date. Actions across engineering, operations, and supply chain add up to $496,000 of committed relief. The owner approves the commitment before it enters the recovered-margin outlook.
Recover against fresh actuals
Recovery is measured against subsequent production, purchasing, and financial data. A manufacturing costing guide makes the timing problem blunt: reviewing month-old variance can be almost useless because the material has been consumed and the lot may have shipped.
The baseline must remain fixed long enough to test the action. Finance should compare observed yield, scrap cost, invoice price, and margin with the approved recovery case. A slipped action moves out of committed relief. A structural miss moves into the forecast. A result that lands becomes realized relief, with enough lineage to keep another team from claiming the same dollars.
The walkthrough moves gross margin from a reported 29.6% to a 31.2% committed outlook if the approved actions hold. The 1.6-point gap is not booked margin. It is the amount the review can now inspect, challenge, and track.
Measure whether the process is working
Rich commentary is a poor success measure. A recovery process should report the coverage, delivery, speed, and recurrence of the actions behind it.
The denominator matters. Using total unfavorable variance for action coverage penalizes the team for index pass-throughs, timing differences, and other items that cannot be recovered through an operating fix.
Where Tellius fits
This workflow starts before the margin bridge. Transactions, work orders, standards, supplier contracts, index series, and the general ledger have to resolve into a governed business view. That foundation keeps the plant's yield number and finance's margin impact tied to the same source records.
With Kaiya Apps, a finance lead can describe the application in plain English: build a manufacturing margin recovery app that decomposes the close, classifies each material variance, routes recoverable drivers, and tracks committed relief against subsequent actuals. Kaiya proposes the data, calculations, views, and actions. The user reviews the plan before the App is built, then refines it in the same conversational interface.
Kaiya Missions handle the recurring investigation. A close Mission can rebuild the bridge on fresh data, rank new drivers, check open actions against actuals, and deliver the updated recovery brief. An investigation can also be saved as an App so the wider team can reuse it without rebuilding the analysis. Missions do the scheduled work. Apps give the organization a governed interface for working the result.
The distinction matters for this use case. A dashboard with a chat box can make exploration easier. The harder job is turning a recurring investigation into a live application that different functions can use, with approved actions flowing back into the next run. The language model handles the request and narrative. Deterministic analysis handles the calculations, and each figure retains its source lineage.
That is how the video and the method connect. The article defines the operating control. The demo shows one way to build and run it without pretending the source data arrived ready for analysis.
Manufacturing variance terms
The takeaway
Explanation debt is hard to see in one close and expensive across a year of them. It falls when the deliverable changes from commentary to a classified variance with an owner, a measured commitment, and a live view of what reached actuals.
Finance still needs the bridge. Operations still needs standards. Engineering and supply chain still need their own working views. The improvement comes from connecting those controls so an explained driver cannot disappear between the review meeting and the production floor.
A variance that was explained is a story. A variance that was recovered is margin.
Get release updates delivered straight to your inbox.
No spam—we hate it as much as you do!

Kaiya Apps: Built on your semantic layer. Governed from the ground up. Ready in minutes, not quarters.

Explanation debt is the accumulating value of manufacturing variances that have been explained in close commentary but not converted into an owned response. It grows when a recoverable root cause remains open and produces another unfavorable variance in a later period.
The explanation and the response often live in different systems. Finance closes the variance in a bridge, while engineering, procurement, or operations manages the response elsewhere. Without a shared record linking the driver to an owner, expected relief, and due date, the close can finish while the root cause remains.
Classify the driver before assigning an action. Contract overbilling, excess scrap, rework, and avoidable yield loss can support recovery. Timing differences, stale standards, and valid commodity-index pass-throughs require accounting, standard governance, or reforecasting rather than a margin-recovery commitment.
Usage and yield analysis needs part, plant, and work-order detail matched to the standard in effect during the period. Purchase price analysis needs invoice lines joined to supplier terms and any referenced commodity index. Monthly account totals can report the miss but cannot locate the response.
Track action coverage over recoverable variance dollars, realized relief against commitments due, the age of open actions, and the rate at which the same root cause returns. These measures show whether the workflow changes operating results rather than producing more commentary.
The platform should connect financial and operational data at transaction and work-order grain, preserve standard and contract context, run deterministic variance calculations, route actions to named owners, and test committed relief against fresh actuals. Tellius supports that workflow through conversationally built Apps and scheduled Missions on the same governed business view.
AI-Powered Variance Analysis for FP&A: Root Cause in Seconds, Not Days

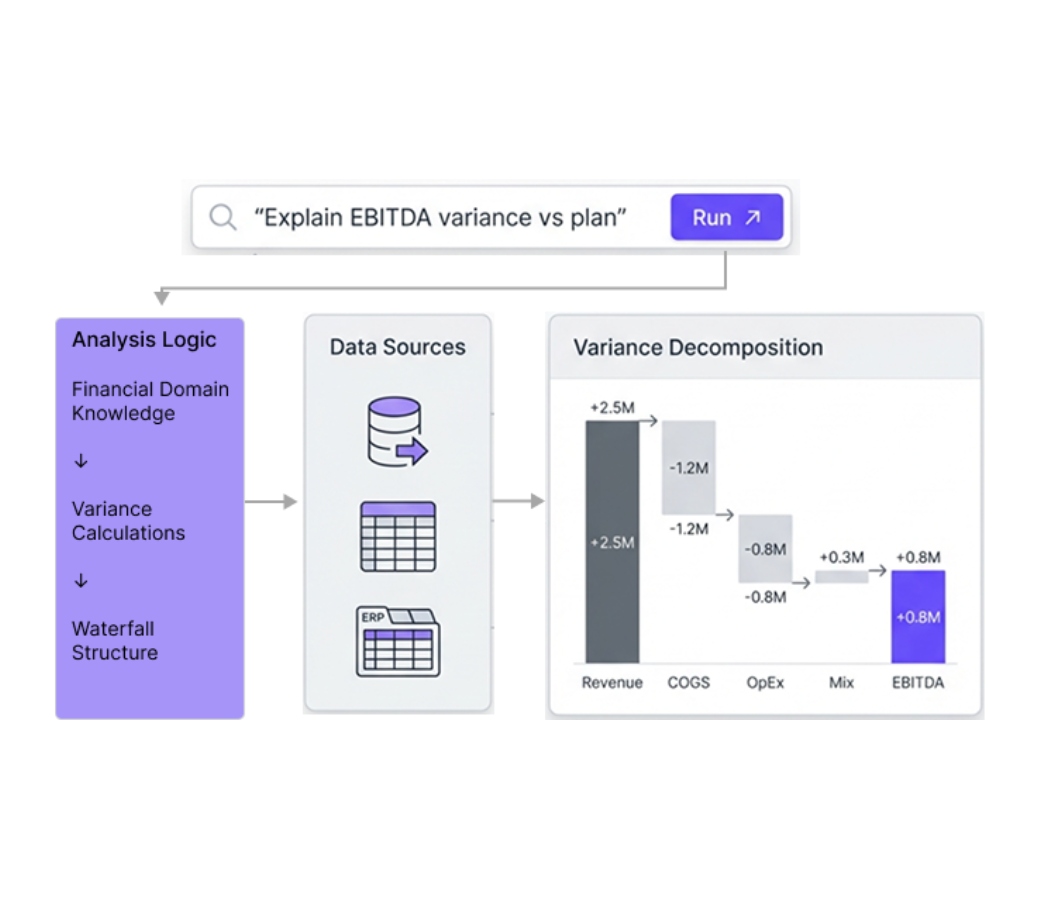
AI-powered variance analysis automates the painful “why did we miss budget?” work that FP&A teams currently do in Excel over 3–5 days every close. Instead of testing price, volume, mix, region, and channel hypotheses one by one, an AI platform connects to ERP, planning tools, and warehouses, decomposes budget-vs-actual gaps across all drivers in parallel, and ranks the true root causes in seconds—often at dimensional intersections humans don’t check. A governed semantic layer keeps definitions for revenue, EBITDA, and variance consistent, while agentic analytics continuously monitors KPIs, triggers investigations when thresholds are breached, and generates executive-ready narratives and P/V/M breakdowns automatically. The blog explains what AI does not replace (finance judgment, strategic decisions, stakeholder storytelling), addresses common objections around messy data and trust, outlines an 8–12 week implementation path, and offers a checklist for evaluating variance analysis platforms—highlighting when this kind of AI is a strong fit for finance teams.