AI-Powered Variance Analysis for FP&A: Root Cause in Seconds, Not Days

Introduction
Close week hits. GL finally settles. Your team pulls actuals into Excel, lines them up against budget, and starts the familiar process: build the variance waterfall, test whether the miss was pricing or volume, check if mix shifted, validate assumptions with operations. Three to five days later, you have an answer—just in time for the next question.
The CFO asks, "Why are we $5M below EBITDA forecast?" The honest answer: "Give me until tomorrow."
That question should take seconds.
AI-powered variance analysis doesn't just make this process faster. It reflects broader technology trends in analytics and AI from testing hypotheses one at a time to testing all of them simultaneously, from waiting for someone to notice a problem to surfacing issues mid-month, from writing variance narratives from scratch to generating first drafts automatically.
This piece breaks down what AI-powered variance analysis actually does, where it delivers real value, and what finance teams should evaluate before making the switch.
What is AI-Powered Variance Analysis?
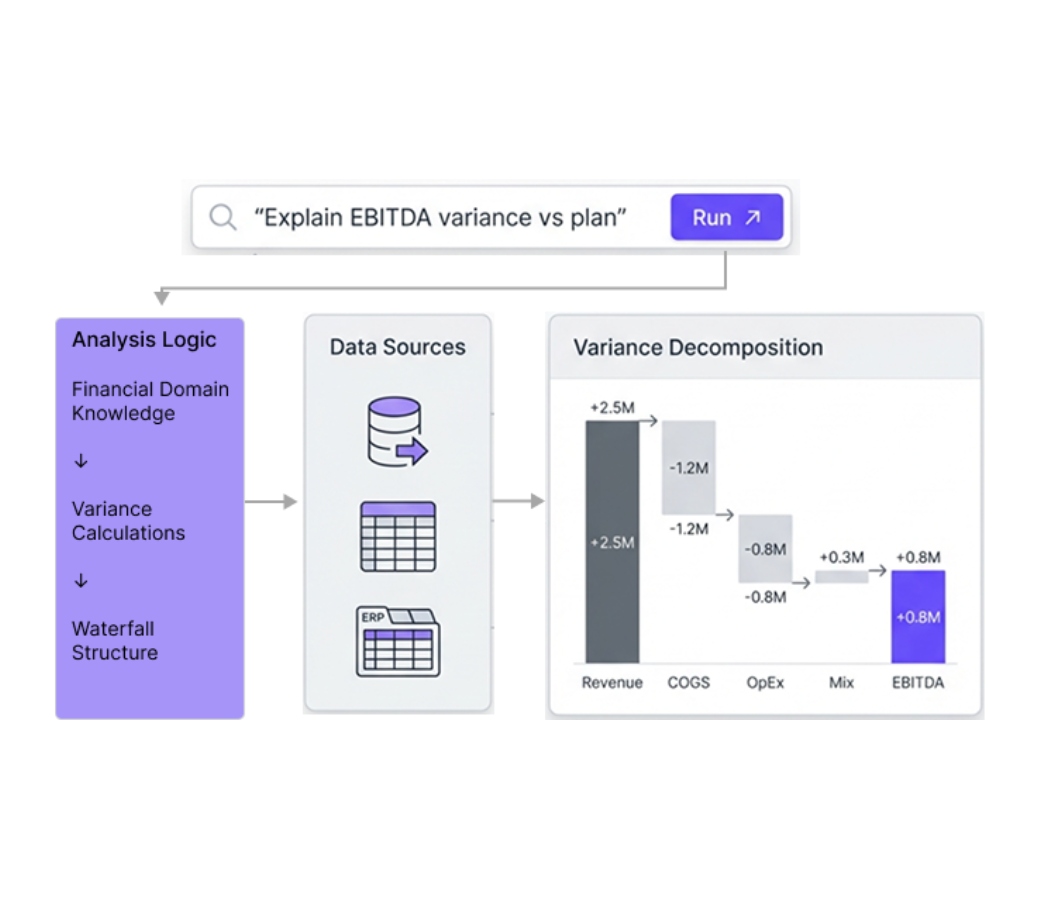
AI-powered variance analysis uses machine learning and natural language processing to automate the decomposition of budget vs. actual gaps into quantified drivers—price, volume, mix, cost center changes, timing, and operational factors. Unlike Excel-based variance analysis that requires manual pivot tables, VLOOKUP formulas, and sequential hypothesis testing, AI-powered variance analysis ranks drivers by contribution and generates plain-English explanations in seconds. The technology connects directly to ERP systems (NetSuite, SAP, Oracle), planning tools (Anaplan, Adaptive, Workday), and data warehouses (Snowflake, Databricks)—eliminating the manual data pulls that consume close week.
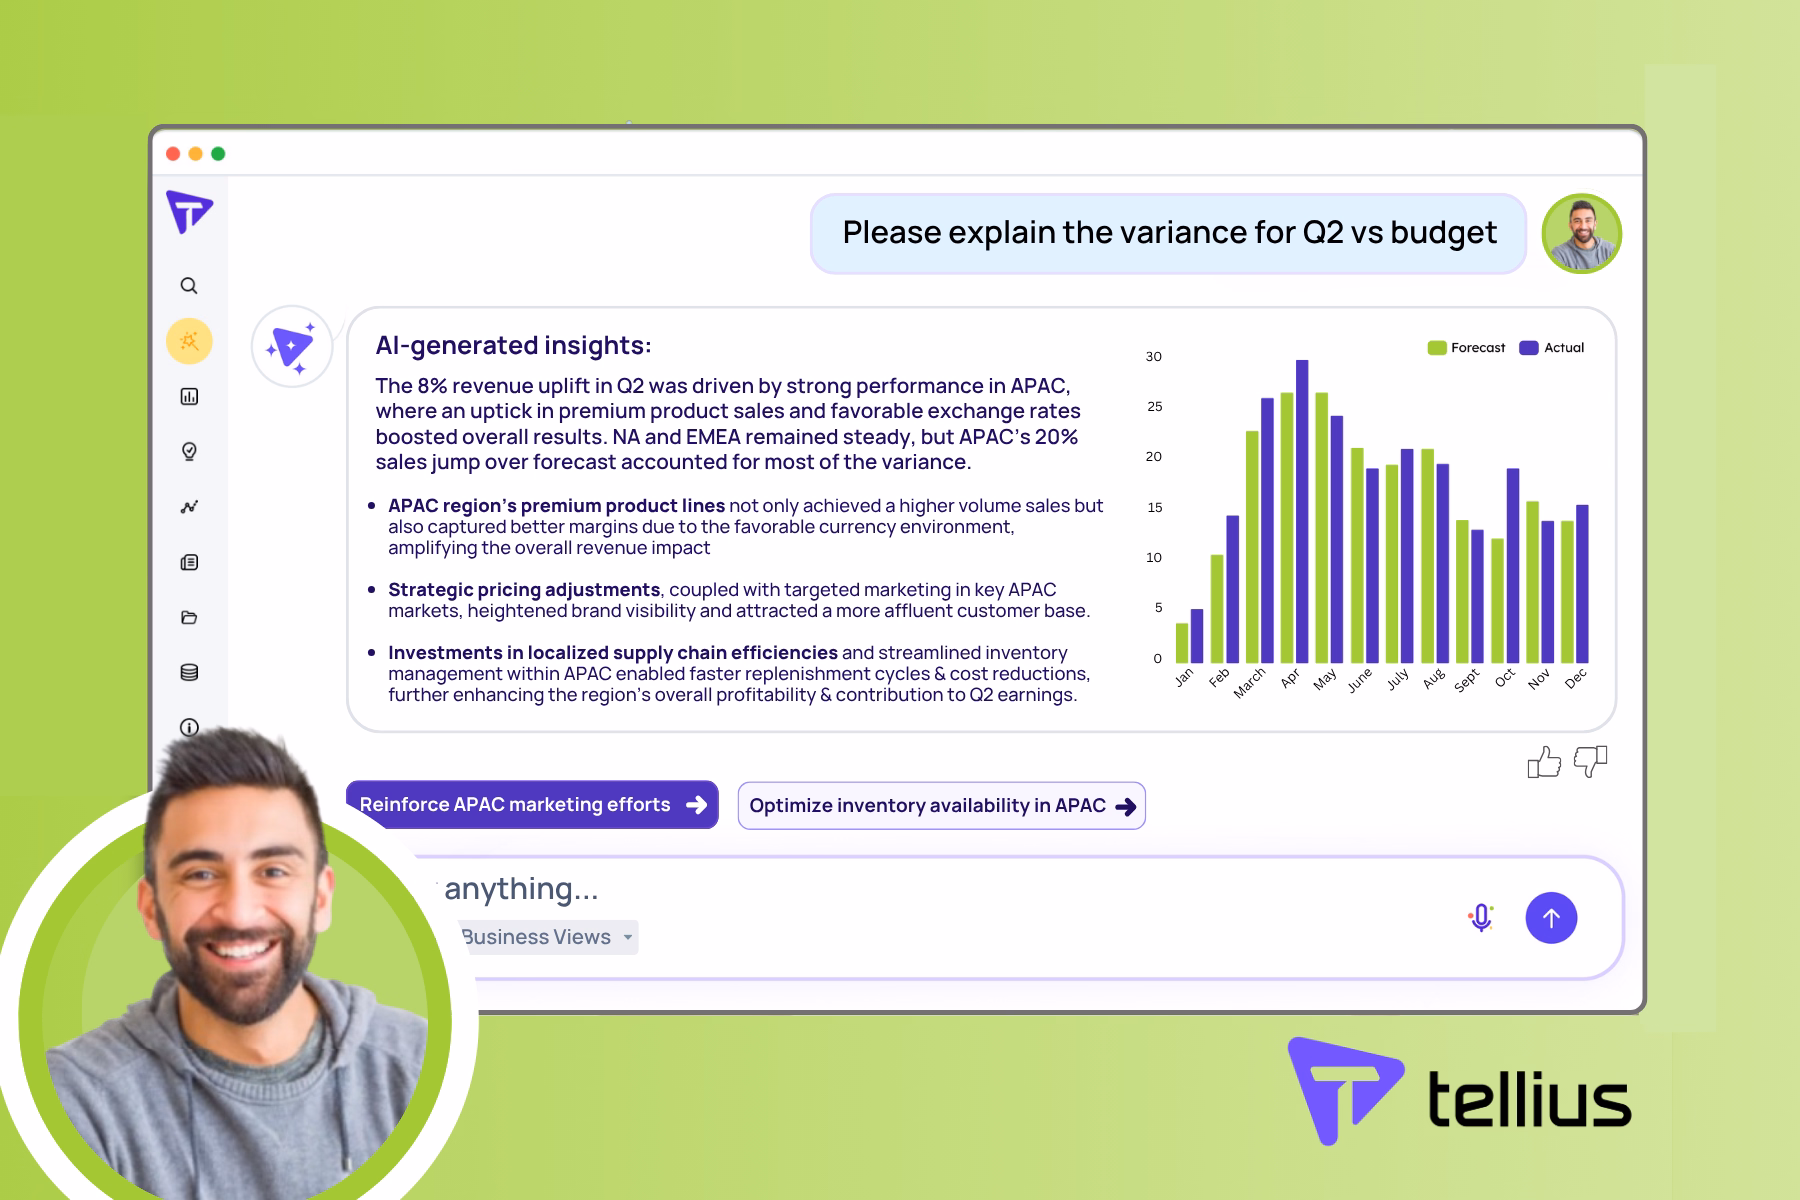
Tellius is an AI-powered variance analysis platform purpose-built for finance—combining conversational analytics for instant answers with agentic analytics for continuous budget monitoring that surfaces issues before quarterly reviews.
.png)
The Real Cost of Manual Variance Analysis
Finance teams know the pain points. Naming them isn't novel. What matters is quantifying the cost.
The data lag problem. GL close takes 5-7 days. Planning systems update weekly. Operational data arrives in batches. By the time actuals align with budget, two days of close week are gone—before any analysis begins — a bottleneck that Deloitte's finance transformation research argues will become obsolete as real-time data eliminates traditional close cycles.
The consistency problem. Different analysts build different models. Finance's variance number doesn't match the planning tool's number doesn't match the department's self-reported number. Each applies different filters, hierarchies, and calculation logic. Reconciliation eats another day.
The hypothesis bottleneck. Manual variance investigation is sequential. Test whether it's pricing. Test whether it's volume. Test whether it's mix. Test whether it's a specific region or product. Each hypothesis requires a new pivot table, a new formula, a new validation pass. By hypothesis four or five, you've found something defensible—but you've also stopped looking. Drivers hiding in dimensional intersections (Product A in Region B through Channel C) go undetected.
The narrative tax. After investigation comes explanation. Board decks, CFO reports, business reviews—all require written commentary explaining the same numbers the team just finished analyzing. Commentary that gets rewritten from scratch every cycle.
The aggregate cost: 3-5 days per close on variance investigation alone. Senior analysts spending 30-40% of their time on work that should be automated.
Where AI Delivers Real Value in Variance Analysis
AI-powered variance analysis changes four things that matter.
Speed Through Parallel Processing
Traditional variance analysis is sequential. Form a hypothesis, build the model, test it, validate, repeat. AI-powered analysis is parallel—the system tests all possible driver combinations simultaneously and ranks by statistical contribution.
Root cause investigation that takes 3-5 days in Excel happens in seconds. Not because the math is simpler, but because the system doesn't wait for humans to decide which hypothesis to test next.
Comprehensiveness Beyond Human Capacity
When analysts test hypotheses manually, they typically examine 3-5 possibilities before finding an answer they can defend. AI tests dozens or hundreds of combinations—including dimensional intersections that explain variance more precisely than single-dimension analysis.
Example: Margin declined 3%. Manual analysis pointed to pricing pressure because that's where the team started looking. AI flagged that 60% of the compression came from channel mix shift—volume had moved to a distributor with worse margin terms. The pricing story was real but secondary.
.png)
Consistency Through Governed Definitions
Excel models produce different answers depending on who built them, which formulas they used, and what assumptions they made. The "five analysts, five different numbers" problem isn't a technology gap—it's a governance gap.
AI-powered platforms enforce consistency through semantic layers and governed data definitions, creating a single source of truth for key finance metrics. "Revenue," "EBITDA," and "variance" produce the same results regardless of who asks or how they phrase the question. Definitions are configured once, applied everywhere, and auditable for compliance.
Proactive Monitoring Instead of Reactive Investigation
Manual variance analysis only happens when someone asks a question or notices something off in the numbers. By definition, it's reactive.
Agentic analytics flips the model. AI agents monitor budget vs. actual continuously—24/7, not just at close. When variances cross thresholds, or when trends predict they will, the agent investigates automatically and alerts before the problem compounds.
Cost overruns that used to surface at quarterly reviews now surface at week three, when intervention is still possible.
How Price/Volume/Mix Analysis Works in AI Systems
P/V/M decomposition is where most finance teams spend 1-2 days per analysis. The math isn't complicated—but the manual work is.
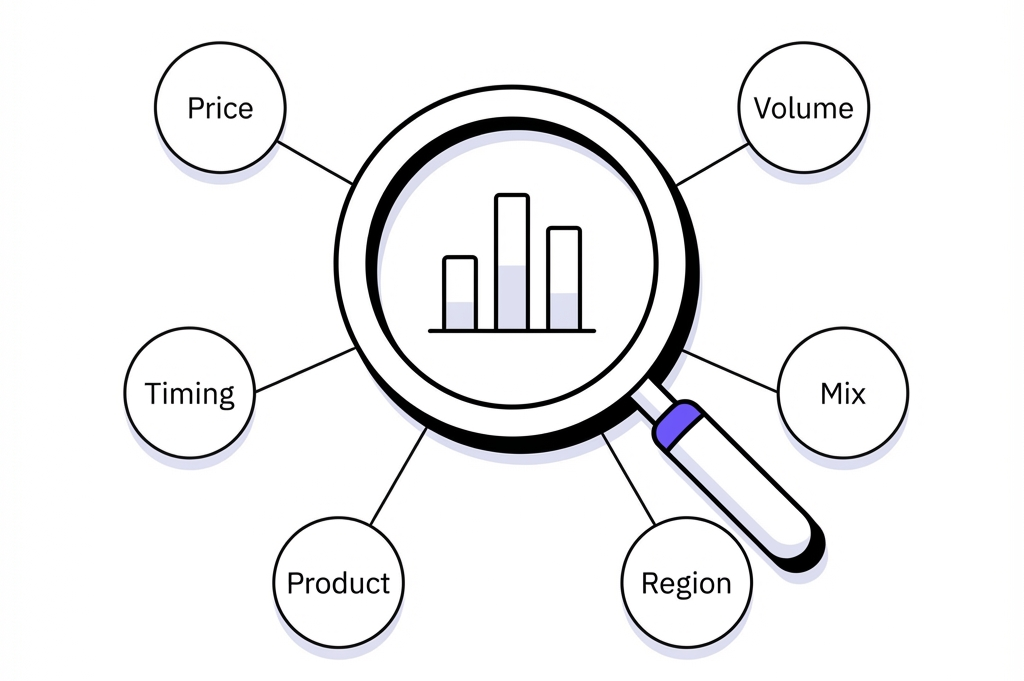
Price effect measures how selling prices changed versus plan. Volume effect measures how unit quantities changed versus plan. Mix effect measures how the composition of revenue shifted toward higher or lower-margin products versus plan.
Traditional P/V/M requires Excel formulas that calculate weighted averages, apply price indices, and mathematically separate volume effects from mix effects. Each component needs validation. The reconciliation—confirming that price + volume + mix = total variance—takes additional passes, and recent FP&A benchmarks and trends show that a big share of finance time is still spent on this kind of manual data work instead of analysis.
AI-powered P/V/M automates the entire decomposition. Ask: "Break down revenue variance into price, volume, and mix." The system calculates all three components simultaneously and shows contribution:
"Revenue declined $5M: -$2M from volume drop (40%), -$1.5M from mix shift to lower-margin SKUs (30%), -$1.5M from pricing pressure (30%)."
The calculation methodology is the same. The time required isn't.
Agentic Analytics: From Asking Questions to Receiving Answers
Conversational analytics makes investigation faster—ask a question in plain English, get an instant answer. But it's still reactive. Someone has to notice the problem and ask the question.
Agentic analytics works differently. AI agents operate autonomously—monitoring KPIs, detecting meaningful changes, investigating root causes, and delivering insights before anyone asks.
How it works in practice:
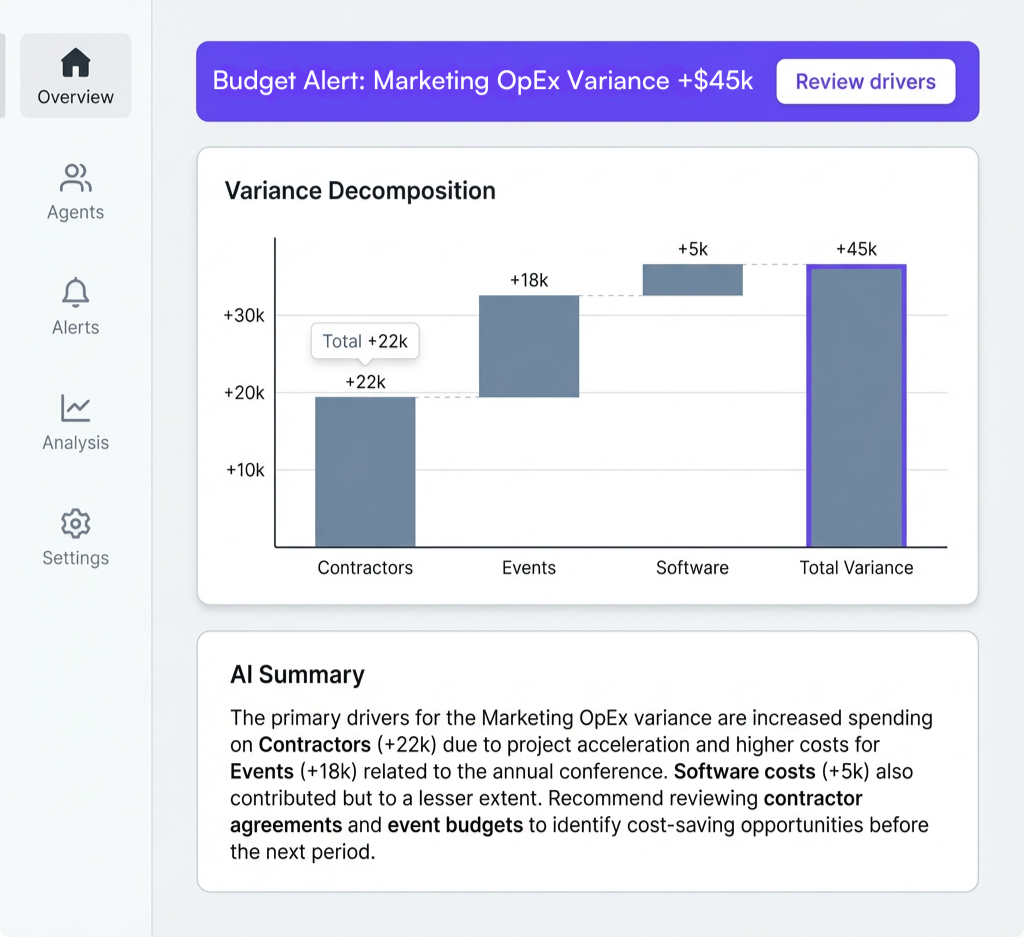
An agent monitors Marketing OpEx against budget. Halfway through Q2, spend trends 15% over plan. The agent doesn't wait for close week. It investigates automatically, identifies drivers, and sends an alert:
"Marketing OpEx trending +15% vs. budget. Primary drivers: unplanned contractor spend (+60% of variance), event costs above estimate (+25%), software subscription increases (+15%). Estimated full-quarter impact: +$1.2M if trend continues."
The alert arrives with context. Finance can adjust the forecast, flag the issue to leadership, or intervene on spend—while there's still time to change the outcome.
What AI Doesn't Replace
AI-powered variance analysis automates investigation. It doesn't automate judgment.
Deciding whether a variance requires action remains a human responsibility. A 5% EBITDA miss might be noise in one quarter and a crisis in another, depending on context the numbers don't capture.
Determining strategic response requires understanding that can't be extracted from historical data. Should you cut spend, adjust pricing, exit a product line, renegotiate terms? The AI identifies drivers; humans decide what to do about them.
Explaining findings to non-finance stakeholders still requires translation. AI generates technically accurate narratives, but an operations VP doesn't think in variance decomposition. Someone needs to connect the numbers to operational reality.
Handling genuinely novel situations exposes model limitations. AI learns from patterns in historical data. If a variance is driven by something unprecedented—a new competitor, a regulatory change, a one-time event—the system may rank drivers incorrectly because it lacks precedent.
The goal isn't replacing analysts. It's freeing them from data wrangling so they can focus on interpretation, scenario planning, and forward-looking recommendations.
Addressing Common Objections
"Our data is too messy for this."
If variance analysis runs in Excel today, it can run in an AI platform. The system connects to existing data sources—ERP, planning tools, data warehouse—and maps to a semantic layer that handles normalization.
The real challenge is definition alignment: making sure "revenue" means the same thing across systems. That's a problem that exists today. AI just forces it to be solved once, consistently.
"We tried automation before. It didn't handle our complexity."
Point solutions often fail because they solve one workflow. P/V/M gets automated, but root cause still requires manual work. Variance alerts fire without context. Integration gaps create new manual processes.
AI-powered platforms combine decomposition, investigation, alerting, and narrative generation in one system. The complexity that required multiple tools and manual handoffs is handled in a single workflow.
"I can't trust numbers I didn't build myself."
Fair concern. The answer is parallel validation.
Run the same variance analysis in Excel and in the AI platform for two or three close cycles. Compare results line by line. Investigate discrepancies—they indicate either Excel errors (which are common) or platform configuration issues.
Every AI calculation is auditable with full data lineage. Any number can be traced to source data, which matters for SOX compliance and internal audit.
"My team already has this under control."
Maybe. If variance investigation takes less than a day, if results are consistent across analysts, if dimensional intersections don't hide drivers, and if issues surface mid-month rather than at close—AI adds limited value.
But if senior analysts are spending 30%+ of close week on variance work, that's capacity being consumed by automation-ready tasks. The question isn't whether the current process works. It's whether the current allocation of analyst time is optimal.
What Implementation Looks Like
Realistic timeline: 8-12 weeks from kickoff to full deployment.
Weeks 1-4: Data integration and semantic layer configuration. Connect priority data sources—typically ERP for actuals, planning tool for budget/forecast, one or two operational systems. Configure the semantic layer with account structures, hierarchies, and metric definitions. This phase is 80% of the work.
Weeks 5-8: Workflow configuration and parallel validation. Set up variance analysis workflows matching current close processes. Configure P/V/M decomposition rules, driver hierarchies, alert thresholds. Run parallel analysis against existing Excel models to validate accuracy.
Weeks 9-12: Agent deployment and user enablement. Deploy monitoring agents on priority KPIs. Train finance users on conversational interface. Start generating automated narratives for internal review before using them externally.
What's required for success:
- Executive sponsor who owns data definitions and can enforce alignment across teams
- Finance lead who validates outputs against institutional knowledge
- Technical resource (internal or vendor) for data integration
- Willingness to standardize—AI requires definition consistency that Excel models tolerate
Initial value typically appears around week 6. Full value by week 12. Continuous improvement as definitions are refined and coverage expands.
Evaluating AI-Powered Variance Analysis Platforms
Not all platforms are equivalent. Key differentiators:
Automated driver decomposition. The platform should test all possible variance drivers simultaneously and rank by contribution—not require users to configure each decomposition manually.
Multi-dimensional analysis. Finding variance drivers at dimensional intersections ("Product A in Region B through Channel C") matters more than single-dimension views. Many variances hide at intersections.
Conversational interface. Analysts should ask questions in plain English, not build reports or configure dashboards. "Why is EBITDA below forecast?" should produce comprehensive answers without technical setup.
Proactive monitoring. AI agents should watch for variances continuously and investigate when thresholds are crossed—not just when someone remembers to check.
Narrative generation. The platform should convert variance analysis into executive-ready explanations automatically, not just visualize decomposition.
Governed semantic layer. "Revenue" and "variance" should mean the same thing regardless of who asks. This eliminates inconsistency across users and supports audit requirements.
When AI-Powered Variance Analysis Makes Sense
Strong fit:
- Variance investigation currently takes 3+ days per close cycle
- Multiple analysts produce inconsistent results from same data
- CFO questions routinely require "I'll get back to you" responses
- Cost overruns surface at quarterly reviews, not mid-month
- Senior analyst time is consumed by data work, not strategic analysis
Weak fit:
- Small finance team with simple cost structures
- Variance analysis already takes less than a day
- Data infrastructure too immature for integration
- No executive sponsor to enforce definition standardization
Questions to ask during evaluation:
- Can we run parallel analysis against our Excel models during proof-of-concept?
- How does the platform handle one-time items, restatements, and acquisitions?
- What governance controls exist for definition changes?
- How are driver rankings calculated—what's the statistical methodology?
- Can users drill from automated narrative to underlying source data?
- What's the audit trail for SOX compliance?
Frequently Asked Questions
Understanding Variance Analysis Fundamentals
What is variance analysis in FP&A?
Variance analysis in FP&A compares actual financial results to budget, forecast, or prior period to understand why performance gaps occurred. Traditional variance analysis involves pulling actuals from ERP systems, comparing against planning tool data, and building Excel models to test whether variances were driven by volume, pricing, mix, cost changes, or timing. AI-powered variance analysis automates this workflow—analysts ask questions in plain English and receive instant decomposition across all relevant drivers, ranked by contribution.
What is price volume mix analysis?
Price/Volume/Mix (P/V/M) analysis decomposes revenue variance into three components: price effect (selling price changes vs. plan), volume effect (unit quantity changes vs. plan), and mix effect (shift toward higher or lower-margin products vs. plan). Traditional P/V/M requires Excel formulas calculating weighted averages and separating effects—typically taking 1-2 days. AI-powered P/V/M automates the decomposition in seconds and shows which component contributed most.
What's the difference between variance analysis and flux analysis?
Variance analysis compares actuals to budget or forecast—"we planned X, achieved Y, why the gap?" Flux analysis compares period-to-period changes—"we did X last quarter, Y this quarter, what changed?" Both decompose differences into drivers, but variance analysis is plan-centric while flux analysis is trend-centric. AI-powered platforms handle both through the same interface.
How do you find the root cause of a financial variance?
Root cause analysis requires testing multiple hypotheses and quantifying each driver's contribution. Traditional analysis is sequential—form hypothesis, test, repeat. AI-powered root cause analysis is parallel—the system tests revenue drivers (price, volume, mix, timing), cost drivers (COGS, OpEx by department), and operational factors simultaneously. Output is a ranked list: "EBITDA declined 5% primarily due to higher Sales & Marketing OpEx (60% of variance) and delayed revenue recognition (25%)."
AI-Powered Capabilities
How does AI-powered root cause analysis work?
AI-powered root cause analysis uses machine learning to test all possible variance drivers simultaneously, rank them by statistical contribution, and generate plain-English explanations. Where human analysts might test 3-5 hypotheses, AI tests dozens or hundreds of combinations—including dimensional intersections that single-dimension analysis misses. Every calculation is auditable with full data lineage.
What is agentic analytics for finance?
Agentic analytics deploys AI agents that work autonomously—monitoring KPIs 24/7, detecting anomalies, investigating root causes, and alerting proactively. Unlike conversational analytics where humans initiate questions, agentic analytics surfaces issues before anyone asks. For variance analysis, this means catching budget overruns mid-month with automated investigation identifying which cost centers, products, or regions are driving the variance.
What's the difference between conversational and agentic analytics?
Conversational analytics lets users ask questions in plain English and get instant answers—humans drive the inquiry. Agentic analytics means AI agents work without being asked—continuously monitoring, detecting anomalies, investigating automatically, and alerting proactively. Conversational is human-initiated; agentic is AI-initiated. Both serve different purposes: conversational for on-demand investigation, agentic for continuous monitoring.
Implementation and Integration
Can AI-powered variance analysis work with Anaplan, Adaptive, or other planning tools?
Yes. AI-powered platforms complement existing FP&A systems rather than replacing them. They connect to planning tools (Anaplan, Adaptive, Workday, Planful), ERP systems (NetSuite, SAP, Oracle), and data warehouses (Snowflake, Databricks)—adding an intelligence layer for variance analysis and root cause investigation. Existing planning workflows remain unchanged.
How long does implementation take?
Typical deployment: 8-12 weeks. Weeks 1-4 focus on data integration and semantic layer configuration. Weeks 5-8 involve workflow setup and parallel validation against existing models. Weeks 9-12 include agent deployment and user training. Initial value usually appears around week 6.
How does AI-powered variance analysis integrate with existing BI dashboards?
Integration typically works through data export (variance results feed into Tableau or Power BI visualizations), embedded components (AI-generated charts appear within existing dashboards), or complementary usage (BI for standard KPI monitoring, AI for investigation when metrics move unexpectedly). Most teams keep BI for visualization and add AI for intelligence.
Is AI-generated variance analysis auditable for SOX compliance?
Yes, if the platform provides full data lineage. Every calculation should trace to source data. Governed semantic layers ensure consistent, repeatable results. Before implementation, verify governance controls and lineage capabilities meet compliance requirements.
Get Started
If variance analysis is consuming close week and your team is ready to evaluate alternatives, schedule a conversation with Tellius. We'll show you how AI-powered variance analysis works on your actual data—and whether it fits your team's needs.
Get release updates delivered straight to your inbox.
No spam—we hate it as much as you do!


How AI Variance Analysis Transforms FP&A
Learn how AI-powered variance analysis is transforming how organizations uncover and act upon financial insights.
.webp)
14 Best AI Tools for Finance Teams in 2026 | Comparison Guide
AI is rapidly reshaping how finance teams plan, analyze, and report on business performance. This guide compares 14 of the best AI tools for finance teams in 2026, covering platforms for financial analysis, forecasting, reporting, and automated insights. It explains how modern AI tools help finance professionals move beyond spreadsheets and manual reporting by automating data integration, uncovering drivers behind financial performance, and generating faster forecasts and variance explanations. The article also provides a practical framework for evaluating finance AI tools—highlighting which platforms are best for FP&A, financial analysis, operational planning, and executive reporting in today’s AI-driven finance stack.