Don’t settle for blind spots
Stop missing what matters. Leverage automated root cause, trends, cohort insights, and anomaly alerts—so blind spots never stand a chance.
AI Insights overview
From key drivers to hidden opportunities, see what’s impacting your business in an instant


AI-generated insights have only been adopted by 14% of orgs because…

Uncover why KPIs change
Data to Stories, Instantly
Stop Scratching the Surface. Spot insights in billions of data points.
Automated root causes, key drivers, and cohort comparisons help you quickly zero in on the real factors driving changes so you can make changes.
Learn More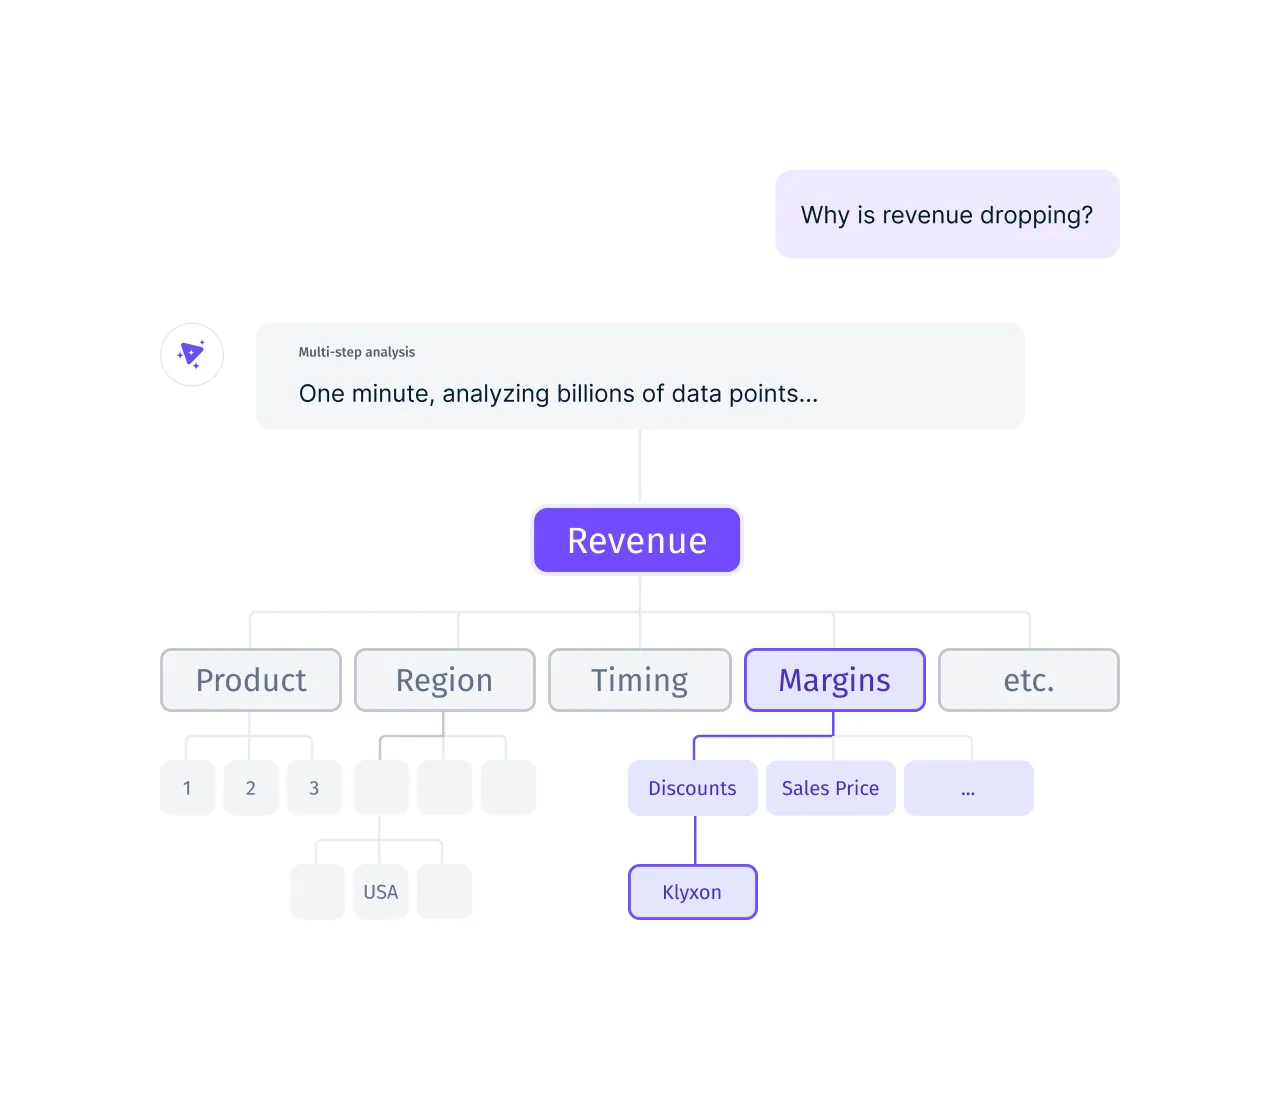

“WHY” Has Many Flavors. We Help You Find Them ALL...
Eliminate blind spots and make smarter decisions with a complete view of your data's story. From cohort comparisons to root cause analysis, proactive anomaly detection to key driver identification—every insight comes enriched with relevant context so you never miss a critical signal or connection.
Learn MoreInsights, Your Way.
Seamlessly swap variables in and out to customize and reshape insights on demand. Whether you need a quick summary, a deep statistical report, or insights branded into your corporate template, it’s never been easier to adapt your insights to fit your needs.
Learn More
.avif)
Numbers That Speak Your Language. Complex Insights Made Consumable.
Go beyond raw data with AI-powered insights that automatically surface the story behind the numbers. Get clear, actionable explanations that help your team understand not just what happened, but why it matters and what to do next.
Learn MoreAnswers to Questions You Did Not Know to Ask. Insights Come to You.
Avoid hours of manual analysis. Agents monitor data 24/7, notifying you of significant shifts, root causes, and potential next-best actions, freeing your team to focus on strategic actions.
Learn More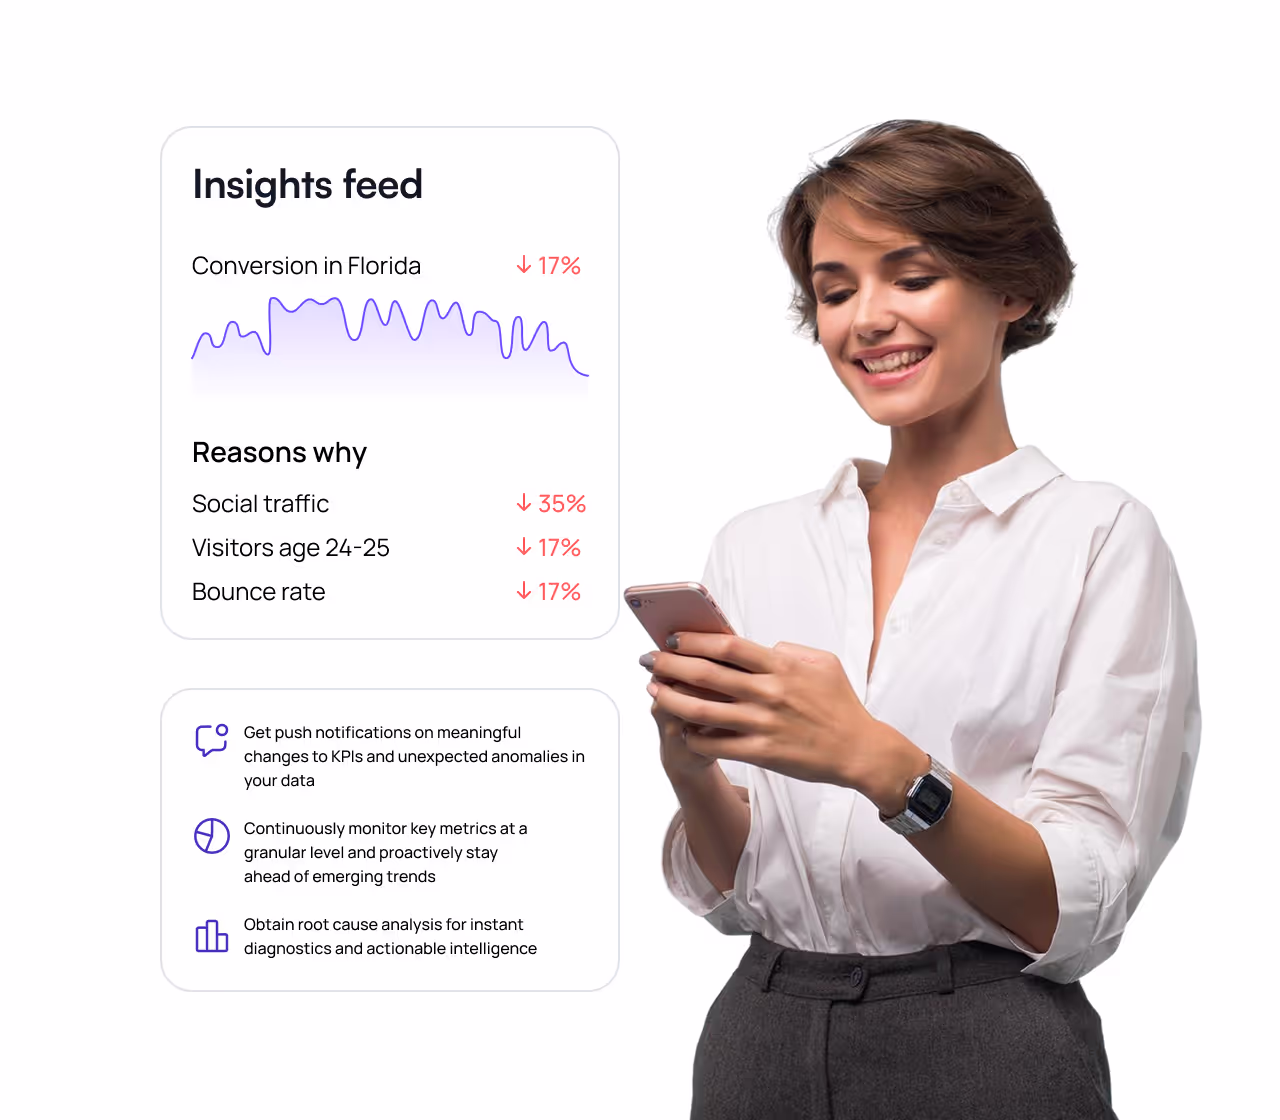

Stop Guessing. Start Pinpointing.
Unearth root causes, catch anomalies, and stay a step ahead—no data science degree required.
Under the Hood: Our Intelligent Architecture in Action

Breakthrough Ideas, Right at Your Fingertips
Dig into our latest guides, webinars, whitepapers, and best practices that help you leverage data for tangible, scalable results.
.webp)
Agentic AI in Supply Chain: Use Cases, Platforms, and What's Shipping (2026)
Supply chain leaders are moving beyond predictive dashboards and generative AI toward agentic systems that can monitor operations, investigate disruptions, recommend actions, and orchestrate workflows across the enterprise. This guide explores the state of agentic AI in supply chain management in 2026, comparing the leading platforms and highlighting the use cases that are delivering measurable business value today. Learn how organizations are deploying AI agents for demand sensing, inventory optimization, supplier risk monitoring, procurement intelligence, logistics planning, production scheduling, transportation optimization, and exception management.
.webp)
Best FP&A Software in 2026: The Tools That Plan, and the Layer That Explains Why
Modern FP&A teams need more than planning software—they need the ability to explain financial performance, identify the drivers behind change, and act faster on emerging risks and opportunities. This buyer's guide compares the leading FP&A platforms in 2026 across budgeting, forecasting, scenario modeling, financial consolidation, reporting, AI-assisted planning, and enterprise analytics. It also introduces a new evaluation framework: distinguishing the systems that plan from the intelligence layer that explains why.
.webp)
Best Pharma Launch Analytics Platforms in 2026: What Each One Does Best
Launching a new therapy has never been more data-intensive—or more complex. Commercial teams must coordinate brand strategy, field execution, HCP engagement, market access, patient adoption, omnichannel performance, and competitive intelligence while making decisions in near real time. This buyer's guide compares the leading pharma launch analytics platforms in 2026, evaluating what each solution does best across launch planning, forecasting, HCP targeting, territory performance, market access analytics, omnichannel measurement, patient journey insights, and AI-powered commercial intelligence.
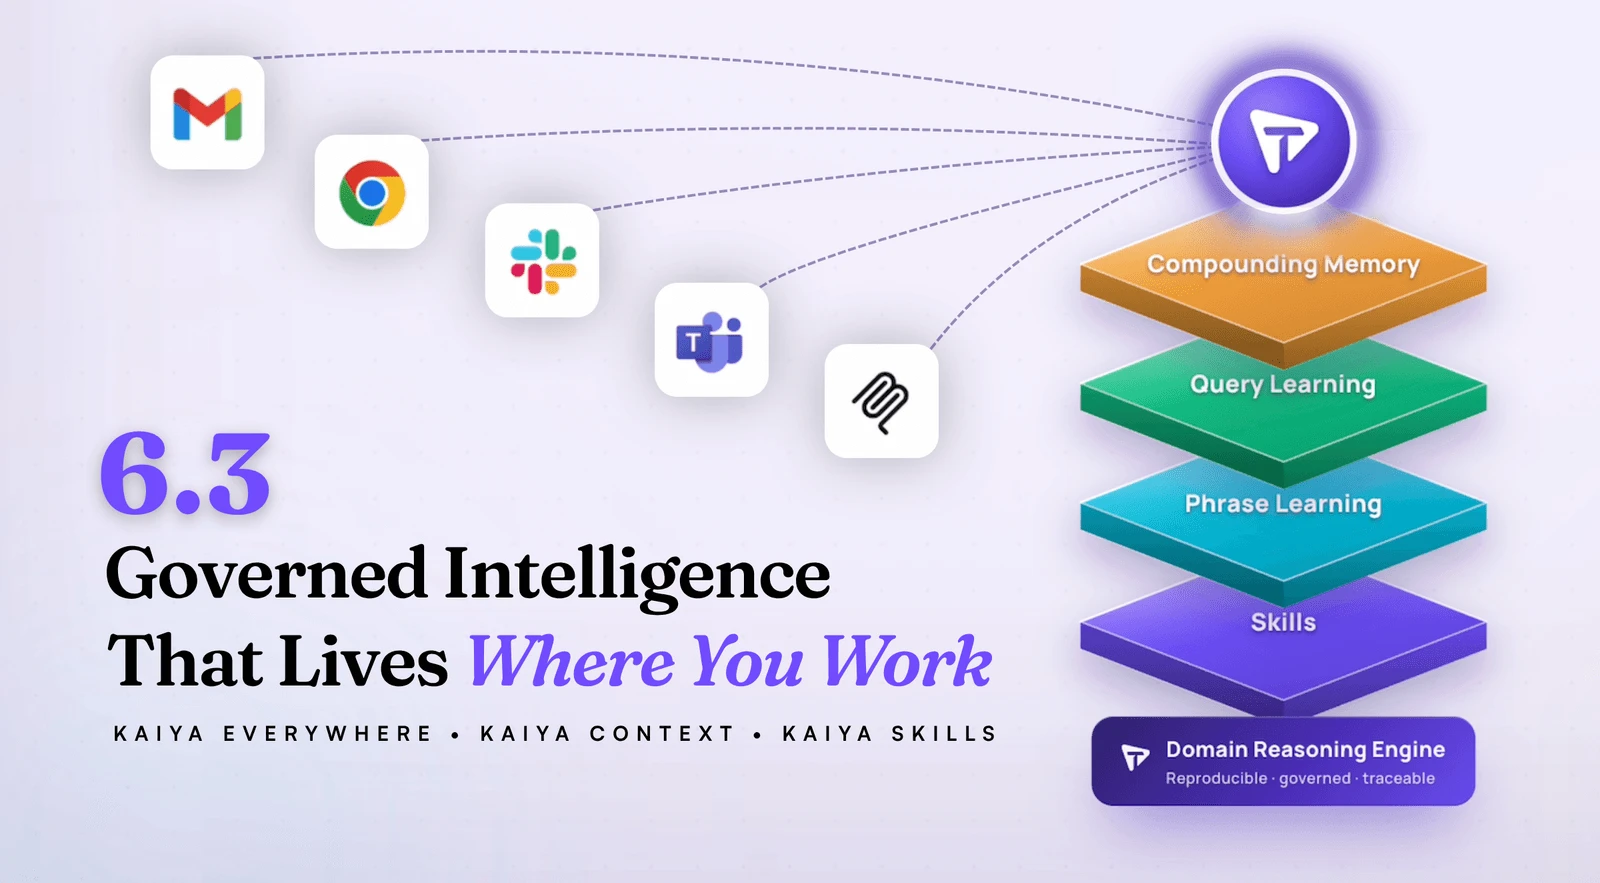
Tellius 6.3: Kaiya Everywhere, Grounded in Your Business
AI answers are only useful when they're grounded in your business and available where decisions actually happen. See how Tellius 6.3 delivers fast, traceable insights across pharma, CPG, RevOps, and FP&A — right in the tools your team already uses.

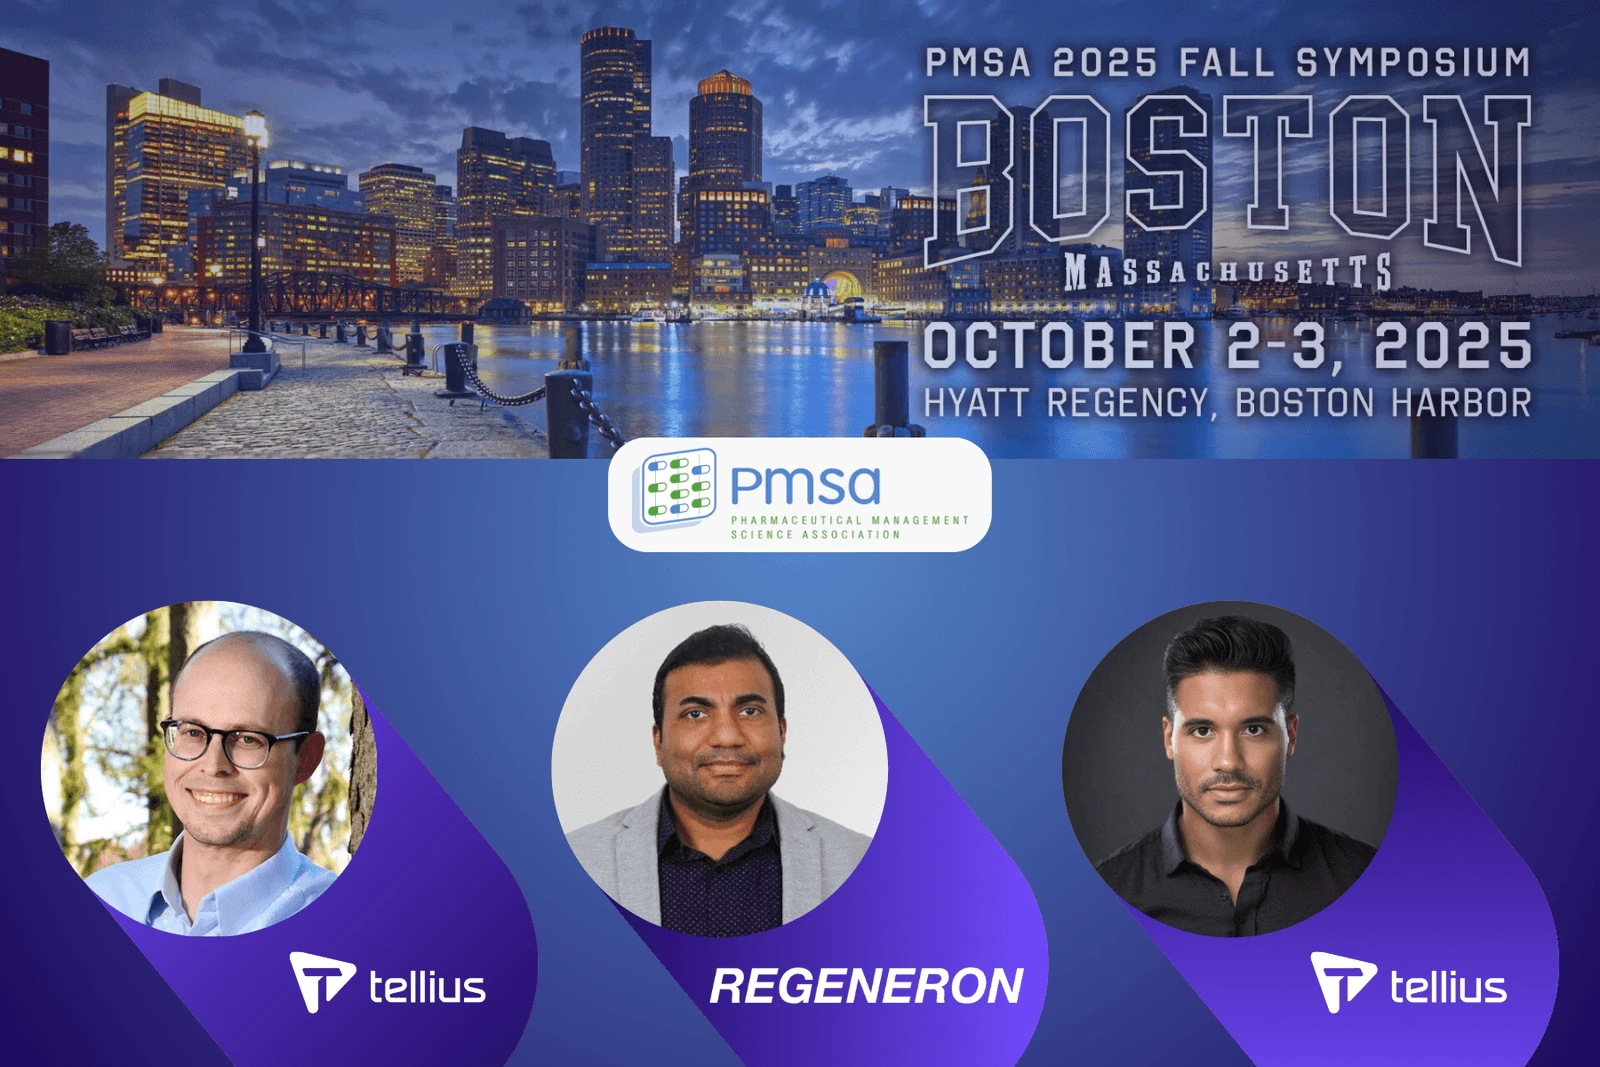
PMSA Fall Symposium 2025 in Boston
Join Tellius at PMSA Oct 2–3 for two can’t-miss sessions: Regeneron on how they’re scaling GenAI across the pharma brand lifecycle, and a hands-on workshop on AI Agents for sales, HCP targeting, and access wins. Discover how AI-powered analytics drives commercial success.
.webp)
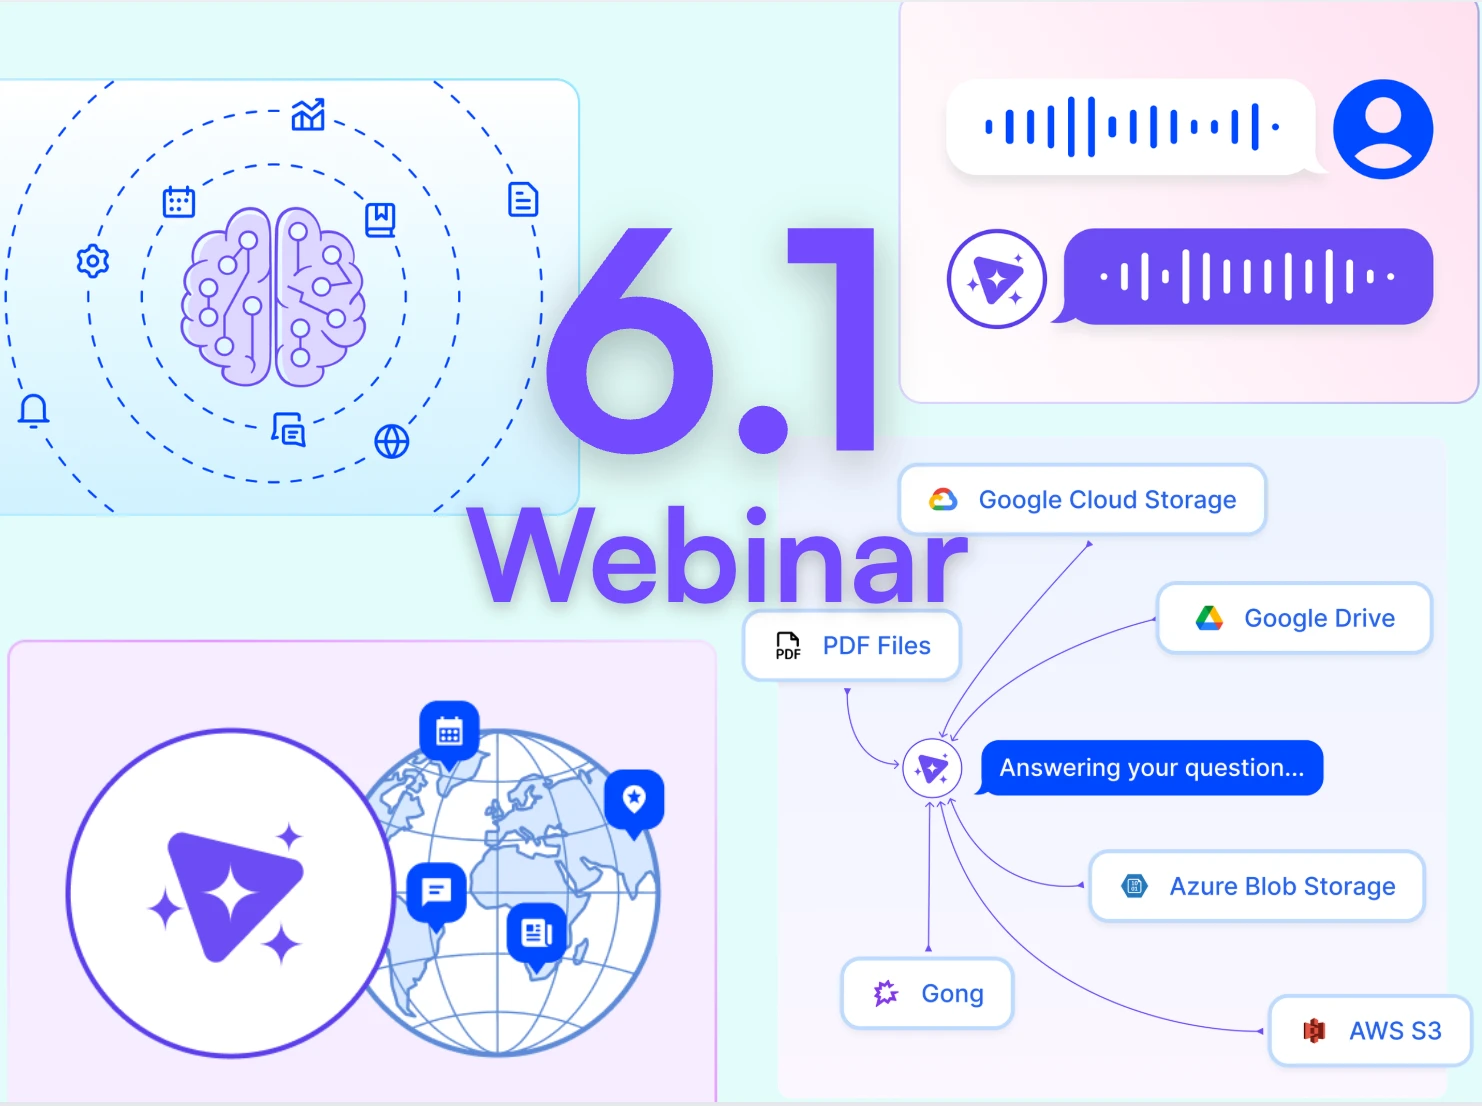
Tellius AI Agents: Driving Real Analysis, Action, + Enterprise Intelligence
Tellius AI Agents transform business intelligence with dedicated AI squads that automate complex analysis workflows without coding. Join our April 17th webinar to discover how these agents can 100x enterprise productivity by turning questions into actionable insights, adapting to your unique business processes, and driving decisions with trustworthy, explainable intelligence.