Pharma Analytics:
AI-Driven Efficiency for Pharmaceutical & Biotech Companies
Unleash faster, actionable insights from your prescriber, market, and patient data with automated analysis and machine learning.
Insights Meet Action
Unify internal and external data, surface AI-powered insights, and turn confident, data-driven decisions into action—without complexity.
Break Data Silos, Unlock Commercial Insights
Easily merge internal and external pharma data seamlessly to uncover hidden opportunities, optimize commercial strategies, and drive smarter decisions.

Instant Answers, Faster Results
Ask and answer any commercial pharma question in a self-service conversational manner, empowering every commercial pharma team to explore data, uncover insights, and make confident decisions—no SQL or analyst backlogs required.

AI driven deep insights and narratives
Unlock deep insights with AI-driven analysis and dynamic narratives—transforming complex pharma data into clear, actionable stories.
A Squad of Agents by Your Side -- 24/7
AI-powered agents leverage RAG and a robust Knowledge Layer to deliver real-time insights, automate complex analysis, and drive smarter commercial pharma decisions—instantly.

Use Cases
Field Sales
Empower your field representatives with real-time, actionable insights to enhance HCP outreach, monitor sales performance, and evaluate campaign effectiveness, ensuring impactful engagements and optimized sales strategies
Brand Performance
Gain real-time insights to flag deviations early, optimize engagement strategies, and strengthen brand positioning while reducing HCP churn.
Incentive Compensation
Align sales incentives with performance metrics to drive engagement and maximize ROI.

Market Access
Assess pricing, contracting, and reimbursement strategies, ensuring optimal market access and patient reach.
Payer Analytics
Make informed contracting and reimbursement decisions through AI-driven rebate tracking, formulary performance management, and cash flow forecasting.

Patient Journey
Analyze comprehensive patient data to uncover trends and gaps, enhancing adherence and streamlining processes for improved outcomes.
.avif)
HEOR
Generate evidence-backed insights to support market value narratives and reimbursement strategies.
RWE
Leverage real-world data to validate outcomes, identify trends, and inform clinical and commercial strategies.

Finance
Simplify forecasting and budgeting to deliver actionable insights, enhance accuracy, and drive strategic financial decisions.
Quality Analytics
Enhance manufacturing quality management by identifying process gaps, forecasting quality outcomes, and monitoring supplier performance


Conversational AI & Agents—Redefining Pharma Analytics
Move beyond static dashboards. AI-powered agents continuously monitor trends, detect risks, and recommend next steps—empowering commercial, market access, and R&D teams to act faster.

Bring together internal & external data to drive pharma impact
Tellius works with 8 out of 10 top pharma across multiple commercial use cases to improve patient lives to make the world better every day.
.png)
Unleash the full power of data
to insights

Breakthrough Ideas, Right at Your Fingertips
Dig into our latest guides, webinars, whitepapers, and best practices that help you leverage data for tangible, scalable results.

Lessons from Pharma’s Biggest Deals: 5 Market Access Tradeoffs AI Analytics Can Help Model & Improve
When pharma brands strike major deals, they don’t just gain access—they inherit complex tradeoffs. From navigating volume vs. margin to managing payer fatigue, these tradeoffs shape strategy long after contracts are signed. This blog breaks down five recurring tensions in market access and shows how AI-powered analytics helps commercial and HEOR teams model scenarios, simulate outcomes, and move from rigid strategy to adaptive execution.

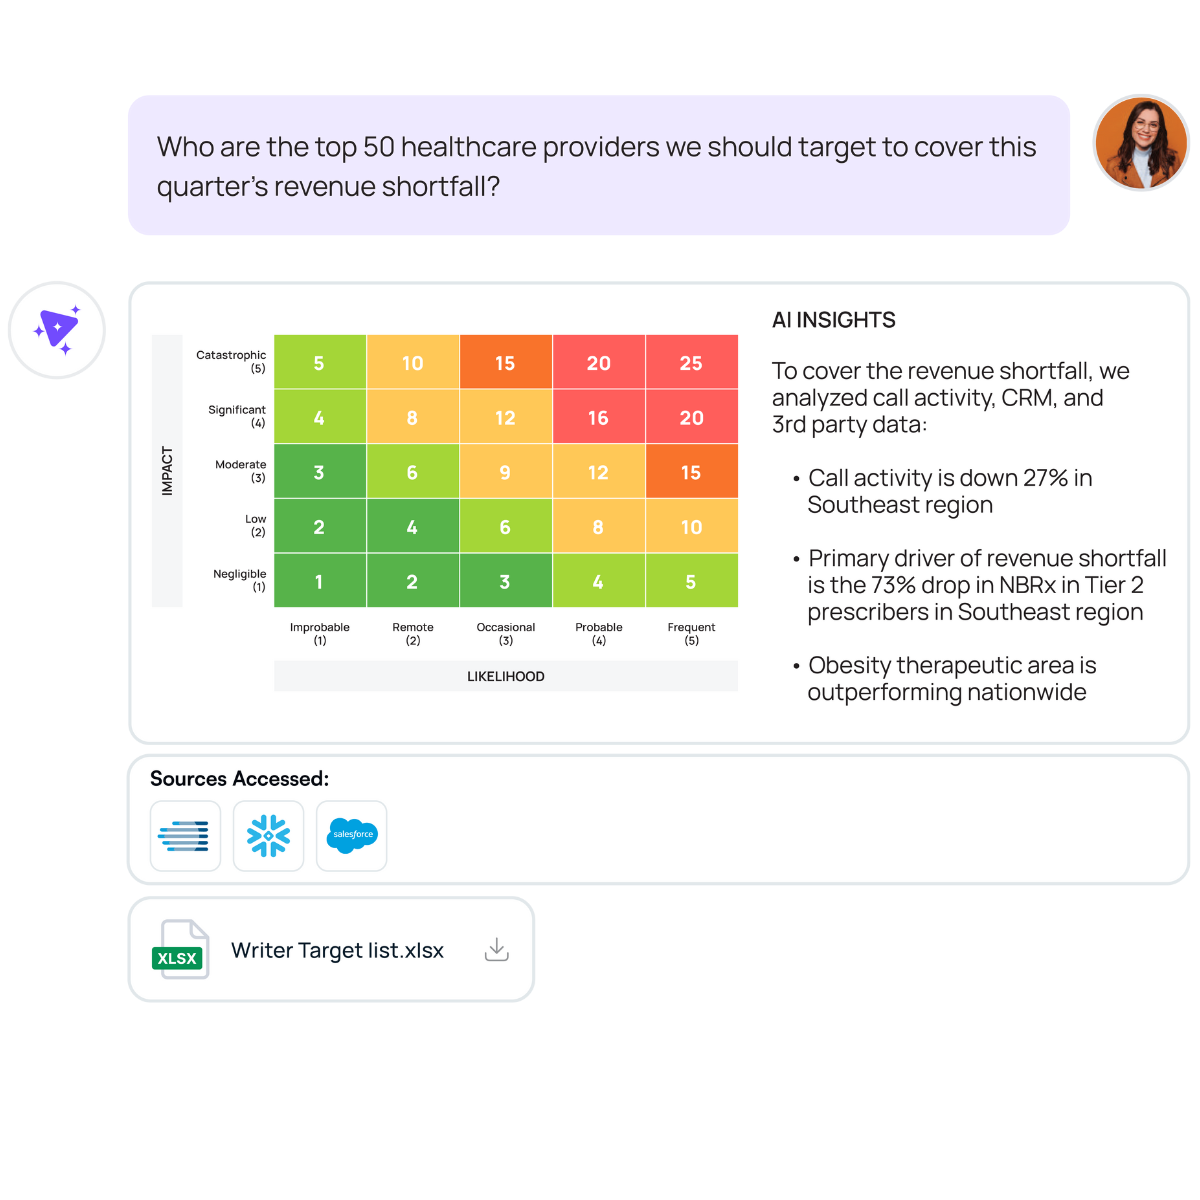
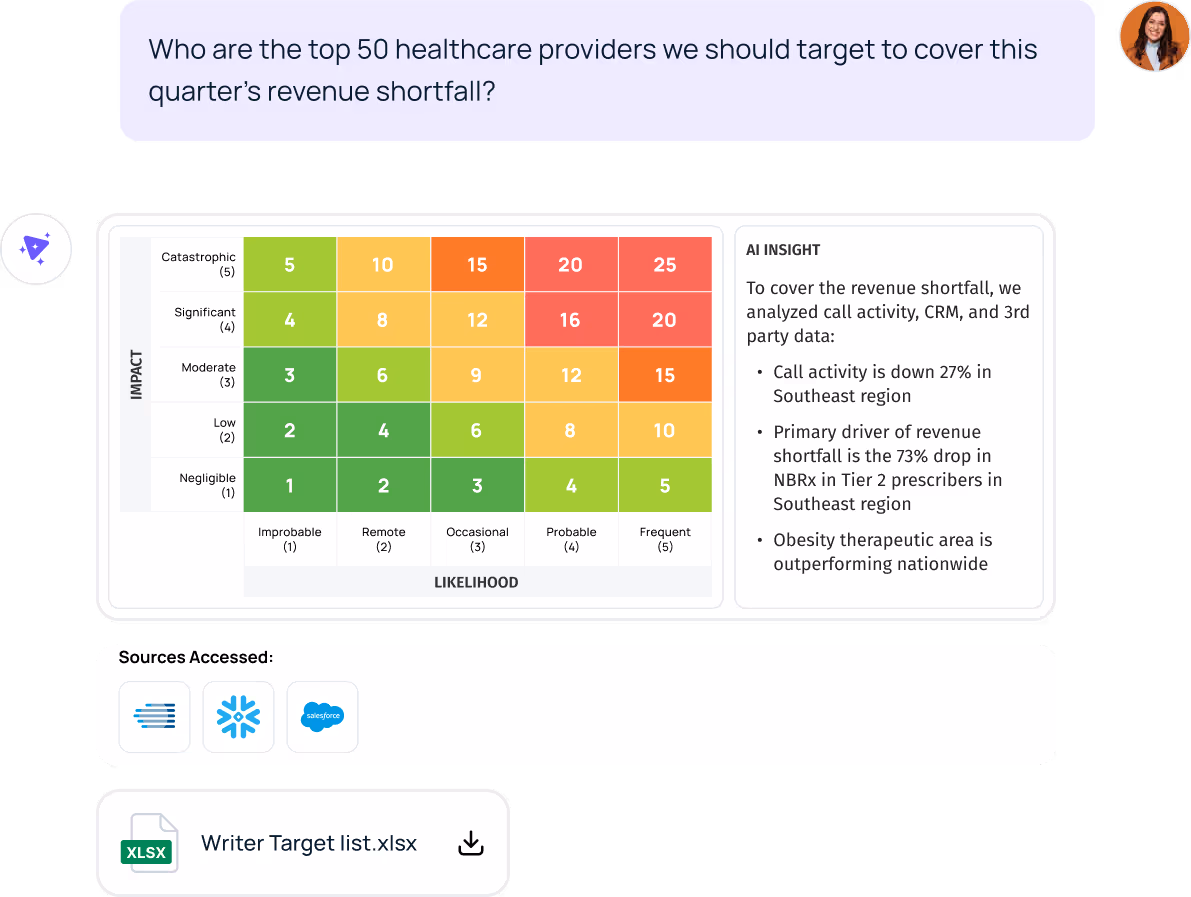
Pharma commercial field sales at Telliuspeed: Why your target lists might be misleading your reps
Too often, commercial pharma reps are working from outdated, imprecise target lists—wasting time on the wrong doctors while missing key growth opportunities. This blog explores how Tellius transforms field sales by turning fragmented data into real-time, physician-level insights. Learn how natural language querying, AI-powered drop lists, and dynamic segmentation help teams respond faster, optimize territory planning, and drive impact at the moment of decision—not just at the end of the quarter.

The Guardrails Are Off. What’s Next for CAR-T Access?
With the FDA’s landmark approval of CAR-T therapies like Abecma and Carvykti as earlier-line treatments, the commercial landscape is shifting rapidly. This blog explores the next phase of CAR-T market access and the analytics brand teams need to navigate it. Learn how to forecast pull-through, identify high-opportunity accounts, and guide sales execution using real-world data, segmentation strategies, and AI-powered insights. From payer dynamics to provider referral patterns, find out what it takes to win in a competitive, high-cost therapeutic space.

Tellius 5.3: Beyond Q&A—Your Most Complex Business Questions Made Easy with AI
Skip the theoretical AI discussions. Get a practical look at what becomes possible when you move beyond basic natural language queries to true data conversations.

Tellius 5.2: Conversational AI for Analytics, Done Right
Tellius 5.2 introduces an adaptive conversational interface with feedback and learnings, enabling two-way dialogue with your cloud-scale data in natural language.

The Pelmorex AI-Driven Analytics Journey
Discover how AI analytics is revolutionizing data-driven decision-making at Pelmorex, a global leader in weather and climate analytics.
.png)
Tellius AI Agents: Driving Real Analysis, Action, + Enterprise Intelligence
Tellius AI Agents transform business intelligence with dedicated AI squads that automate complex analysis workflows without coding. Join our April 17th webinar to discover how these agents can 100x enterprise productivity by turning questions into actionable insights, adapting to your unique business processes, and driving decisions with trustworthy, explainable intelligence.

Snowflake Summit 2023
Tellius is a Green Circle sponsor at Snowflake Summit 2023. Hear how eBay is is taking self-service data exploration to the next level. Stop by Booth 1751 to win some great prizes.
