SKU Rationalization in CPG: Why the Spreadsheet Isn't Enough Anymore

The $50 Billion Problem Hiding in Your Product Portfolio
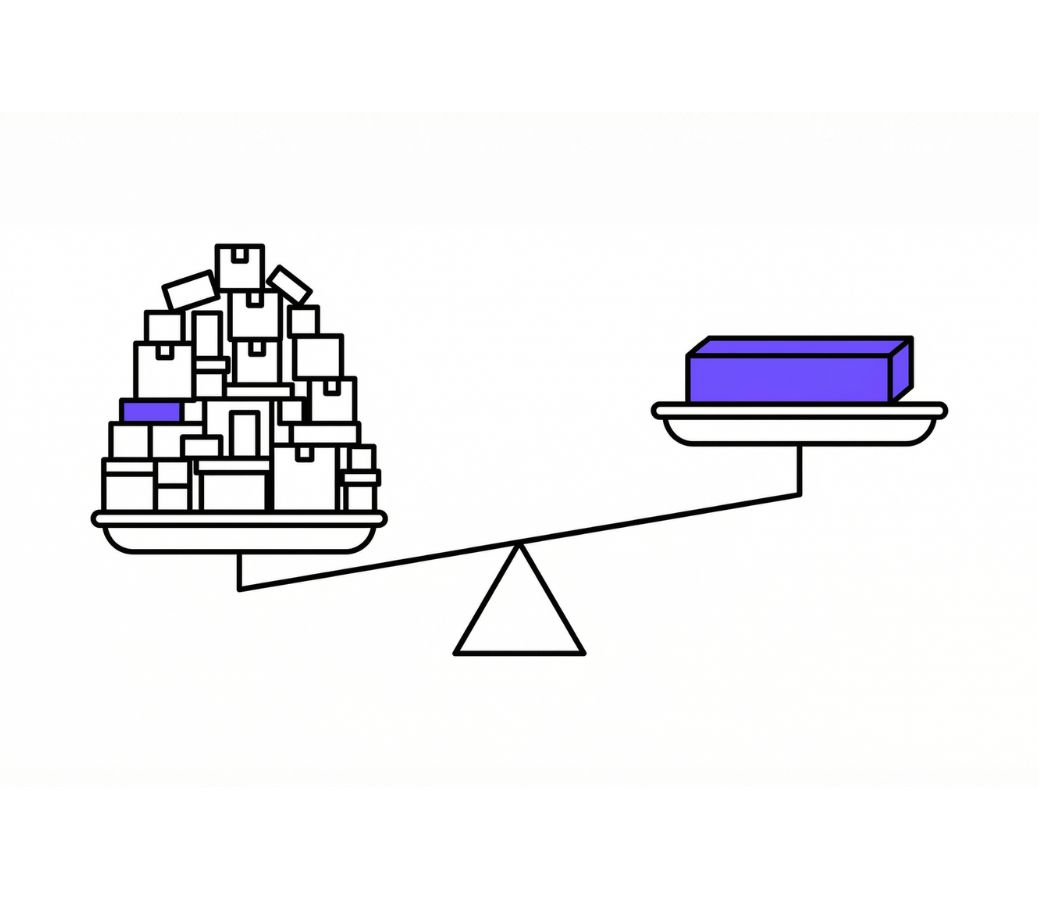
Your portfolio has a weight problem. Not the kind anyone talks about in quarterly business reviews — the kind that quietly bleeds margin while everyone debates whether to cut the Honey Chipotle variant or the Sea Salt & Cracked Pepper.
McKinsey estimates that product complexity costs U.S. food-and-beverage manufacturers alone roughly $50 billion in gross profit. BCG puts the broader CPG figure at $16 billion to $28 billion in profit simply wasted through unnecessary Stock Keeping Unit (SKU) proliferation. These aren't theoretical numbers. They show up as changeover downtime on your production lines, as carrying costs eating 20–35% of your inventory value annually, and as trade spend scattered across SKUs that nobody in your target demo is actually buying.
The typical response — pull a Pareto chart, identify the bottom 20% of SKUs, and start cutting — is the analytical equivalent of a crash diet. It works in the short term. Then the weight comes back. One household products executive told BCG as much: "We cut our SKUs by 60%, but churn hasn't changed. So we will have proliferation again."
The real question isn't which SKUs to cut. It's whether you have the analytical infrastructure to understand why a SKU is underperforming in the first place — and whether the answer is "kill it" or "fix the packaging and reposition against the competitor that just launched in your segment."
What is SKU rationalization and why does it matter in CPG?
SKU rationalization is the strategic process of evaluating every product in a CPG portfolio to decide which to keep, discontinue, renovate, or reposition — reducing complexity while protecting revenue and margin. Unlike traditional approaches that rely solely on structured data like POS sales and margin reports, full-context rationalization integrates consumer review sentiment, competitive intelligence, and market research alongside financial metrics — distinguishing fixable underperformers from true candidates for discontinuation. This combined approach is what separates companies that rationalize once and re-proliferate from those that build lasting portfolio discipline.
Key findings in this analysis:
- Product complexity costs U.S. food-and-beverage manufacturers an estimated $50 billion in gross profit annually (McKinsey)
- 35% of SKUs in a typical CPG company drive zero incremental profitability (Strategy&)
- Successful rationalization programs deliver 1–4pp revenue increase and 3–6pp margin improvement while cutting ~25% of SKUs
- Every major consulting framework — ABC, IPPV, McKinsey Health Card, Bain Simplify to Grow — stops at structured data and misses the consumer intelligence that changes the decision on 10–20% of SKUs under review
What SKU Rationalization Actually Is (and Isn't)
SKU rationalization is not a one-time tail-cutting exercise. It is not a supply chain initiative that marketing can safely ignore. And it is not optional if you plan to remain competitive while the top 25 CPG companies are launching 13% more SKUs year-over-year, more than half of which don't survive a second replenishment cycle.
The math behind the urgency is stark. The average U.S. supermarket carried around 7,000 SKUs in 1970. By 2008, that number had peaked near 51,000. It's since rationalized down to roughly 31,800 items as of 2024, according to FMI. But the underlying proliferation engine hasn't slowed — it's just meeting more resistance from retailers who've learned that more shelf facings don't automatically mean more category dollars.
What percentage of SKUs are typically underperformers in CPG?
Consider Nestlé's portfolio: 100,000 SKUs, of which only 11% account for 80% of sales. Roughly one-third generate just 1% of revenue. Coca-Cola maintained over 400 master brands before its 2020 rationalization, with half being single-country brands contributing 2% of total revenue. These aren't unusual portfolios. They're the industry norm. Your team is almost certainly managing a version of the same problem right now.
The Frameworks Everyone Uses (and Where They Stop Working)
The Analytical Toolkit
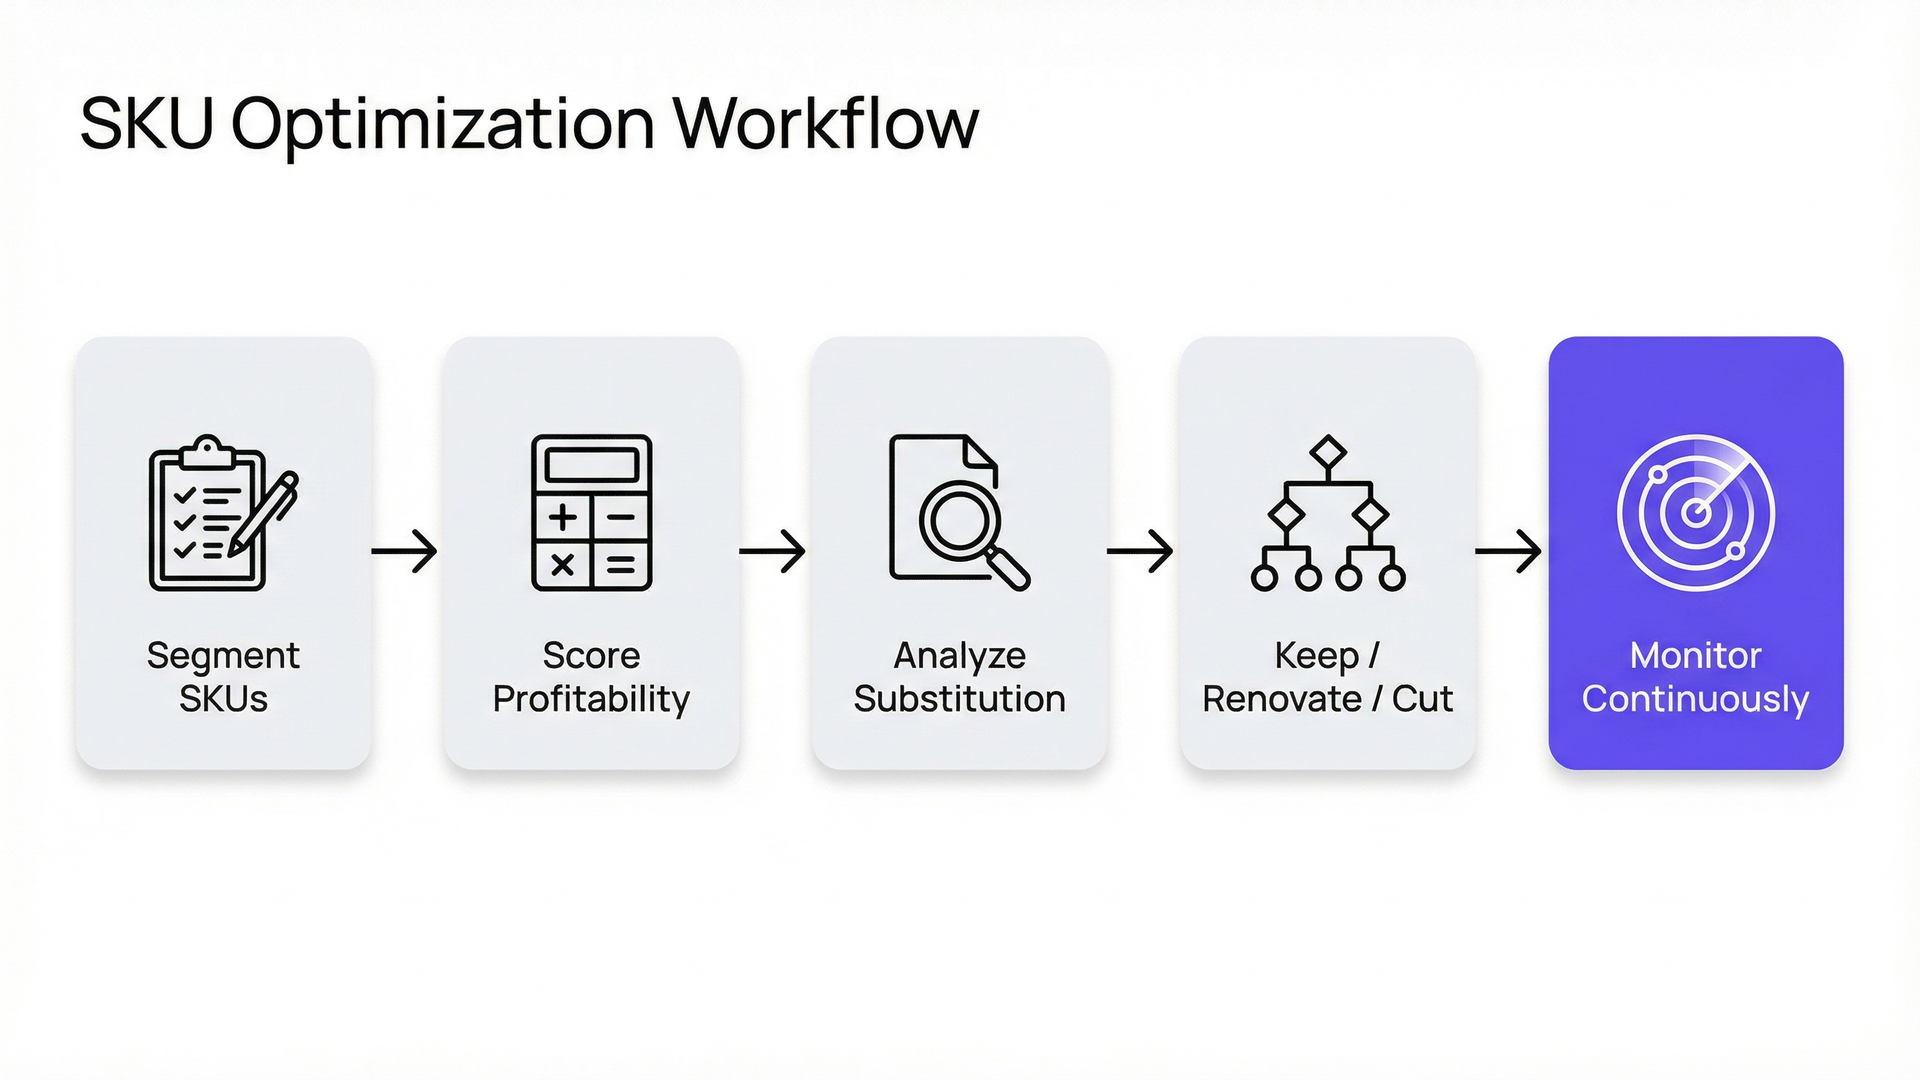
Every major consulting firm has a SKU rationalization methodology, and they all follow the same general arc: segment, score, decide, implement, sustain. The specific frameworks vary in useful ways.
How is SKU rationalization different from assortment optimization?
ABC/ABCDE Analysis is the foundation. Strategy extends the standard ABC classification into five tiers, which reveals that in a typical CPG company, 35% of SKUs drive zero incremental profitability and the bottom 15% actively destroy cumulative gross margin. Simple enough on a spreadsheet — until you realize "profitability" as measured by standard gross margin misses activity-based costs entirely.
Contribution Margin Analysis (true profitability) addresses that gap. Bain's proprietary Complexity P&L models the cost curve from zero complexity upward, revealing the precise marginal cost of each incremental SKU. Their key innovation — Incremental Profit Pool Velocity (IPPV) — combines SKU return on sales, household incremental penetration, and unit profit pool. It's arguably the most rigorous single metric for setting portfolio priorities, and it requires the kind of granular data that most category management teams don't have on hand.
Incrementality and Cannibalization Analysis from NielsenIQ and Bain measures the true marginal value after substitution effects using household panel data. This is where things get interesting — and where the spreadsheet starts breaking. A SKU might look disposable based on its sales rank, but panel data reveals it's the only product attracting a specific shopper segment who would leave the category entirely if it disappeared.
McKinsey's framework adds a useful lens: examine complexity from both the "market back" perspective (what consumers and retailers value) and the "supply forward" perspective (what manufacturing and distribution can efficiently deliver). Their four levers — assortment optimization, design simplification, design-to-value, and process management including a "one in, one out" governance rule — are solid. Bain rejects traditional tail-cutting entirely, positioning their "Simplify to Grow" approach as a growth strategy that funds innovation through simplification, with potential for up to 5% sales uplift.
Where Every Framework Falls Short
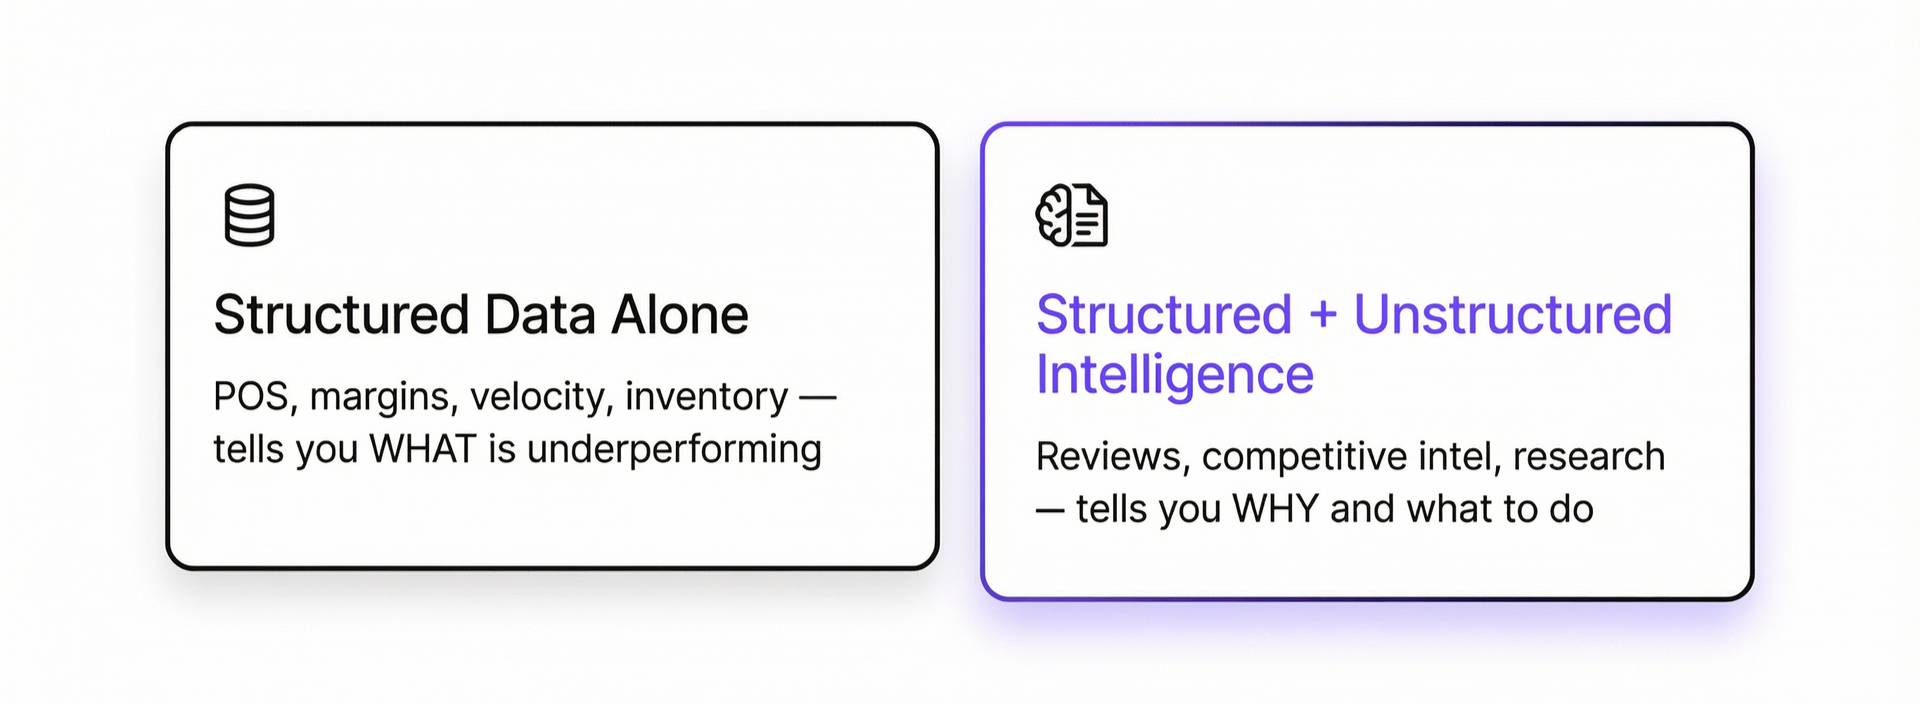
Here's the problem that none of these methodologies adequately solve: they all start and end with structured data. Point-of-sale (POS) figures. Syndicated NielsenIQ or Circana numbers. Margin reports from your Enterprise Resource Planning (ERP) system. Inventory turns. Cost-to-serve estimates.
That data tells your team what is happening. Sales are declining on SKU #4,817. Velocity is below the category average. Margin contribution is negative after activity-based cost allocation.
What it doesn't tell you is why. And the "why" changes the decision.
The Blind Spot: What Structured Data Can't Tell You
Imagine your team is reviewing a beverage SKU whose sales have dropped 18% over two quarters. The structured data — scan data, shipments, margin analysis — all point the same direction: cut it. The SKU sits in the bottom quintile of your contribution margin analysis. Velocity per point of distribution is well below category benchmarks. Your ABC analysis has it firmly in the "Eliminate" bucket.
Why do consumer reviews matter for SKU rationalization?
But here's what the structured data doesn't surface:
Consumer reviews (2,400+ across Amazon and retailer sites) show that customers consistently praise the product's flavor profile and functional benefits. However, a cluster of 340 reviews from the last four months specifically cite the new packaging redesign as the reason they stopped repurchasing. They can't find it on the shelf anymore because it no longer looks like the product they used to buy.
Competitive intelligence buried in a competitor's earnings call transcript reveals they launched a directly competitive SKU at a 15% lower price point in the same segment three months ago — timed to coincide with a Temporary Price Reduction (TPR) blitz at two of your top five accounts.
Shopper panel insights from a consumer research report sitting in someone's SharePoint folder indicate that the underlying need-state this SKU serves (functional hydration for fitness-oriented millennials) is actually growing at 12% compound annual growth rate (CAGR). Your SKU isn't dying because the consumer need is dying. It's dying because of a fixable packaging problem and a competitive response you haven't coordinated against.
The right decision isn't to kill this SKU. It's to revert the packaging, adjust your pricing architecture against the new competitive entry, and potentially increase distribution — because the whitespace is actually expanding.
That analysis requires combining your structured data (POS, margin, velocity) with unstructured intelligence (consumer reviews, competitive filings, market research reports). Today, these two data ecosystems exist in completely separate silos within virtually every CPG organization. Category managers toggle between NielsenIQ dashboards and PDF research reports that may as well live on different planets.
What the Data Proves: ROI Benchmarks That Justify the Work
For teams building the internal business case for a more rigorous approach to SKU rationalization, the benchmarks from successful programs are substantial.
McKinsey's data across multiple engagements shows rationalization delivers a 1–4 percentage point net revenue increase, a 3–6 percentage point margin improvement, and 10–25% asset-productivity gains while trimming SKU count by roughly 25%. L.E.K. Consulting documents 65–90 basis points of gross margin improvement from recent rationalization waves, with an additional 150–175 basis points expected. BCG projects 3–5% margin improvement and up to 5% sales increase from more effective complexity management.
The headline case studies reinforce these ranges:
- Coca-Cola cut 200+ brands (half its portfolio), including shuttering Odwalla entirely — eliminating 300 staff and 230 delivery trucks. The discontinued brands represented only 2% of revenue.
- Unilever pursued a 20%+ SKU reduction under CEO Hein Schumacher. Gross margin expanded 280 basis points to 45.0% in 2024 — the highest in a decade. Their Ice Cream division alone saw 390 basis points of operating margin improvement driven partly by SKU optimization.
- Mondelēz removed 25% of SKUs representing less than 2% of sales.
- Mattel achieved a 30% SKU reduction that saved approximately $797 million in a two-year supply chain simplification.
- A Bain European supermarket case study found that a 40% SKU cut produced a 60% drop in inventory days and a 25% revenue increase — proof that fewer products, better managed, can grow the top line.
A dairy-based beverage brand documented something particularly revealing about true profitability: spoilage costs ranged from 1.2% of net sales on the fastest-moving SKUs to 18% on the slowest — a 16.8-point differential that completely reordered portfolio profitability rankings once activity-based costs were properly allocated. Standard gross margin analysis would have missed this entirely.
Why AI Changes the Math on SKU Rationalization
How does AI improve SKU rationalization compared to traditional approaches?
The traditional SKU rationalization process follows a familiar cycle: a cross-functional team spends 8–12 weeks gathering data from syndicated sources, internal ERP systems, and retailer POS feeds. Analysts build Excel models. The team debates in conference rooms. Decisions get made. The tail gets cut. And then the cycle repeats in 12–18 months because nobody built continuous monitoring into the process and proliferation crept back in.
AI-powered analytics change this equation in three fundamental ways.
From Periodic Reviews to Continuous Monitoring
Instead of treating SKU rationalization as a quarterly or annual exercise, AI agents can monitor portfolio health continuously — flagging anomalies in velocity, margin, distribution voids, and competitive dynamics as they emerge. A SKU that's trending toward the "Eliminate" bucket gets flagged at week 3 of decline, not quarter 3. That early warning is the difference between a surgical intervention (adjust pricing, fix a supply issue, respond to a competitive threat) and an irreversible discontinuation.
For CPG category management teams already drowning in data from five or more sources — NielsenIQ, Circana, Walmart Luminate, Kroger 84.51°, retailer POS, and your own trade management system — the value isn't more data. It's automated pattern recognition across those sources without requiring an analyst to manually reconcile them.
From "What" to "Why" — Automated Root Cause Analysis
What does AI-based SKU rationalization catch that traditional ABC analysis misses?
This is the most significant analytical upgrade. Traditional tools show you that a SKU's velocity declined 15% at Walmart over the last four weeks. Root cause analysis tells you why — decomposing that decline into distribution losses, price gap changes, competitive activity, promotional effectiveness shifts, and seasonal patterns. Automatically. Without a 48-hour analyst queue.
Agentic analytics platforms can go further by interrogating both structured data (your POS and syndicated feeds) and unstructured sources (consumer reviews, competitive filings, internal market research) to surface the full picture. When the root cause is "consumers love the product but hate the new cap design" — something that only surfaces in review data — the decision changes from "cut" to "fix."
From Static Scorecards to Dynamic Portfolio Intelligence
Consulting frameworks like McKinsey's SKU Health Card and Bain's IPPV are powerful — but they're snapshots. They score each SKU at a point in time using whatever data the team assembled for the exercise. AI-driven approaches can maintain those scorecards dynamically, updating them as new data flows in and recalculating incrementality, cannibalization effects, and strategic roles in real time.
The practical impact: your team walks into a Joint Business Planning (JBP) meeting with a retailer armed with current portfolio intelligence, not a deck built on data that's already six weeks stale.
Bridging the Structured-Unstructured Divide: Full-Context Rationalization
No existing SKU rationalization framework — from McKinsey, Bain, BCG, or any analytics vendor — comprehensively addresses how to combine structured analytics with unstructured intelligence in a single analytical workflow. We call this gap the missing middle, and the approach that closes it full-context rationalization. The industry today operates in two completely separate silos.
Silo 1 (where 95% of SKU rationalization work happens) focuses exclusively on structured data: POS sales, margins, inventory turns, cost-to-serve, syndicated data from NielsenIQ and Circana. Every framework, every consulting playbook, every vendor solution starts and ends with rows-and-columns analysis.
Silo 2 (which exists in an entirely different part of the organization) encompasses consumer review analytics, social listening, Voice of Customer (VoC) programs, and shopper research. These tools analyze consumer sentiment at the product level but are never connected to SKU rationalization workflows or portfolio decision-making.
McKinsey acknowledges that qualitative consumer research matters — they mention that "consumer research showed [a product] would attract new customers" as a manual input to portfolio decisions. But it's treated as a separate, offline step. Somebody has to go find the research, read it, synthesize it, and inject their interpretation into the scoring model. At scale, across hundreds or thousands of SKUs, that doesn't happen. The qualitative signal gets lost.
This is where an agentic analytics approach creates a fundamentally different outcome. An AI agent that can simultaneously query your NielsenIQ data, analyze consumer review sentiment for each SKU under evaluation, scan competitive intelligence documents, and reference your internal market research reports — then synthesize all of those inputs into a single, explainable recommendation — isn't doing something incrementally better. It's doing something the current process literally cannot do at scale.
The comparison table makes the gap concrete:
Avoiding the Five Most Common Rationalization Mistakes
How do you prevent SKU proliferation from returning after rationalization?
Even with better analytics infrastructure, SKU rationalization programs fail when teams fall into predictable traps. Here's what the consulting evidence — and the case studies behind it — consistently flags.
Cutting the tail without understanding substitution effects. This is the single most common mistake. A SKU that sells 500 units per month looks expendable until panel data reveals that 40% of its buyers don't purchase a substitute from your portfolio — they leave the category or switch to a competitor. McKinsey specifically warns that "cutting the tail" without understanding strategic roles is suboptimal and can produce unintended consequences, like inadvertently driving up per-unit manufacturing costs for other SKUs on the same production line.
Siloed decision-making. When marketing, sales, supply chain, and finance each optimize for their own metrics, the result is a portfolio that makes no single team fully happy and no financial officer fully confident. Category management needs cross-functional alignment with explicit ownership of the decision criteria and weighting.
Using standard gross margin instead of true profitability. A SKU might show a 35% gross margin on your P&L but generate a negative contribution margin once you allocate changeover costs, warehousing complexity, and spoilage. Without activity-based costing at the SKU level, your team is making decisions on misleading data. The dairy beverage example — where spoilage costs ranged from 1.2% to 18% of net sales depending on the SKU — illustrates how dramatically the picture changes.
No governance against complexity creep-back. Rationalization without ongoing governance is temporary. McKinsey recommends a "one in, one out" rule. Bain advocates for embedding complexity cost calculations into the stage-gate process for new product development. Without one of these mechanisms, your portfolio will re-proliferate within 18–24 months.
Ignoring the qualitative signal. This is the gap this entire article is built around. Financial metrics tell you what to cut. Consumer intelligence tells you what to fix. If your process only has access to the first signal, you will occasionally kill products that consumers love but that have a fixable operational or positioning problem — and you'll find out too late.
Building a Modern SKU Rationalization Capability
How often should CPG companies optimize their product portfolio?
For CPG teams ready to move beyond the spreadsheet-and-committee approach, the path forward combines the rigor of established consulting frameworks with the speed and analytical breadth of AI-powered platforms.
Step 1: Establish your true-profitability baseline. Before scoring anything, make sure your team has activity-based cost data at the SKU level — not just standard gross margin. This single step changes the portfolio picture dramatically for most organizations.
Step 2: Connect structured and unstructured data sources. Your NielsenIQ syndicated data, retailer POS, trade spend system, consumer reviews, competitive intelligence feeds, and internal market research should feed a single analytical environment. Manually toggling between systems means the qualitative signal gets dropped under time pressure, which is always.
Step 3: Automate root cause analysis. When a SKU underperforms, the first question should be "why?" — and it should be answered in minutes, not days. AI agents that can decompose a sales decline into distribution, pricing, competitive, promotional, and consumer sentiment factors give your team the diagnostic power to make the right call.
Step 4: Shift from periodic reviews to continuous monitoring. Flagging portfolio health issues in real time — not waiting for the next quarterly review cycle — means earlier interventions and fewer unnecessary discontinuations.
Step 5: Embed complexity governance. Score new product proposals against portfolio complexity cost before launch. Track complexity metrics alongside revenue and margin in your regular business reviews. Make proliferation visible, and it becomes manageable.
Tellius works with CPG commercial teams to deliver exactly this kind of analytical infrastructure. Tellius is an agentic analytics platform purpose-built for CPG — deploying AI agents that work across your enterprise data, structured and unstructured, to automate root cause analysis, deliver continuous monitoring, and produce finished analytical artifacts for retailer meetings, business reviews, and portfolio decisions. Unlike BI tools that require analysts to manually query each data source, Tellius agents interrogate POS, syndicated, cost, review, and competitive data simultaneously — turning weeks of manual category review work into same-day insights.
Get release updates delivered straight to your inbox.
No spam—we hate it as much as you do!


The answer depends on where your bottleneck sits. SymphonyAI and Blue Yonder offer mature category management suites with strong structured-data analytics, planogram integration, and retailer-level optimization. HIVERY specializes in AI-driven assortment and space planning with sophisticated incrementality modeling. RELEX Solutions combines demand forecasting with assortment optimization in an integrated supply chain workflow. NielsenIQ and Circana provide the syndicated data foundations most rationalization efforts depend on. Each handles the structured-data side of rationalization well. Where most fall short is processing the unstructured intelligence — consumer reviews, competitive filings, internal market research — that changes the decision on 10–20% of SKUs under review. Tellius is purpose-built for teams that need structured and unstructured data in a single analytical workflow, with automated root cause analysis and continuous monitoring rather than periodic snapshots. The right choice depends on whether your team's bottleneck is structured data modeling or the lack of qualitative intelligence in the same room as the numbers.
Five capabilities separate platforms that accelerate portfolio decisions from those that just produce prettier dashboards. First, structured and unstructured data processing in one workflow — can the platform analyze POS alongside consumer reviews and competitive intelligence without manual data wrangling? Second, continuous monitoring versus periodic snapshots — does it flag portfolio health issues in real time or wait for your team to run a report? Third, automated root cause analysis — when a SKU declines, does the platform explain why in minutes, or does your analyst still spend two days building a deck? Fourth, speed to category review — can your team complete a full portfolio assessment in days rather than the typical 8–12 weeks? Fifth, self-service versus dedicated analytics team — can category managers and commercial leads use it directly, or does every question route through a data science queue? Platforms that require a dedicated analytics team to operate create the same bottleneck they were supposed to eliminate.