Assortment Optimization for CPG: Why Your Portfolio Decisions Are Running on Half the Available Intelligence


What is assortment optimization in CPG?
Assortment optimization is the data-driven process of determining which products to keep, discontinue, or introduce across a CPG company's portfolio—balancing consumer demand, margin contribution, supply chain complexity, and retailer requirements at the SKU level. Unlike traditional SKU rationalization that ranks products by velocity and cuts the tail, modern assortment optimization uses AI to evaluate every product's role across the full business system: from manufacturing complexity to shelf-level incrementality to competitive substitution dynamics.
The uncomfortable reality: your team is making these decisions with half the available intelligence. NielsenIQ's analysis of global shelf performance found that 83% of SKUs in US pet care contribute less than 2% of overall category sales. Household care sits at 79%. Alcohol at 78%. In Western Europe, over 70% of all sales come from just 2% of SKUs. These numbers aren't a secret—every category manager has seen some version of this chart. The question is why, after decades of rationalization efforts, the problem persists.
The answer isn't that CPG companies lack data. It's that they lack the right kind of data in the same room as the data they already have.
The Assortment Crisis: Price-Led Growth Is Over and Portfolios Aren't Ready
For three years, the CPG industry papered over portfolio problems with price increases. That era is ending.
Bain's 2025 Consumer Products report quantifies the reckoning: global consumer products retail sales reached $7.5 trillion in 2024, but roughly 75% of growth came from price increases, not volume. Average EBIT margins are near a 10-year low at 12.2%. More than 75% of executives now plan to rationalize SKUs, brands, or their market portfolio. Deloitte's 2026 outlook puts a finer point on it: only 2% of consumer products executives plan to use pricing as a growth strategy going forward. The industry is transitioning from what Deloitte calls "aisle-spanning conglomerates to more focused, category-killer portfolios."
Meanwhile, the companies capturing growth aren't the incumbents. Circana's New Product Pacesetters analysis found that 59% of successful new branded product launches in 2023 came from manufacturers with sales under $500 million—up from 41% in 2022 and 35% in 2021. These smaller companies accounted for 43% of Pacesetter dollars. The innovation advantage has shifted decisively toward companies that are faster, more consumer-attuned, and less burdened by portfolio complexity.
For large CPGs, this isn't a competitive nuisance. It's an existential portfolio problem. Every low-performing SKU consuming manufacturing capacity, shelf space, and trade dollars is a resource not available to compete with the insurgents who are eating your category growth.
Companies that have done the hard work of portfolio restructuring show what's possible. Smucker's eliminated 30% of its SKUs—products that generated just 3% of revenue. Kraft Heinz reduced approximately 20% of its SKU count to focus on higher-growth items. Hain cut 50% of its long-tail SKUs to increase organizational focus. P&G consolidated or eliminated roughly 100 brands that contributed only about 6% of total profit. In each case, the portfolio shrank and performance improved—not because fewer products is inherently better, but because the remaining products finally got the resources they deserved.
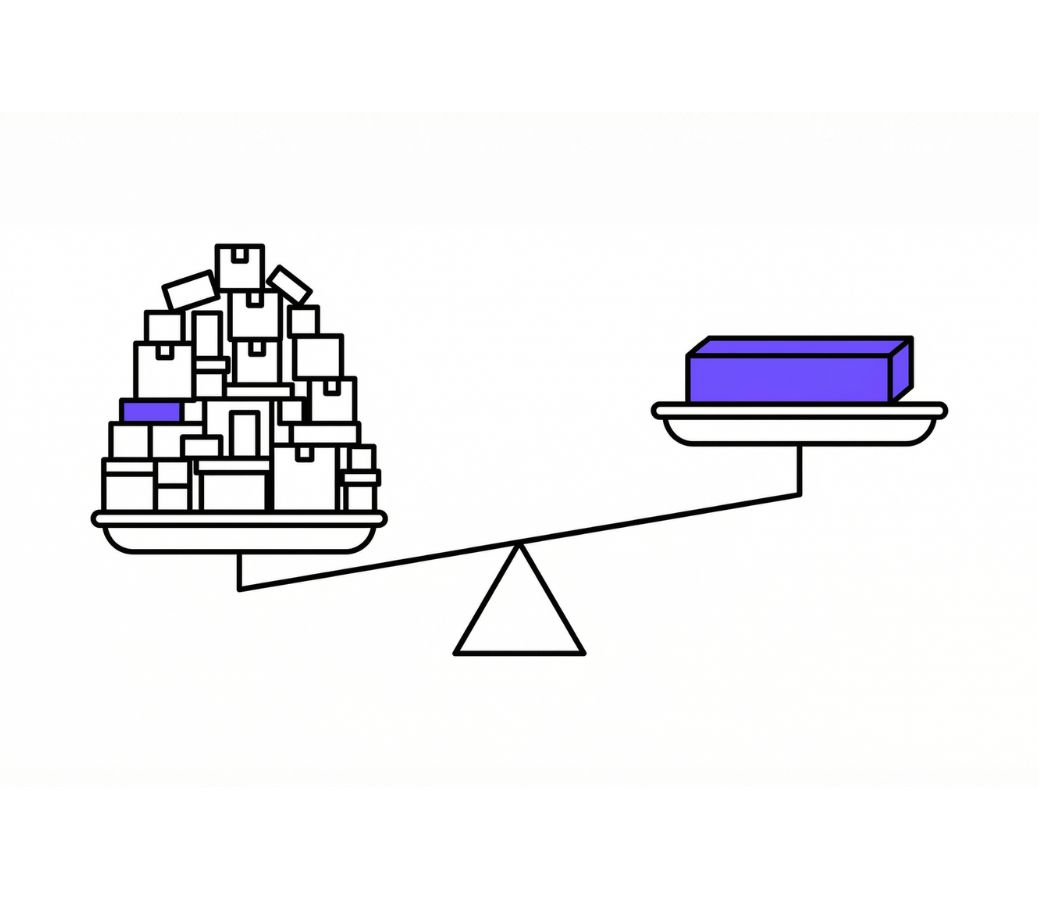
Bain's data across these programs is specific: CPG companies with a repeatable commercial model that optimizes assortment alongside pricing and promotion see sales growth increase by 3 to 5 percentage points and gross margin improve by 200 to 300 basis points. Strategy& (PwC) found that Class A SKUs—just 28% of a typical portfolio—drive 80% of cumulative gross margin. The other 72% is, at best, along for the ride.
The Private Label Squeeze Changes the Math
How should CPG brands adjust assortment strategy as private label grows?
Here's the pressure that makes all of this urgent rather than important: private label is no longer the downmarket alternative your team can dismiss.
Private label sales are projected to reach $277 billion in 2025, up from $220 billion in 2021—a 23.6% gain in three years. Growth is running at roughly twice the rate of national brands. US private label value share has topped 20%, and in Europe it's reached 38.5%. NielsenIQ reports that 53% of global consumers are increasingly purchasing more private label products. Branded products sell at a 26% premium versus private label—and 78% of grocery searches on Amazon are unbranded, meaning consumers aren't even starting their purchase journey with a brand preference.
The math creates a vise. Retailers control both the shelf space and their own private label alternatives. Private-label margins can exceed 40% versus national brand grocer margins of 25–35%. Walmart's Bettergoods launch (300 items) was the largest private label food launch in 20 years. Target's owned brands generate over $30 billion annually.
For CPG manufacturers, this means assortment optimization is no longer a margin improvement exercise. It's a shelf-defense strategy. Every underperforming SKU in your portfolio is a shelf slot a retailer can reallocate to their own brand—and every one they do reallocate is extraordinarily difficult to win back.
Why Traditional Assortment Planning Keeps Failing
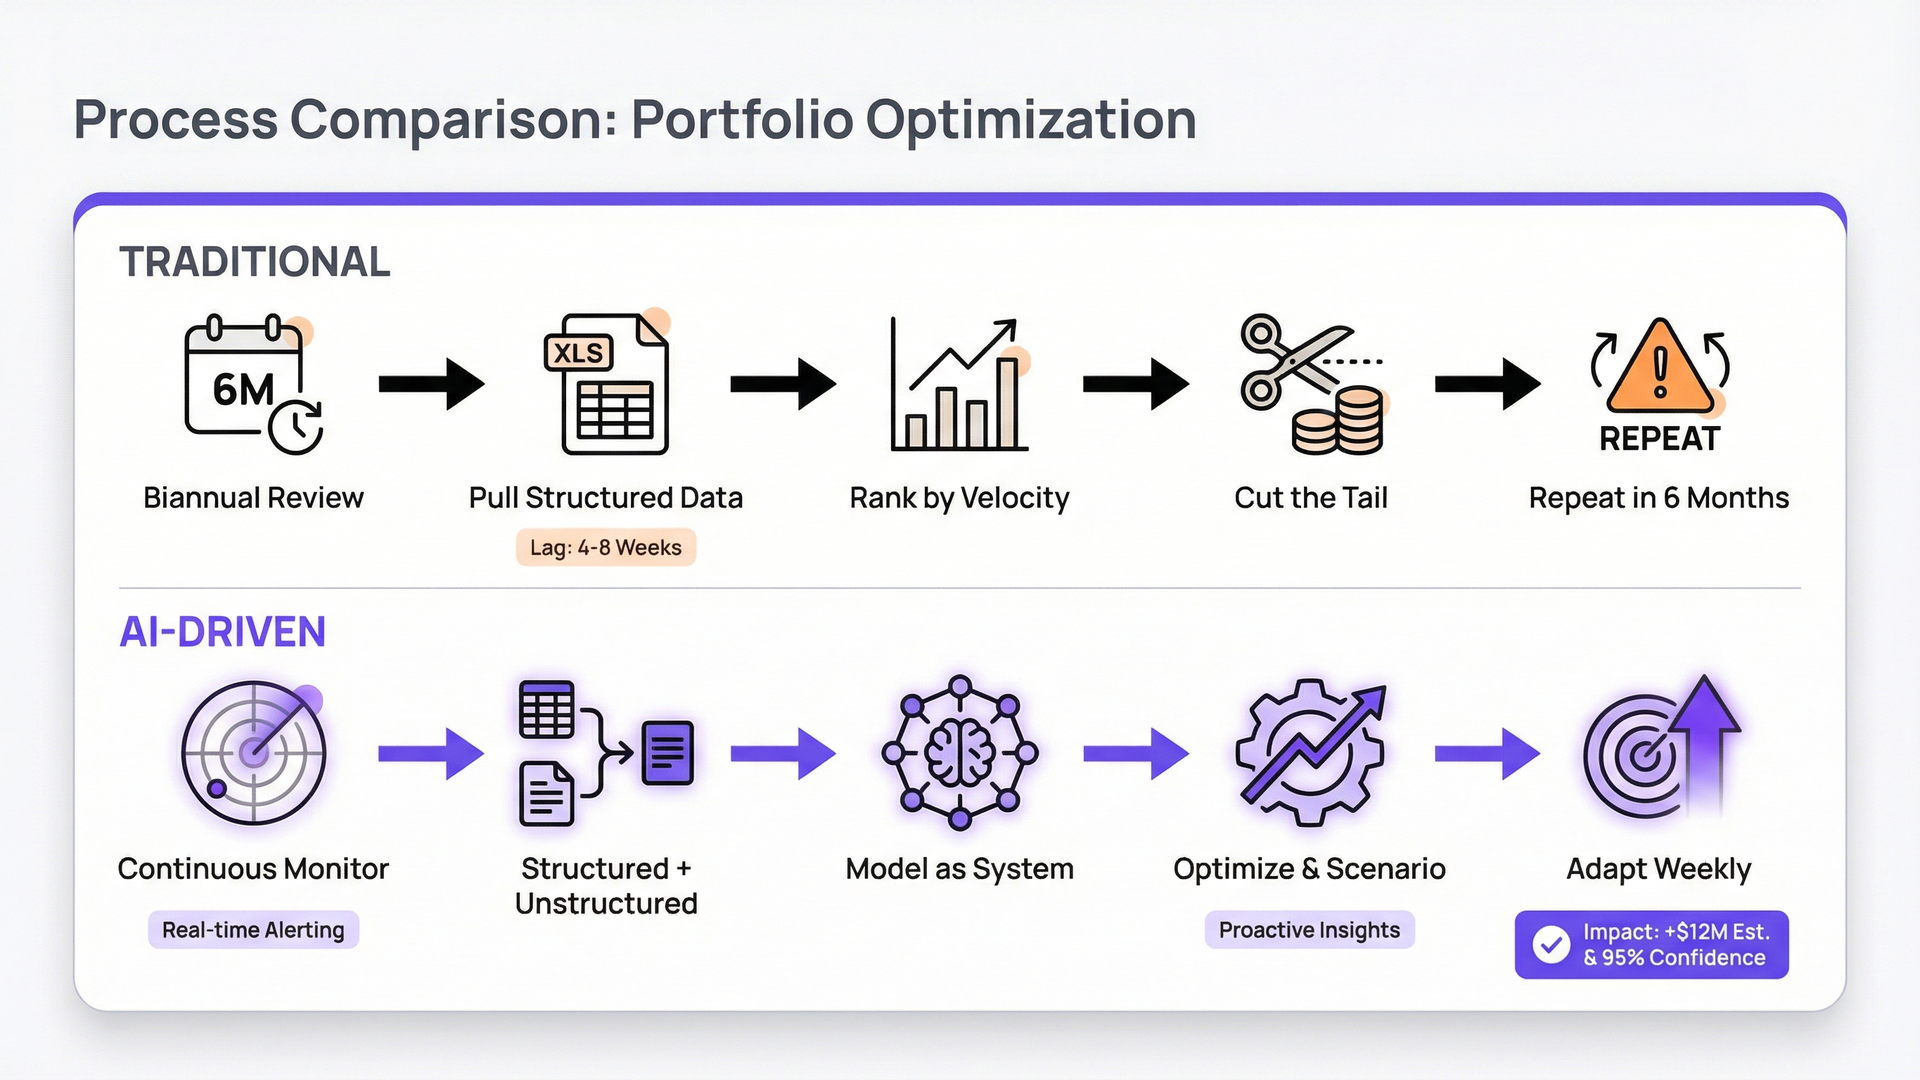
Most CPG companies run some version of the same playbook: once or twice a year, a cross-functional team pulls syndicated data from NielsenIQ or Circana, layers in internal shipment and margin data, ranks SKUs by some combination of velocity and profitability, and draws a line. The approach has been failing for decades—and the reason is structural, not executional.
It uses structured data exclusively. POS data, margin reports, ACV distribution, inventory turns. These sources tell your team what is happening: declining velocity, lost distribution, eroding share. They don't tell you why. Why did the buyer at Kroger decline your new size? (The call notes from your account manager explain it was a planogram constraint, not a performance issue.) Why is a SKU losing velocity in the Southeast? (Consumer reviews on Amazon reveal complaints about a reformulation your team thought was invisible.) Why is a niche competitor gaining in natural grocery? (Social listening shows a trending ingredient claim your portfolio doesn't carry.)
That qualitative context—the why behind the what—lives in unstructured data: consumer reviews, retailer meeting notes, category review decks, syndicated research reports, social listening data, competitive intelligence documents. IBM reports that 90% of global data is now unstructured and growing four times faster than structured data, but less than 1% of unstructured data is being used in generative AI applications today.
Your category managers know this intuitively. When an experienced category manager leaves, the institutional knowledge they carry—which retailers respond to which arguments, which competitive dynamics matter in which channels, which consumer trends are real versus noise—walks out the door. That's not a data problem. It's an intelligence architecture problem.
It treats assortment as a periodic event. Category reviews take 4–6 weeks of manual data wrangling. By the time the analysis is ready, the competitive landscape has shifted. Traditional merchandising solutions, as HIVERY points out, have remained "relatively static since the 1980s." Your market now needs decisions within six weeks—or six days.
It evaluates products in isolation. Traditional analysis ranks each SKU independently. It doesn't model what happens to transferable demand when you cut a SKU. It doesn't account for price-tier architecture—the low-margin item that anchors the price ladder and protects your premium. It doesn't model retailer-level consequences—the SKU that exists solely to meet a specific retailer's assortment requirement, where cutting it means losing shelf space that won't come back.
What Assortment Intelligence Actually Requires: Both Hemispheres
Why do consumer reviews matter for assortment optimization?
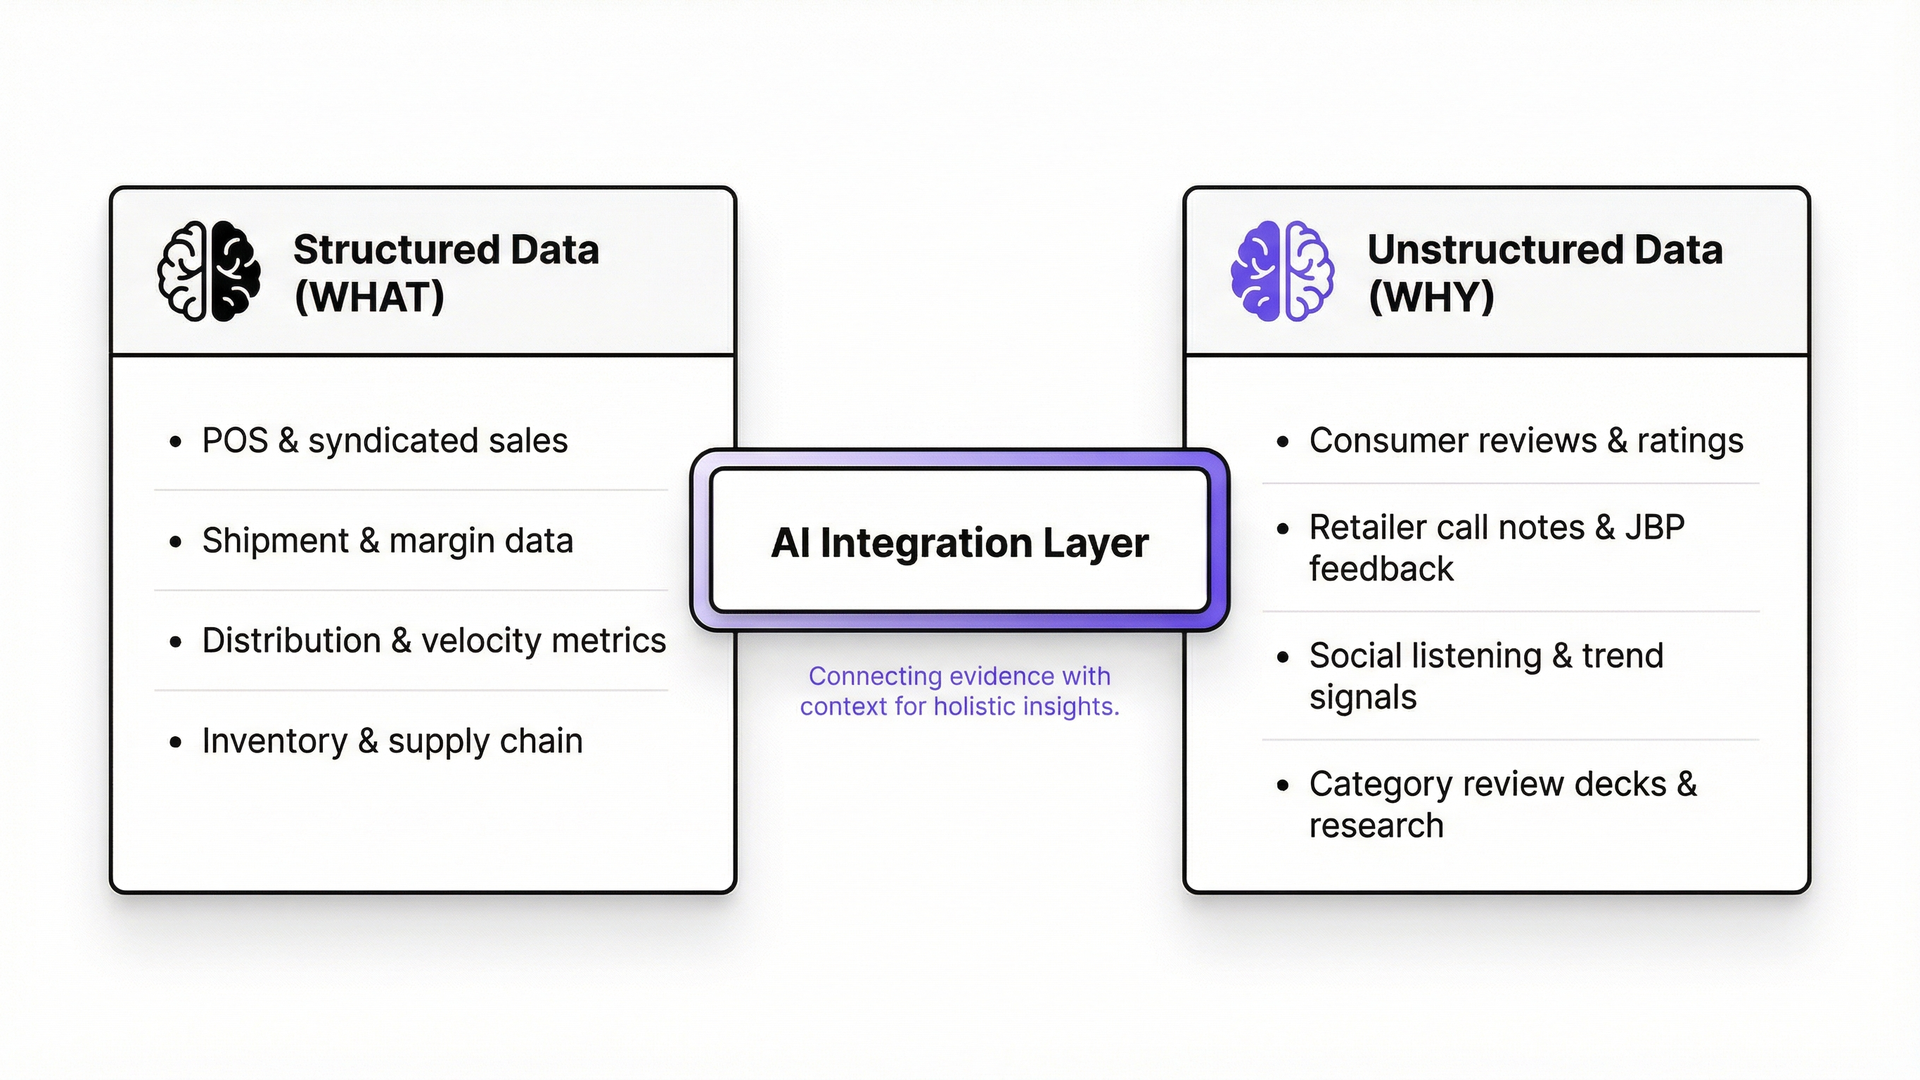
Think of your assortment data as having two hemispheres—like a brain.
The left hemisphere is structured data: POS sales from NielsenIQ and Circana, retailer-specific sell-through data from Walmart Luminate or Kroger 84.51°, internal shipment and margin data from your ERP, ACV distribution, Total Distribution Points (TDP), inventory turns, Gross Margin Return on Investment (GMROI). This is the foundation. It tells you what is happening across your portfolio with precision.
The right hemisphere is unstructured data: consumer reviews and ratings, social listening signals, retailer call notes and Joint Business Planning (JBP) meeting feedback, category review decks and presentations accumulated over years, syndicated research from Mintel and Euromonitor, competitive intelligence, and the institutional knowledge your experienced category managers carry in their heads. This tells you why it's happening and, critically, what to do about it.
True assortment intelligence requires both hemispheres working together. And right now, nearly every assortment optimization tool on the market—SymphonyAI, Blue Yonder, RELEX, HIVERY, Insite AI—operates almost exclusively in the left hemisphere. They're sophisticated at processing structured data: modeling incrementality, generating planograms, running cluster-level optimization. But they can't process a consumer review, surface a pattern in retailer meeting notes, or synthesize a Circana trend report with your sales data.
Here's what the integration looks like in practice:
A SKU shows declining velocity. Structured data tells your team that sales are down 8% over 13 weeks. Traditional analysis flags it for rationalization. But Natural Language Processing (NLP) analysis of Amazon reviews reveals a wave of complaints about a recent packaging change—consumers can't reseal the bag. That's not a rationalization problem. It's a packaging fix that preserves a $15 million SKU.
Syndicated data shows zero distribution at a top-10 retailer. Your team marks it as a distribution void to address. But the account manager's call notes from the last buyer meeting reveal the specific objection: the buyer wants a different case pack configuration for their shelf set, and a competitor just launched a flanker targeting the same space. That context completely changes the action plan—from "push harder" to "redesign the pitch."
Social listening surfaces rising consumer interest in a trending ingredient. Your category team won't see it in POS data for another 6–12 months. But combining the social signal with your existing portfolio analysis identifies exactly which retailer and which shelf section has the white space to test a new item first—turning a reactive launch into a proactive one.
MIT Sloan Management Review reported that one skin care manufacturer doubled its product success rate and halved development costs using social listening insights integrated into product decisions. That's the ROI gap between half-intelligence and full-intelligence assortment optimization.
How AI Changes the Equation
How does AI improve assortment optimization vs. traditional approaches?
McKinsey estimates that for a $10 billion food and beverage company, the value at stake from digital and AI transformation is $810 million to $1.6 billion—representing a 7 to 13 percentage point increase in EBITDA margin. Generative AI specifically could contribute an additional $160 billion to $270 billion annually in EBITDA across the CPG industry globally. Yet the same research notes that no CPG player has truly scaled its AI capabilities, and the industry is adopting gen AI at lower rates than other sectors.
AI shifts assortment optimization from a periodic, analyst-intensive exercise to a continuous, automated capability in three ways that matter for your team.
Continuous monitoring replaces periodic reviews. An AI system can evaluate every SKU's performance across every retailer on a weekly basis, flagging anomalies and shifts before they compound. The category review that took your team 4–6 weeks of manual wrangling can be reduced to under 3 days. A SKU losing velocity at three retailers simultaneously surfaces as an alert this week—not as a footnote in next quarter's review.
Multi-factor optimization replaces single-dimension rankings. Instead of velocity × margin, AI evaluates each SKU across the full business system simultaneously: margin contribution, volume role, portfolio architecture function (price-tier anchor, trial driver, loyalty builder), supply chain complexity cost, retailer-specific distribution requirements, competitive substitution risk, consumer sentiment trajectory, and trend alignment. NielsenIQ's four-quadrant incrementality framework—mapping each SKU on rate-of-sale versus incrementality to classify as Rationalize, Develop, Monitor, or Niche—is the right conceptual model. AI makes it operational at scale, updated continuously rather than once per review cycle.
Forward-looking intelligence replaces backward-looking analysis. Historical POS data tells you where you've been. AI-driven forecasting combined with consumer sentiment signals, competitive launch tracking, and retailer strategy indicators tells you where you're headed. This is particularly important for new product introduction (NPI) decisions. Rather than launching and waiting 12 months, AI can model expected portfolio impact before launch—projecting cannibalization, incremental demand, and retailer-level performance based on analogous introductions.
Where Assortment Fits in Revenue Growth Management
Assortment optimization doesn't exist in a vacuum. For most CPG companies, it sits within a broader Revenue Growth Management (RGM) framework alongside pricing, trade promotion, and mix management. The connection matters because decisions in one area cascade into the others.
Your trade promotion budget is finite. Spreading it across 200 SKUs means diluting investment per SKU below the threshold where promotions actually generate incremental volume—which explains why nearly 6 in 10 CPG trade promotions don't break even. Rationalize the portfolio to 150 SKUs and the same trade budget concentrates on items with demonstrated incrementality. Pricing architecture depends on portfolio structure: the premium tier needs a mid-tier reference point to anchor perceived value. Cut the wrong items and your pricing strategy unravels.
The most effective CPG commercial teams treat assortment, pricing, promotion, and mix as a connected system. A platform that can model across all four simultaneously—rather than optimizing each in a silo—produces recommendations that actually survive contact with the market.
What the Best Companies Do Differently
The industry is shifting from what HIVERY calls "averages of averages" to store-level precision. McKinsey reports that retailers could realize an additional 2–4% sales increase through localized portfolios, and that winning CPG companies are more than twice as likely to employ a consumer-data platform integrating data from multiple sources—including retailer data, behavioral insights, and syndicated data.
These companies share several characteristics. They replace rather than just cut—finding gap-filling innovations where rationalization creates whitespace. They model transferable demand at the retailer level rather than assuming national-average substitution patterns. They connect category management to supply chain planning so that complexity costs are visible alongside commercial performance. And increasingly, they integrate unstructured intelligence—consumer sentiment, retailer feedback, competitive signals—into the same analytical workflow as their structured data.
The companies winning this shift aren't the ones with more analysts. They're the ones with AI doing the diagnostic work at a speed and granularity that human teams can't match.
The Agentic Analytics Approach
Tellius is an agentic analytics platform purpose-built for CPG commercial teams. It connects to the structured data sources your team already uses—NielsenIQ, Circana, retailer data platforms, internal ERP and planning systems—and the unstructured data that traditional tools ignore: consumer reviews, retailer call notes, category review decks, research reports, and competitive intelligence documents. AI agents automate the diagnostic work that currently consumes your analysts' time: continuous SKU performance monitoring with automated root cause analysis that surfaces why a SKU is declining (not just that it's declining), retailer-level impact modeling for rationalization scenarios, and category review preparation in hours instead of weeks.
Unlike dedicated assortment tools that process structured data only, or horizontal BI platforms that require manual analysis of every question, Tellius deploys AI agents that reason across both hemispheres—querying POS data for the what and consumer reviews, retailer feedback, and research for the why—and delivering recommendations with the context your team needs to act.
Key Findings
- 83% of pet care SKUs contribute less than 2% of category sales; similar patterns hold across household care and alcohol (NielsenIQ)
- 75%+ of CPG executives now plan SKU, brand, or market portfolio rationalization (Bain 2025)
- Class A SKUs (28% of portfolio) drive 80% of cumulative gross margin; the remaining 72% is at best a passenger (Strategy&)
- 59% of successful new product launches in 2023 came from manufacturers under $500M in sales (Circana)
- 200–300 basis points in gross margin improvement from a repeatable commercial model optimizing assortment (Bain 2025)
- $277 billion in projected US private label sales in 2025, growing at 2x the rate of national brands
- 90% of global data is unstructured, but less than 1% is used in gen AI applications (IBM)
- $810M–$1.6B value at stake from AI transformation for a $10B F&B company (McKinsey)
Get release updates delivered straight to your inbox.
No spam—we hate it as much as you do!


Incrementality measures whether a SKU generates sales that wouldn't exist without it, versus sales that would transfer to another product. NielsenIQ's four-quadrant framework classifies SKUs as Rationalize, Develop, Monitor, or Niche based on rate-of-sale versus incrementality. Cannibalization above 20% signals a SKU is displacing rather than growing category sales.
ABC analysis ranks SKUs by a single metric, evaluates each independently, and stops there. It misses at least four things that determine whether a rationalization decision actually improves your portfolio. First, transferable demand — the portion of a cut SKU's sales that shifts to competitors rather than staying in your portfolio, which varies dramatically by retailer and can't be modeled with national averages. Second, consumer sentiment trajectory — a low-velocity SKU with rising review scores and a fixable complaint is a different decision than a low-velocity SKU consumers have abandoned. Third, complexity costs that aren't visible in margin data — the manufacturing line changeovers, warehouse splits, and trade spend dilution that make a "profitable" SKU unprofitable at the system level. Fourth, portfolio architecture function — the niche item that anchors your price tier, satisfies a specific retailer's assortment requirement, or prevents a shelf slot from going to private label. AI optimization evaluates all of these simultaneously and continuously, catching what ABC structurally cannot.
AI-driven monitoring should flag anomalies weekly, replacing the biannual "big bang" review with continuous intelligence. Layer monthly competitive trend checks, quarterly portfolio architecture deep dives, and annual strategic direction-setting on top. The goal: quarterly reviews informed by months of accumulated both-hemispheres AI monitoring rather than weeks of retrospective data wrangling.
It depends on where your team's bottleneck actually sits. Several platforms do structured-data assortment modeling well. SymphonyAI offers end-to-end retail and CPG analytics with strong planogram and space optimization capabilities. HIVERY specializes in store-level assortment simulation, letting teams model SKU changes at individual locations rather than cluster averages. Blue Yonder provides enterprise-grade supply chain and category management within its broader planning suite. RELEX combines demand forecasting with space and assortment planning, particularly strong in grocery.
Where these platforms share a limitation is on the unstructured side. None of them process consumer reviews, retailer meeting notes, or qualitative research as part of the optimization workflow — which means your team is still manually synthesizing the why behind every what the tool surfaces. Tellius is purpose-built for teams that need structured analytics and unstructured intelligence in one workflow: AI agents that query POS data for the performance signal and consumer reviews, retailer feedback, and category decks for the diagnostic context, delivering root-cause recommendations rather than ranked lists. The right choice depends on whether your bottleneck is structured data modeling or the lack of qualitative intelligence integrated into the same decision.
Five criteria separate platforms that accelerate category decisions from ones that just centralize data. First, can it process both structured and unstructured data in one workflow — or does your team still need to manually cross-reference reviews, call notes, and research against the tool's output? Second, does it monitor continuously or generate periodic snapshots — because a quarterly refresh means your team is always reacting to last season's reality. Third, how fast can it get your team from raw data to a category review recommendation? If the answer is still measured in weeks, the AI is a faster spreadsheet, not a capability shift. (Tellius targets under three days per category review.) Fourth, how deep is the scenario modeling — can it simulate retailer-level transferable demand, portfolio architecture impact, and downstream pricing effects for a rationalization decision, or does it just rank and cut? Fifth, does it require a dedicated analytics team to operate, or can commercial teams run their own analyses? The platforms that score well on all five tend to compress the time between signal and decision — which, in a market where private label is taking shelf space in real time, is the capability that matters most.
SKU Rationalization in CPG: Why the Spreadsheet Isn't Enough Anymore
SKU rationalization in CPG isn’t just “cut the bottom 20%.” This post explains why spreadsheet-led, structured-data-only frameworks (POS, margin, velocity) miss the real why behind underperformance—and how full-context rationalization combines structured metrics with unstructured intelligence (reviews, competitive signals, research) to separate “kill it” SKUs from “fix it” opportunities. It also shows how agentic analytics enables continuous monitoring and automated root-cause decomposition so portfolio decisions stay current instead of stale.