Pharma Incentive Compensation Analytics: Why Reps Build Shadow Spreadsheets and How AI Fixes It
.webp)

In short: Pharma IC analytics uses AI to do what your calculation engine can't—explain why someone's payout changed, flag fairness issues before they blow up, and let reps get answers without filing a ticket. It sits on top of whatever you're already using (Varicent, Xactly, Excel, doesn't matter) and makes the whole thing actually queryable.
The Shadow Spreadsheet Problem
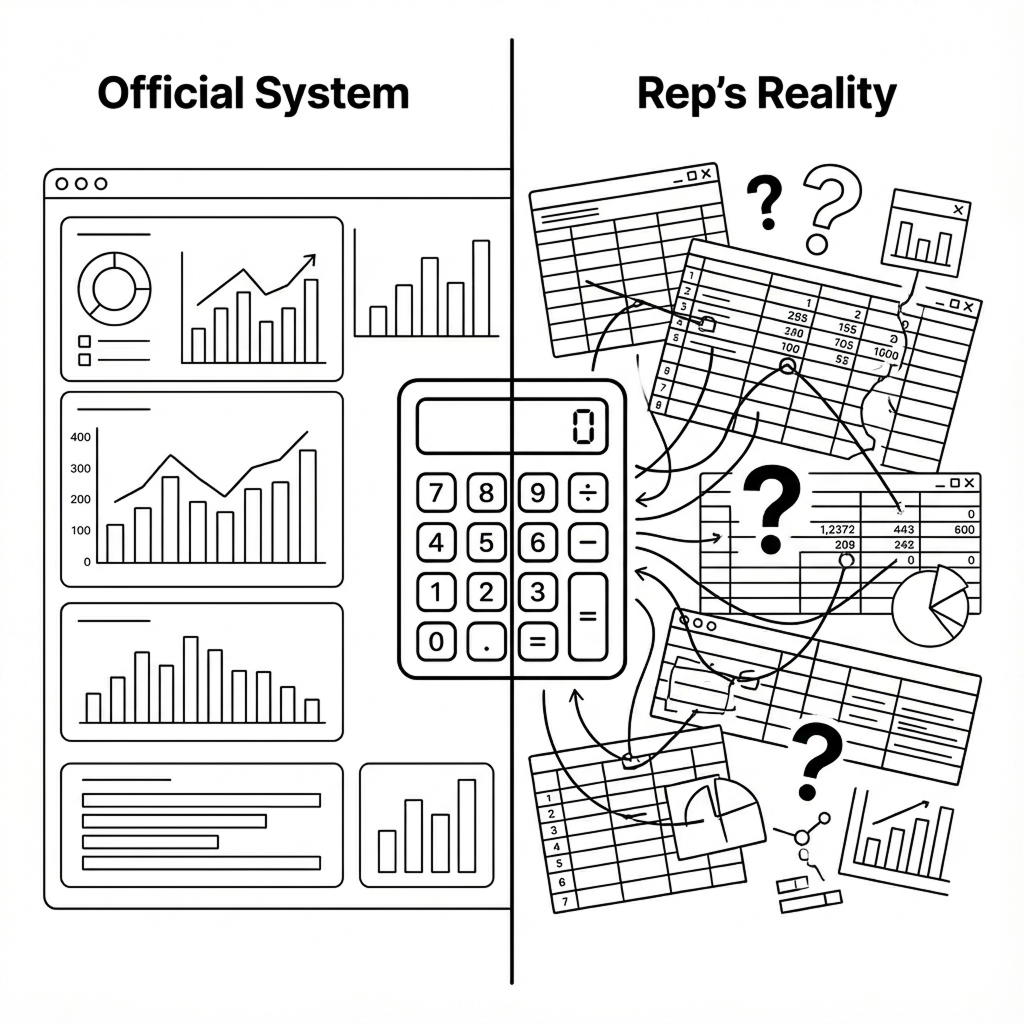
Your IC system has a trust problem if your best reps are keeping their own spreadsheets.
They're not doing it to be difficult. They're doing it because your official system can't explain where their money went. When Pfizer audited their global IC operations, they found they were overpaying roughly $100,000 per country annually—spreadsheet errors, formula complexity, data handling mistakes. Across 30+ countries, that's millions. But the overpayments weren't the real problem. It was the underpayments and the inexplicable variances. Those are what destroy trust.
A rep who can't trace their payout to specific accounts and rules assumes they're getting shorted. So they build their own tracking system to prove it. Then they file disputes. Ops spends days investigating. Territory inequity becomes the go-to explanation for every missed quota. And your top performers? They start interviewing elsewhere, because when you feel like the game is rigged by geography rather than effort, why bother any more?
This isn't really a tool problem, though it looks like one. And you're not going to fix it by ripping out your calculation engine. The companies actually making progress on this treat IC analytics as its own layer—something that sits on top of existing systems and does the work those platforms were never designed to do: explaining variance, simulating fairness, catching gaming patterns, making every payout defensible down to the account level.
What Is Pharma Incentive Compensation Analytics?
Quick level-set on pharma IC for anyone who needs it: it's the variable pay that rewards reps for hitting quotas and objectives. Base salary is usually 60-80% of total comp, variable is the rest. Traditional IC systems—your Varicents, your Xactlys, your sprawling Excel processes—calculate these payouts accurately. That's what they're built for.
What they can't do is explain why someone's check dropped 30% quarter-over-quarter. Or tell you whether territories are actually balanced fairly. Or show you what happens to payout distributions if you tweak an accelerator threshold. That's where IC analytics comes in.
It connects to your calculation engine outputs plus all the upstream stuff—IQVIA and Symphony claims, Veeva CRM, territory files, quota spreadsheets—and makes it all queryable. Rep asks "why did my attainment drop?" The system investigates across performance drivers, data quality issues, territory changes, plan mechanics. Delivers a quantified explanation in minutes. The same investigation would take an analyst one to three hours, and they'd probably miss something.
Where It All Falls Apart
Talk to enough people in pharma commercial ops and you hear the same complaints. IC feels like a system designed to confuse rather than motivate. Let me walk through the specific failure modes.
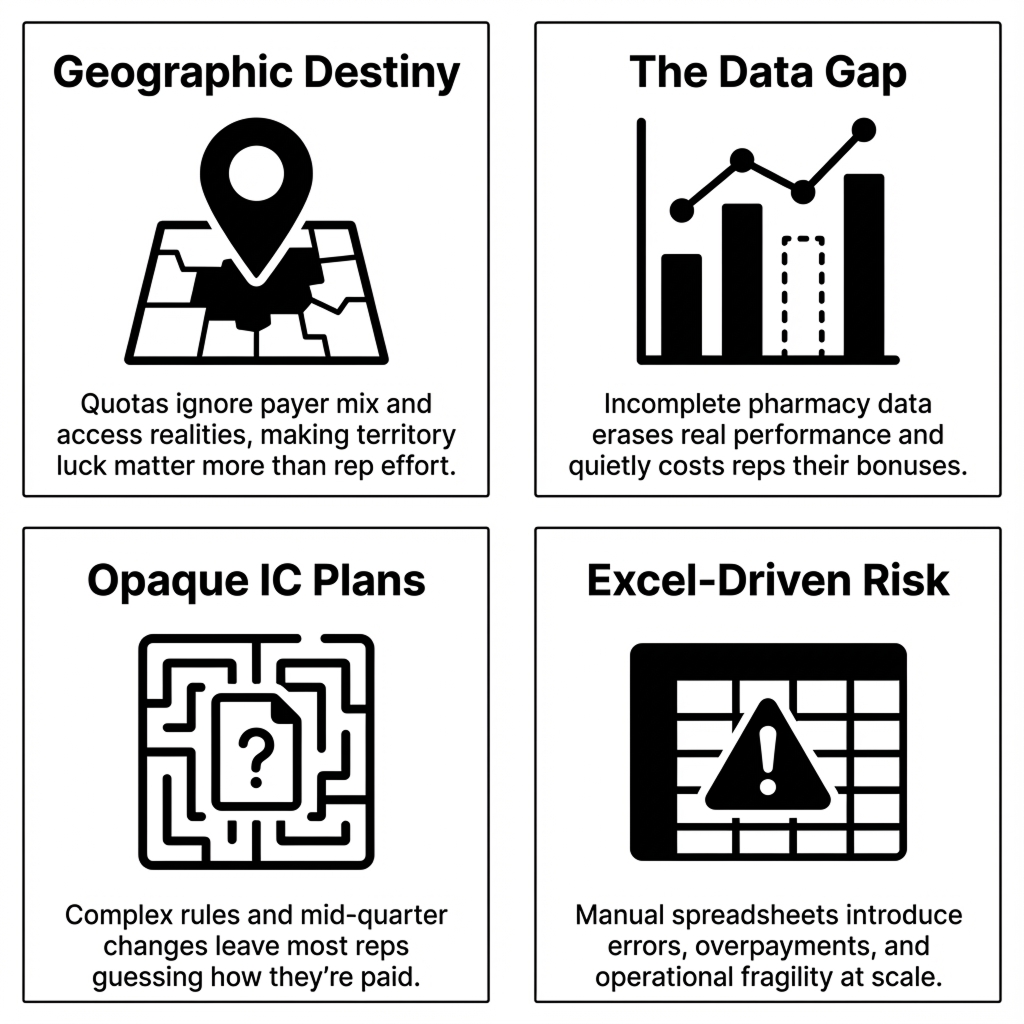
Geographic destiny
This is the one that really gets people heated. Reps in high-access, commercially-insured territories cruise to 150% attainment. Their peers in Medicaid-heavy or formulary-restricted markets—working just as hard, sometimes harder—struggle to hit 60%. Territory potential varies wildly based on payer mix, formulary status, HCP density, competitive intensity. But quotas often get set using "last year plus X%" logic that pretends all geographies are equivalent.
Research shows employees who believe their targets are achievable are 3.5 times more likely to be engaged. When reps feel like geography determines success more than effort does, engagement tanks. Your best people start looking around.
The data gap problem
Specialty pharmacies and certain channels don't always report fully to IQVIA or Symphony. When they don't, prescriptions just... vanish from the data. Entire teams miss quota, rankings suffer—not because performance dropped, but because the feed had gaps. Industry tolerance for this is weirdly high. "Data feeds are off by 5-10%" is apparently an acceptable thing to say out loud. For reps on tight margins, that variance is the difference between making bonus and not.
Plans nobody understands
Companies announce IC plans mid-quarter. They change rules after performance periods start. Even when plans arrive on time, the complexity provides cover. You've seen the magic words in quota letters: "Management reserves the right to make changes to this plan at any time for any reason as necessary for business purposes." Translation: we can move the goalposts whenever we want.
Gartner found only 24% of sellers truly understand how their incentives are calculated when spreadsheets are involved. That opacity drives turnover directly—35% in sales versus 13% overall, with unrealistic targets cited as the top reason reps leave.
The Excel problem
Here's a fun stat: 88% of spreadsheets contain serious errors. And 63% of businesses still run commission processes via Excel. When ops analysts leave, the complex nested formulas they built become archaeological artifacts nobody fully trusts. Sanofi's sales ops team saved 210+ days annually when they moved off spreadsheets. Companies that automate see 45% fewer incentive overpayments. The math is pretty clear.
What Separates High-Performing IC Teams from the Rest
The gap between high-performing and low-performing IC teams isn't budget or headcount. It's whether they can answer "why" questions at scale. Here's the difference:
Pfizer's journey here is instructive. Their first attempt failed because they tried to replicate complex manual processes in new tools which basically automated the mess. What worked was stepping back: building simulation and recommendation workflows that could analyze plans at scale, test fairness across countries, identify simplification opportunities, and produce evidence-based proposals for leadership. The tool change mattered less than the thinking change.
The Technology That Actually Matters
Three architectural pieces separate IC systems that explain from IC systems that just calculate. I'll keep this practical.
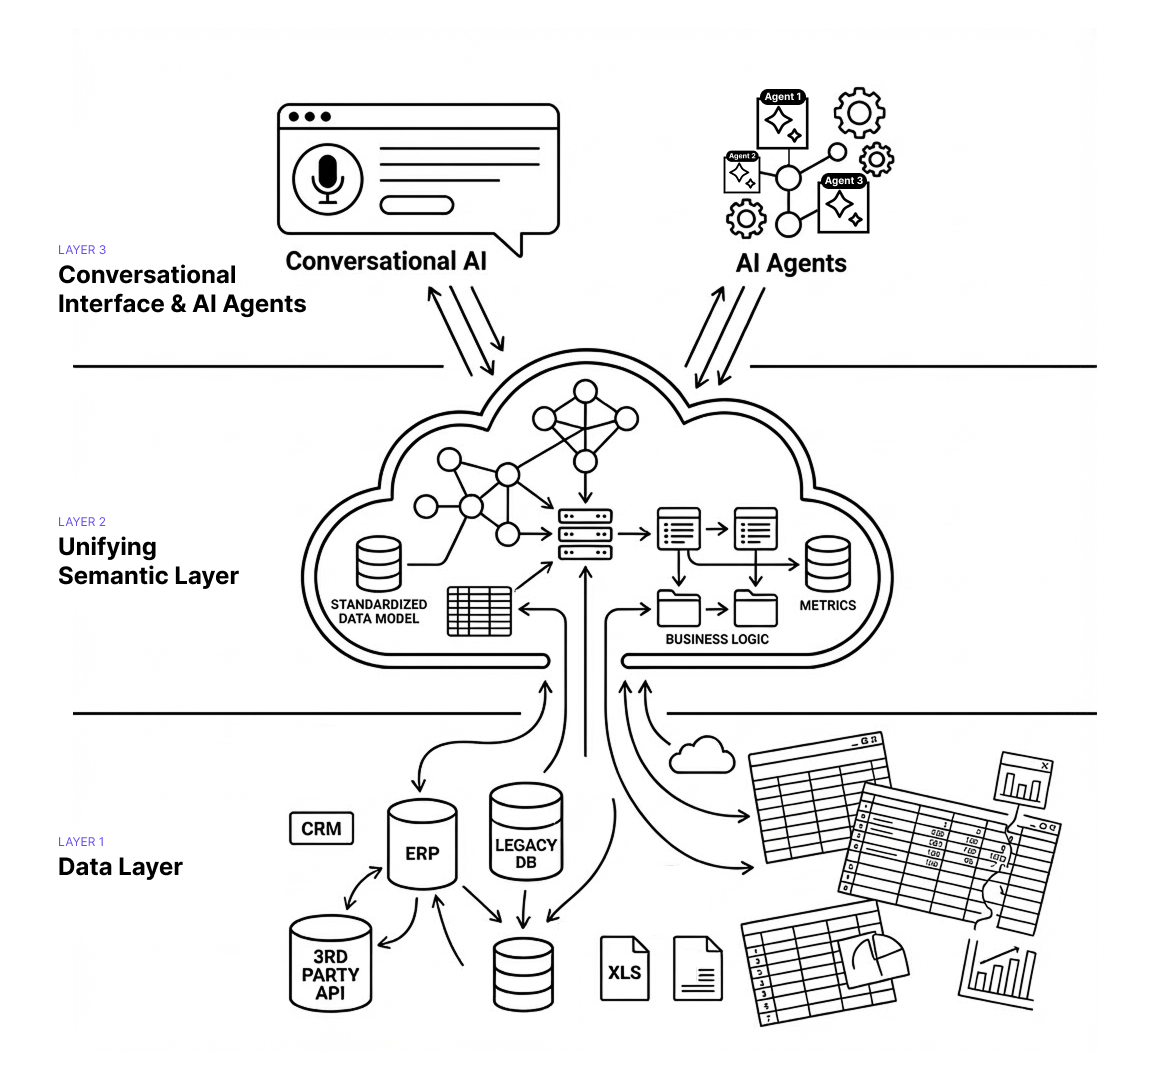
Semantic layers
Pharma IC data lives everywhere—IQVIA claims, Symphony feeds, Veeva CRM, territory files, HRIS rosters, quota spreadsheets, adjustment tables. Most companies export it all to Excel or a warehouse and write fragile queries to join it. Problem is, "new patient" means something different in claims than it does in CRM. When definitions don't match, calculations break and disputes spike.
A semantic layer creates a governed knowledge model on top of all those sources. It maps how entities relate, standardizes definitions ("new prescription" = first fill for patient within product), encodes IC business rules (how team credits split, when caps apply, how payer mix affects quotas). For pharma specifically, it needs to handle TRx versus NBRx distinctions, IQVIA versus Symphony differences, formulary hierarchies, payer segmentation. Generic BI tools don't know any of this.
Conversational access
Traditional IC systems deliver batch reports at month-end. Rep wants to check progress? Submit a ticket. Wait. This is exactly why shadow spreadsheets exist—the official system won't answer "How many more scripts do I need to reach the next tier?"
Conversational IC analytics lets reps ask in natural language. System interprets intent, queries the semantic model, returns an answer grounded in official plan rules. "You need 47 more TRx to reach 110%—at your current pace, you'll hit it by week 3." That beats staring at a dashboard showing 87% attainment and trying to do the math yourself.
Agentic investigation
When 50 reps simultaneously ask "why did my payout drop?", conversational interfaces help—but only if investigation is fast. This is where agentic workflows come in. Instead of one analyst working through a checklist, you deploy specialized agents working in parallel: one analyzing script trends and account changes, another checking territory crediting and data issues, another reviewing boundary changes and quota adjustments, another examining thresholds and caps, another looking at payer and formulary events.
They all query the semantic layer simultaneously, then synthesize: "68% of your variance came from the Q2 realignment removing your top three accounts. 22% from a Symphony restatement. 10% is normal volatility." What took an analyst hours now takes seconds, with better coverage.
Agentic Analytics in Practice
Here's what agentic IC analytics actually does in pharmaceutical commercial operations.
Variance investigation at scale
Rep's IC drops 30% quarter-over-quarter. Normally that's hours of analyst time: pull performance data, check attribution, review territory changes, verify plan rules, look for restatements. With 500+ reps, you're always behind.
Agentic analytics flips this. When variance exceeds thresholds, agents investigate performance drivers, attribution accuracy, data quality, territory events, and plan mechanics—simultaneously. Minutes later: "Your attainment dropped from 112% to 87%. Three high-volume accounts shifted to restricted formulary (63% of variance). Symphony restatement removed 48 scripts (21%). Territory lost two zip codes in Q2 realignment (16%)." Manager shares it with the rep. Ops handles exceptions only.
Fairness monitoring that doesn't wait for year-end
Most companies review territory fairness once or twice annually. By then, trust is damaged and your attrition risk has spiked.
Continuous monitoring catches it earlier. Agents watch for quotas misaligned with territory potential, cohorts systematically under-attaining, effort-outcome disconnects. When patterns emerge: "Northeast oncology shows 18% lower attainment than Southeast despite 12% higher call activity. Formulary restrictions affect 47% of target accounts in MA/CT/NY versus 8% in GA/FL/NC. Recommend 15-20% quota relief." You're intervening in months, not doing post-mortems.
Scenario planning without shadow spreadsheets
Reps want to know what it takes to hit their next tier. Without access to plan logic, they either file tickets or build their own models.
Conversational access solves this. Rep asks: "If I add 30 TRx across my top 5 accounts, where do I land?" System responds: "That moves you from 98% to 107%, increasing payout from $8,200 to $12,400. You'd need 6 additional scripts per account." No ticket, no waiting, no shadow spreadsheet—and the answer is grounded in official rules.
Data validation before it becomes a payout problem
Missing pharmacy feeds, territory mapping errors, late roster updates—these usually surface after statements go out. Then you're doing restatements, which tank trust faster than almost anything.
Validation agents run continuous checks during the period: comparing CRM activity to script attribution, monitoring pharmacy coverage rates, flagging mapping inconsistencies. When something's off: "Genoa Pharmacy reporting dropped to 12% of historical volume in Week 8, affecting 47 territories. Estimated impact: 340 missing TRx. Contact IQVIA before close." You fix it in-period.
Plan simulation before you're committed
Companies debate IC plan changes for weeks, then discover fairness problems after Q1 closes. By then you're stuck.
Simulation agents test proposals against 2-3 years of history. You see side-by-side comparisons: "Plan A: 68% of reps between 80-120% attainment, $4.2M total cost. Plan B: 43% below 80%, saves $600K. Plan C: better distribution but creates a cliff at 115%—expect disputes." You choose with evidence, not hope.
.png)
What You Can Show in 90 Days
Full enterprise deployment takes 9-13 months. But you don't need to wait that long to prove the concept. Three quick wins that work well as pilots:
Automated variance explanations for your top 50 dispute-prone territories. Connect IC outputs and upstream data for the territories that generate the most analyst work. Generate automated explanations. Measure time savings against manual investigation. This is usually where the ROI is most obvious.
Conversational attainment checks for one region. Deploy natural language interface for a single region's reps. Track adoption, ticket deflection, and satisfaction compared to control regions. You'll see pretty quickly whether people actually use it.
Pre-close data validation for one brand. Run continuous data quality checks during the performance period. Compare issues caught in-period versus historical post-close discovery rates. The numbers usually make a compelling case.
.png)
Why Not Just Use Tableau?
Fair question. Generic BI tools can visualize IC data. What they can't do is explain it. When a rep asks why their payout dropped, Tableau shows a chart. It doesn't investigate across five data sources, identify that a Symphony restatement removed 48 scripts, and generate an explanation a manager can actually share.
Breaking this down further, there are three key differences.. First, BI tools don't have pharma domain knowledge baked in—they don't understand TRx versus NBRx, how payer mix affects territory potential, when formulary changes require quota relief. Second, they're not built for natural language interaction grounded in governed business logic. Third, they can't deploy agentic workflows that investigate in parallel and synthesize findings.
Varicent and Xactly are adding AI features, but their core architecture optimizes for calculation accuracy and audit trails—not for explanation or conversational access. They're building features on top of calculation engines. IC analytics is a different architectural layer, purpose-built for the "why" questions.
Implementation Realities
Getting this into production requires discipline around three things.
Start with the semantic layer
The temptation is to launch with conversational interfaces or automated investigations because they're visible and impressive. That's backwards. If the semantic layer doesn't accurately encode your IC business logic, agents will generate plausible-sounding but wrong explanations. Then you've made your trust problem worse.
Successful implementations start by mapping IC knowledge into the semantic model: how your organization defines TRx versus NBRx, crediting rules for partner territories, quota relief calculation logic, cap and threshold application rules. Budget 4-8 weeks for this depending on complexity. Rush it and you'll spend months fixing incorrect outputs.
Change management matters more than technology
The best IC analytics fails if ops teams don't trust it and reps won't use it. Three things that actually matter: be transparent upfront about what's changing and what's not, run the new system in parallel for at least one full IC cycle to validate accuracy, and make training role-specific (10-minute demos for reps, deeper sessions for ops teams governing the semantic layer). Skip any of these and adoption will suffer.
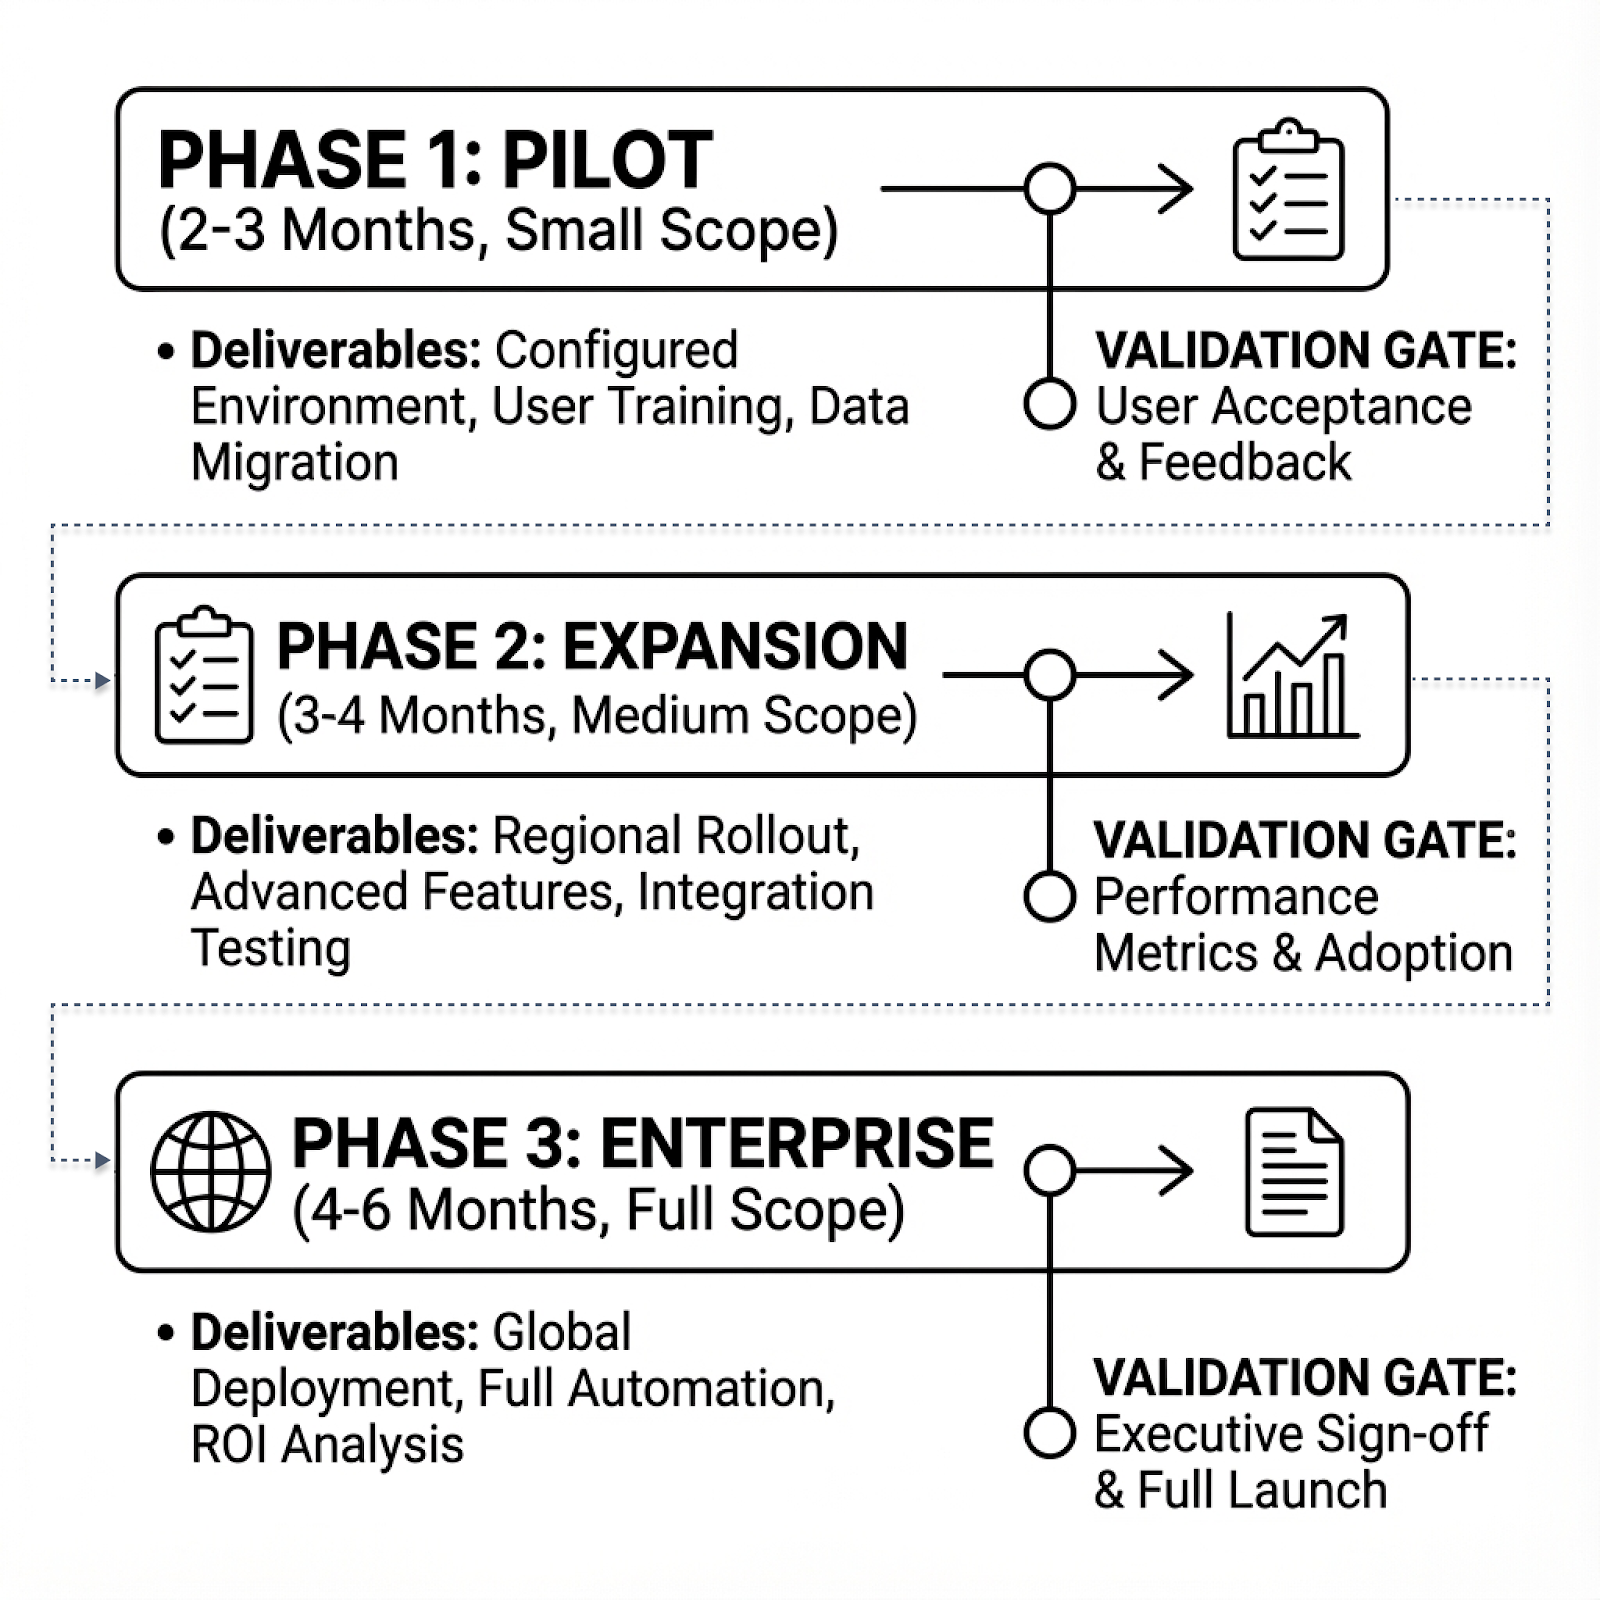
Phase it
Trying to implement across all territories, products, and roles at once is how projects die. What works: Phase 1 (2-3 months) with a single brand and 50-100 territories, core capabilities only, focused on validating semantic layer accuracy. Phase 2 (3-4 months) expanding to additional brands and regions, adding simulation and pre-close validation. Phase 3 (4-6 months) for full deployment and advanced capabilities like gaming detection.
Total timeline: 9-13 months. Companies that try to compress this either cut corners on semantic layer design or skip change management. Both create problems that take longer to fix than the time "saved."
Metrics that show ROI
Track operational improvement, not vanity stats. What to measure: dispute resolution time (target 70%+ reduction), self-service adoption (target 60%+ of routine questions handled conversationally), data issue detection timing (target 80%+ caught in-period versus post-close), plan simulation speed (from weeks to hours), and ops team allocation shift toward strategic work (target 50%+). For a 500-rep sales force, the time savings alone typically justify investment within 12-18 months.
The Bottom Line
Pharma IC will never be simple. Too many products, too many data sources, too many edge cases. But it doesn't have to be opaque, unfair, or consume weeks of analyst time every cycle.
The companies making progress aren't replacing their calculation engines. They're adding an intelligence layer that explains variance at scale, simulates fairness before launch, catches data issues in-period, and gives reps transparent access to their numbers.
The alternative is the status quo: spreadsheet-heavy, explanation-light, discovered-too-late fairness problems, and a field force that assumes geography matters more than effort. Your dispute queue already tells you whether that's working.
Get release updates delivered straight to your inbox.
No spam—we hate it as much as you do!


The variable pay structure that rewards reps for hitting quotas and objectives. Usually includes commission tied to prescription volume or market share, MBOs for qualitative goals like formulary wins, and SPIFs for short-term initiatives. Variable pay is typically 20-40% of total comp.
Because official systems can't explain how their payout was calculated. When data gaps, territory changes, or plan complexity make official numbers feel opaque, reps create parallel tracking to verify they're being paid correctly. Only 24% of sellers actually understand how their incentives are calculated when spreadsheets are involved.
Compare quota attainment patterns against territory potential, accounting for factors reps can't control: payer mix, formulary status, HCP density, competitive intensity. Analytics can identify systematic under-attainment in specific cohorts, effort-outcome disconnects, and quota assignments misaligned with actual opportunity. The key is doing this continuously, not just at year-end.
Those are calculation engines—they compute payouts accurately and maintain audit trails. IC analytics sits on top and makes those calculations explainable. When a rep's payout drops 30%, the calculation engine shows the number changed. IC analytics investigates why, then generates an explanation you can share. You keep your calculation engine. Analytics adds the layer that makes IC transparent.
Yes. IC analytics connects to your outputs wherever they live—Excel files, databases, shared drives—plus the upstream sources feeding those calculations. The semantic layer unifies everything. Your Excel process keeps running. Analytics makes it explainable.
9-13 months from kickoff to enterprise deployment. Pilot (2-3 months), expansion (3-4 months), full rollout (4-6 months). The critical upfront piece is 4-8 weeks for semantic layer design. But you can show quick wins within the first 90 days.
Measurable improvements within the first full IC cycle: 60-80% reduction in dispute resolution time, 50-70% of routine questions handled via self-service, 70-90% of data issues caught in-period, plan simulation compressed from weeks to hours. For a 500-rep sales force, time savings alone typically justify the investment within 12-18 months.
.webp)
Best AI Platforms for Pharma Commercial Analytics in 2026: 11 Platforms Compared
This guide compares the 11 best AI platforms for pharma commercial analytics in 2026, evaluating how each supports brand performance, market access, patient analytics, field force effectiveness, incentive compensation, and omnichannel engagement. It highlights a key shift in the market: traditional BI and SFE tools focus on reporting what happened, while newer AI platforms differentiate by investigating why performance changed. The post breaks down core capabilities like root cause analysis, data integration, governance, and agentic workflows—helping pharma teams identify which platforms can deliver faster, more actionable insights across commercial operations.