Introducing Kaiya Apps: Enterprise AI Apps That Get the Numbers + Nuance Right
.webp)

Built on your semantic layer. Governed from the ground up. Ready in minutes, not quarters.
Vibe coding gets a bad rap, but the premise — that you can describe what you want and watch it appear, an interface, a workflow, a feature — is a genuinely magical shift in who gets to build things and how that’s done.
However, the correction is also real. Code generated without oversight accumulates debt. Apps built in an afternoon sometimes fall apart in a week. The community has largely settled on “agentic engineering” as the responsible version — higher oversight, humans as auditors, spec-driven development for anything that needs to survive past the demo.
For most software, that framing is enough. Write better specs. Add more checkpoints. Ship more carefully.
For enterprise data applications — the kind that run territory reviews at pharmaceutical companies, track brand performance at CPG firms, surface revenue variances for FP&A teams — the failure mode isn’t bad code. It’s bad data.
The App Looked Right. The Numbers Didn’t.
A vibe-coded data app can look completely correct and be completely wrong — not because the code is buggy (maybe it is), but because the context was never there to begin with.
It doesn’t know that your company uses “net revenue” in commercial ops but “gross revenue” in the P&L, and that presenting either one to the wrong audience creates a political incident. It doesn’t know that “qualified account” has a specific definition your sales ops team spent six months negotiating, and that the CRM field doesn’t enforce it consistently. It doesn’t know your fiscal year starts in October, that territory boundaries changed in Q3, or that IQVIA TRx data has a two-week lag that everyone in pharma accounts for but nobody writes down.
None of this is in the database schema. It lives in institutional memory — in the heads of the people who’ve been running these reports for years, in Confluence pages that are six months out of date, in the unwritten rules that your best analyst just knows.
When a VP asks “where did this number come from?” — and they will — the app has no answer. The context was never there.
Two Other Approaches That Don’t Solve This

The BI industry has been running at this problem for years with approaches that each resolve one piece of it and ignore the rest.
Generative BI tools — the ones that let you chat with your data — solved the “any user can ask a question” problem but quietly made governance worse. Teams that used to maintain twenty dashboards are now generating sixty in a week. Each one answers a slightly different version of the same question. Each one uses slightly different filters. Nobody knows which one is canonical, which one finance actually trusts, or which one is going to the CEO. Dashboard sprawl used to be a people problem. Now it’s a people-plus-AI problem, and it scales faster than either.
Streamlit apps and similar code-wrapped analytical tools hit a different wall. They’re windows into data, not analysts on top of it. They show you what the numbers are, but they can’t tell you why a trend reversed last week, which territory is pulling the district average down, or what’s different about the reps who are hitting quota versus the ones who aren’t. There’s no reasoning layer. When the underlying data changes, the app doesn’t adapt — it just shows the new number.
Finally, traditional data apps — built by engineering teams over a quarter or two — solve the governance problem. They’re governed, they’re stable, and everyone trusts them. They’re also six months late to the question that prompted them. By the time the app ships, the team has moved on to the next problem or built something in Excel to fill the gap.
The Right Order of Operations
The apps that get used — the ones that survive the VP’s question, that get pulled up in meetings instead of apologized for — are built in a specific order.
Governance first. The semantic layer, the metric definitions, the business logic, the lineage. The agreed-upon answer to “what does revenue mean here?” The fiscal calendar. The territory hierarchy. The rules about which data source is authoritative for which question. Governance here doesn’t mean committees and approval cycles. It means the business logic lives in one place, applied consistently — so every app built on top of it uses the same definitions automatically, with no separate review required.
.png)
Production-grade AI apps require three foundational layers that generic LLM tools consistently lack:
- A semantic context layer that encodes your actual business definitions — what "revenue" or "active customer" means in your specific systems — so the agent reasons against your logic, not its assumptions.
- Agentic multi-step reasoning that goes beyond answering what happened to explaining why, running decomposed investigations across segments, products, and channels in a single workflow.
- Pre-encoded domain logic for your specific workflows — pharma TRx analysis, GL variance walkthroughs, renewal motion metrics — built once and reused, rather than reconstructed from scratch for every team.
And the foundation doesn’t require new infrastructure. Kaiya Apps connects directly to Snowflake, Databricks, BigQuery, and Redshift — no data migration, no parallel data store. The semantic layer sits on top of your existing warehouse, which means the apps generate from the same data your engineers are already managing. Nothing moves. Nothing gets duplicated. The governance layer adds context on top of what’s already there.
This is the sequence Kaiya Apps follows. Describe what you need. Kaiya grounds it in your semantic layer, applies your governance, and generates a live application. Every metric uses the definition your business established. Every number is traceable to its source. Every insight includes the reasoning behind it, not just the result.
One thing worth saying directly: if you’re reading this and thinking “that sounds like six months of data engineering work before I can build anything” — it probably isn’t. The semantic layer isn’t something Kaiya Apps asks you to create. Most data teams have already built it, whether they call it that or not: the KPI definitions your analytics team maintains, the agreed-upon metric logic your finance and commercial ops teams finally aligned on, the governed data model your analysts reference every time someone asks “which number should I use?” You’re not adding governance to your workflow. You’re building on top of governance that already exists — which is what makes the app trustworthy from the moment it ships.
The App Nobody Could Have Pre-Built For You
No vendor is going to ship the app that actually works for your specific business.
Salesforce has reports. Veeva has dashboards. SAP has embedded analytics. Each one is built for the modal company in that vendor’s customer base — which means it’s built for the average of their customers, which means it’s built for nobody in particular. Your territory hierarchy doesn’t map to their default. Your fiscal calendar is different. Your definition of “qualified HCP” or “at-risk deal” or “promo lift” doesn’t match their schema.
So you get close-enough. Or your IT team builds custom workarounds that need to be maintained every time the vendor releases an update. Or your analysts rebuild the same thing in Excel every month because the official app doesn’t actually answer the question.
The long tail of “apps that would actually work for us, in our specific configuration, for our specific business questions” is infinite. No software company can build all of them. The only way to cover the long tail is to give teams the ability to generate purpose-built apps themselves — on demand, grounded in their own data definitions, not locked into a single vendor’s data model.
That’s the unlock. Not another pre-built app catalog. Not another BI tool. AI-generated applications built on your semantic layer, with your logic, for your people — without requiring an engineering sprint every time the question changes.
Meta-Capabilities: What Kaiya Apps Makes Possible
Before getting into specific verticals, it’s worth understanding a few things Kaiya Apps does architecturally that traditional approaches can’t — regardless of industry.

The same app renders differently for every person who opens it. When a Kaiya App is published to an organization, each user opens it scoped to their role and access. A Regional Business Director opens the territory review app and sees their three territories, their HCPs, their performance versus target. The National Sales Director opens the same app and sees the full national view. No one built two versions of the app. Kaiya generated one, the semantic layer governs who sees what, and row-level security handles the rest. This is how consumer-grade personalization finally enters enterprise analytics.
Modifications don’t require going back to a developer. Every change to a Kaiya App is made the same way the app was created: in natural language. Tell Kaiya to remove a KPI card, swap a bar chart for a trend line, add a dimension filter, or restructure the tab layout. The app adapts and saves a new version. Previous versions are accessible from within the app. This isn’t drag-and-drop with extra steps — it’s a fundamentally different relationship between business users and the applications they depend on.
When the business changes, the apps change with it. Territory hierarchies shift. Metric definitions get updated. New data sources come online. In a traditional analytics setup, each of those changes triggers a round of dashboard updates, ticket queues, and manual work. In Kaiya Apps, changes made to the underlying Business View propagate automatically on the next refresh. The app doesn’t need to be rebuilt because it was never hardcoded to a specific version of the data. It’s generated from the foundation — and when the foundation updates, the apps follow.
The analytical depth isn’t cosmetic. A Kaiya App isn’t a chart grid with a title. When Kaiya builds a variance tab, it runs an actual variance decomposition analysis. When it builds a root cause section, it executes a genuine root cause analysis using Tellius’s Deep Insights engine. The charts are visualizations of real analytical findings, not layouts with placeholder data. No BI dashboard does root cause analysis natively. Kaiya Apps do it by default.
What This Actually Looks Like

In pharma commercial: A brand analytics team describes a territory review app — rep-level TRx performance against target, HCP call coverage, competitive share trends, and a root cause summary for each territory. Kaiya generates it grounded in IQVIA data, the team’s existing territory hierarchy, and call plan targets already defined in the semantic layer. Regional directors get a consistent, governed scorecard they can pull up in the field. Work that used to take two days of analyst prep before every quarterly review now runs automatically.
The same team builds a formulary alert app: when a payer changes coverage status on a key brand, the app surfaces the territory-level impact, flags at-risk HCPs by decile, and recommends coverage conversation priorities. The field team acts on it the same week — not three weeks later when the analysis makes it through the queue.
In CPG: A revenue growth management team builds a trade promotion performance app that pulls post-event lift analysis across retailers, compares promoted SKUs against baseline, and surfaces which promotions generated incremental volume versus which ones just shifted timing. The app knows the difference between volume lift and pantry loading because the semantic layer defines it. The team stops waiting three weeks for a post-event summary and starts seeing results within 48 hours of an event closing.
In FP&A: A finance team builds a variance explanation app for close week. Every CFO question — “why is EBITDA 5% below forecast this month?” — gets an answer from the app: price, volume, and mix decomposition, the business units driving the shortfall, a prior-period comparison. The analyst stops spending Monday morning rebuilding the same Excel model and starts the week having already answered the questions they know are coming.
In revenue operations: A sales ops team builds a pipeline health app that scores deal risk in real time, identifies which open opportunities have gone quiet, and surfaces the patterns that differentiate won deals from lost ones across segments. The app uses CRM data already in the semantic layer, with deal stage definitions and scoring criteria the team has already defined — not a generic AI interpretation of what “qualified opportunity” might mean at some average company.
What Makes This Different
The apps above couldn’t have been built with a vibe-coding tool — those tools have no idea what “NBRx” means in the context of a cardiovascular brand launch, or what your company’s definition of “call coverage rate” is, or how your fiscal calendar maps to your planning cycle.
Generative BI tools produce dashboards, not governed applications with embedded analytical logic, audit trails, and root cause reasoning built in.
Traditional engineering projects couldn’t have delivered in the timeline the questions required.
Kaiya Apps fills the gap those approaches leave. It uses the semantic layer your team has already built as the foundation, and generates applications on top of it — same governance, same definitions, same lineage. The only new part is the application layer. Everything underneath it is already trusted.
To be clear about what this is and isn’t: dashboards aren’t going anywhere. Tableau, Power BI, Vizpads — they stay for exploration, for power users who want a flexible canvas, for analysts building for other analysts. The problem isn’t that dashboards exist. It’s the gap between what a dashboard can do and what the business actually needs when the VP opens something on Monday morning. Dashboards display data. Kaiya Apps investigate it and surface findings for a specific role. Both have a job to do.
A Note on What “Governed” Actually Means
There’s a version of this conversation where “governed” means “slow” — committees, approval cycles, six-week spec reviews.
Governance here means the business logic lives in one place, applied consistently. When someone builds a new app with Kaiya, it uses the same definition of revenue that every other app uses. The same territory hierarchy, the same HCP tier definitions, the same fiscal calendar. The semantic layer enforces consistency automatically. There’s no separate review process because there’s no ambiguity to resolve.
The pharma teams using Kaiya Apps aren’t waiting for data governance approvals to build new applications. They’re building on top of governance that’s already in place. The speed comes from that foundation — not despite it.
Next Steps
If you’ve been building workarounds — Excel models, Streamlit scripts, BI dashboards that answer most of the question — Kaiya Apps is worth an afternoon of your time.
The fastest way to see whether it fits is to start with a use case you already know: a territory review you rebuild every quarter, a promo performance summary your team still does in spreadsheets, a variance explanation your FP&A team writes manually every close. Describe it. See what Kaiya generates on top of your existing data. If the foundation is already there, you’ll have something running before the end of the day.
Get release updates delivered straight to your inbox.
No spam—we hate it as much as you do!

Kaiya Apps: Built on your semantic layer. Governed from the ground up. Ready in minutes, not quarters.

Kaiya Apps is an AI-powered application builder from Tellius that generates live enterprise data applications grounded in your semantic layer. Describe what you need, and Kaiya builds a governed, traceable app in minutes — with every metric defined by your business logic and every insight backed by an explanation.
Standard AI app builders generate code from a description but have no knowledge of your business’s data definitions, governance rules, or domain context. Kaiya Apps starts with your semantic layer — the governed metrics, hierarchies, and business logic your team has already built — and generates the application on top of that. Every number is traceable. Every answer includes the reasoning behind it.
A dashboard starts with a blank canvas — an analyst decides which metrics to show, which chart types to use, which filters to expose. That process takes days to weeks and produces a static layout that answers the questions the analyst anticipated. A Kaiya App starts with a business objective. Kaiya determines the layout, selects chart types, defines KPI cards, builds filter logic, creates drill-down paths, and embeds analytical methods — forecasting, variance decomposition, root cause analysis, anomaly detection — that no BI dashboard produces natively.
Vizpads are the analyst’s workbench — you select datasets, configure chart types, build filter bars. The right tool when an analyst is exploring data or building for a power user who wants a fully flexible canvas. Kaiya Apps serve a different person: the consumer who needs answers but will never touch a builder. The creation is Kaiya-driven. The consumption is pre-curated — open, filter, act. The analytical depth goes further than Vizpads natively: forecasting, root cause trees, anomaly detection, and what-if scenarios are built into the generation engine.
Kaiya Apps use a snapshot model. When the app is created or refreshed, it queries the underlying Business View and stores the result set — powering sub-second load times without a live warehouse query on every interaction. Admins and app owners can trigger a manual refresh at any time, and the app stays usable during refresh using the last-loaded state. For high-frequency use cases, on-demand refresh is available. The snapshot ensures performance; the refresh mechanism ensures currency.
Every modification uses the same method as creation: natural language. Tell Kaiya to remove a KPI card, swap a chart type, add a filter, or restructure the layout. The app adapts, saves a new version, and the previous version is accessible from version history. Changes to shared apps affect all users with access and remain in draft until explicitly published.
Apps inherit the governance of the underlying semantic layer — row-level security, role-based access control, full audit trails, and data lineage from source through metric through output. When the Business View is updated, the next refresh picks up those changes automatically. There’s no separate governance review required for new apps because the governance is enforced at the foundation.
Streamlit apps are code-first — a developer writes a Python script, selects the data source, defines the layout, builds the visualizations programmatically. Kaiya Apps are objective-first: a commercial ops lead types a description and Kaiya proposes a multi-tab layout with KPI cards, trend lines, and ranked tables. No code, no Python, no development cycle. The second difference is analytical depth: a Streamlit app displays what the developer coded it to display. A Kaiya App embeds forecasting, variance decomposition, root cause analysis, segmentation, anomaly detection, and what-if scenarios as native capabilities — methods the Deep Insights engine executes as part of generation.
In the initial release, app creation is available to all users with built-in guardrails. Apps are generated from existing Business Views — which means the data foundation was already validated by the data team. The app inherits all metric definitions, access controls, and business logic from the underlying Business View. Permissions follow the same explicit user/group model as Vizpads: the creator controls access, modifications are versioned and logged, and the data team retains governance at the foundation layer.
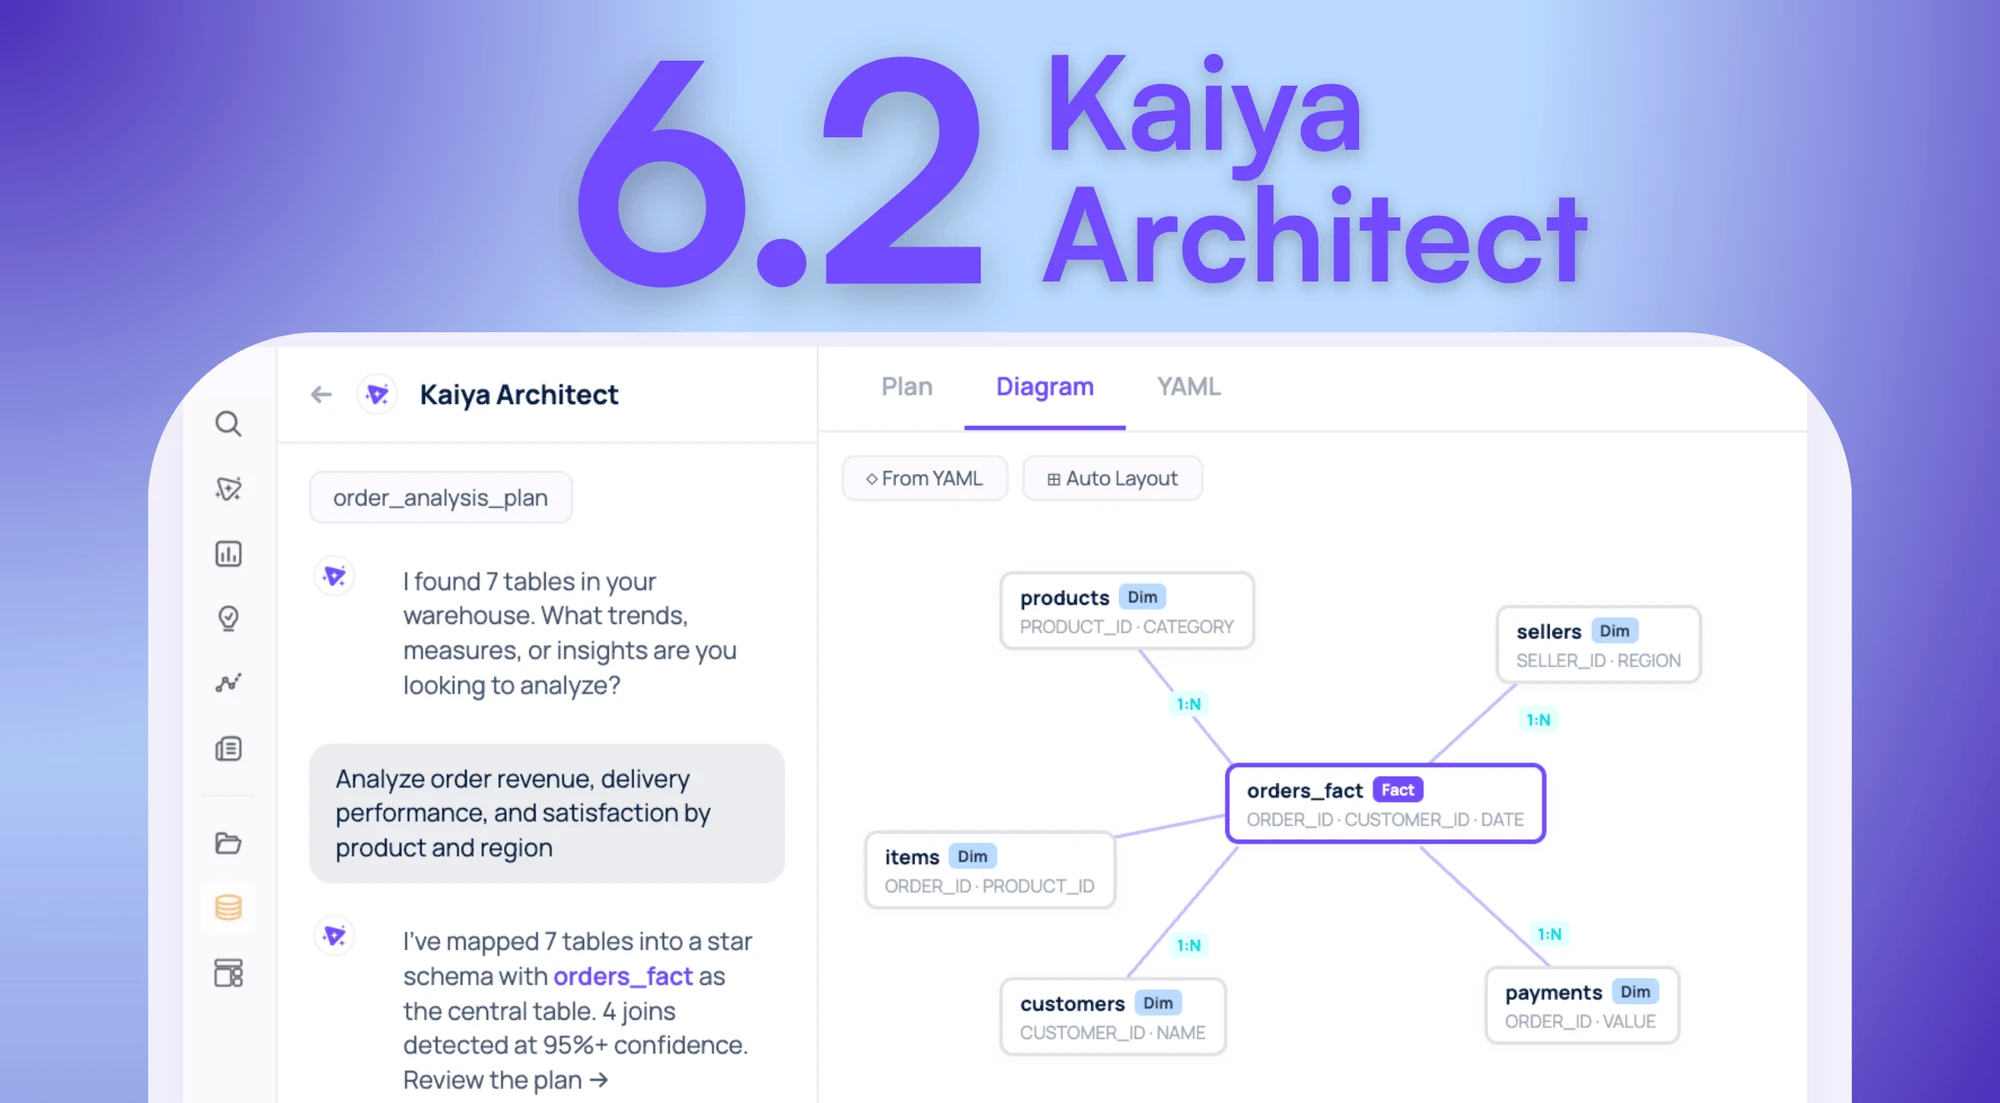
Your Data Is In The Warehouse. The Model That Makes It Useful Isn’t. Introducing Kaiya Architect.
Tellius introduces Kaiya Architect, an AI data modeling agent that builds governed semantic layers from raw warehouse data through a single conversation — eliminating the multi-week engineering bottleneck between business need and analysis.