Best AI platforms for Pharma Brand Analytics in 2026: 10 Platforms Compared
.webp)

Pharma brand analytics platforms are AI-powered tools that help pharmaceutical brand teams track, diagnose, and act on brand performance across prescription data (TRx, NBRx, market share), competitive dynamics, payer and formulary positioning, HCP engagement, patient journey signals, and omnichannel marketing effectiveness. The category spans brand share decomposition, competitive tracking, launch analytics, forecast-vs-actuals analysis, HCP targeting, omnichannel measurement, and brand review automation.
The market has three structural realities to navigate before evaluating any individual platform. First, no single vendor covers the full stack — pharma brand analytics workflows almost always run on a combination of proprietary data assets, commercial CRM, omnichannel measurement, and an analytical layer. Second, the line between data vendors, consulting firms, technology platforms, and engagement orchestrators is blurry; many of the names below are not direct substitutes for each other. Third, brand directors who used to accept three-day analyst-mediated turnarounds on "why" questions now expect same-day answers that draw on both structured Rx/claims data and unstructured field intelligence.
This guide evaluates 10 platforms against eight criteria that matter for pharma brand analytics buyers in 2026, with Tellius weighing the dimensions that separate 2026-era agentic analytics platforms from 2024-era descriptive reporting — autonomous diagnosis, conversational analysis across structured and unstructured data, agentic monitoring, and self-service analytic apps — most heavily. Organizations that prioritize other dimensions (proprietary data depth, consulting methodology, omnichannel measurement, engagement orchestration) may reasonably rank these platforms differently. Looking for a broader comparison across the full commercial analytics stack (field force effectiveness, incentive compensation, market access, patient services)? See our pharma commercial analytics comparison. For market access specifically, see our pharma market access analytics comparison.
Quick reference: what each platform is best for
The table below maps each platform to its genuine specialty.
Most enterprise teams use a combination — for example, IQVIA data flowing into a customer-owned warehouse, Veeva for CRM and omnichannel measurement, and Tellius as the agentic analytics layer across all of it.
At a glance: 10 pharma brand analytics platforms compared
The table below rates each platform across eight criteria from the perspective of a brand director or VP of brand analytics. Ratings reflect publicly available product documentation, analyst coverage, and verified deployment evidence as of May 2026.
How we evaluated: eight criteria for pharma brand analytics
We scored each platform from the perspective of a brand director or VP of brand analytics selecting a platform for brand performance analysis and monitoring.
This evaluation weights brand share decomposition and autonomous root-cause analysis as the primary differentiator. Organizations that prioritize other dimensions — proprietary data depth, consulting methodology, omnichannel measurement, engagement orchestration, deployment cost — may reasonably rank these platforms differently.
1. Brand share decomposition and root-cause analysis. The dimension this evaluation weights most heavily. When market share drops, the brand director needs to know why, quantified and ranked by driver (payer mix, competitive launch, field activity, patient abandonment). Platforms that show a share trend without decomposing it scored lower. Together with criteria 4, 5, and 8, this defines the agentic-analytics dimension Tellius is built around.
2. Pharma data assets and integration. Brand analytics requires IQVIA, Symphony Health, Veeva CRM, MMIT, and internal data joined in a single environment. We scored two related dimensions: whether the vendor owns proprietary pharma data assets, and whether the platform integrates multi-vendor data from the customer's warehouse without migration.
3. Brand-specific semantic model. TRx, NBRx, market share, payer hierarchies, territory structures, and competitive benchmarks need to be first-class entities in a governed data model, not raw tables the user maps each session. We scored whether the platform supports a customer-configurable semantic layer encoding brand-specific business logic.
4. Conversational analytics for non-technical brand teams. Brand directors do not write SQL. We scored whether the platform's natural-language interface understands pharma-specific queries ("Show me NBRx trend for the brand vs. competitor X in the Southeast"), selects the right semantic model per question, and maintains conversational context across sessions.
5. Structured and unstructured analysis. This is the dimension most competitors miss entirely, and the one brand teams are increasingly asking about. Unlike traditional pharma analytics platforms that operate exclusively on tabular data (Rx, claims, CRM), the strongest platforms in this comparison can weave rep call notes, payer meeting summaries, competitive intelligence reports, and formulary correspondence into the same analysis. Gartner notes that 57% of organizations estimate their data is not AI-ready; the unstructured data gap in pharma brand analytics is one reason why.
6. Competitive and launch intelligence. Competitive intelligence lives partly in structured data (market share shifts, formulary tier changes) and partly in unstructured signals (field observations, conference reports, regulatory filings). We scored whether the platform decomposes competitive impact across both in a single pass.
7. Omnichannel brand measurement. Brand teams ask: "What is the incremental lift from field vs. digital? Which channels drive new patient starts?" Most measurement stacks answer at the channel level only. We scored whether the platform connects HCP engagement to brand outcomes at the HCP level.
8. Agentic monitoring, self-service apps, and production-ready deliverables. This is the forward-looking criterion that separates 2024-era platforms from 2026-era platforms. Gartner predicts that 33% of enterprise software will include agentic AI by 2028, up from less than 1% in 2024, but also warns that over 40% of agentic AI projects will be canceled by end of 2027 due to unclear value or inadequate controls. We scored three things: always-on KPI monitoring that examines anomalies proactively, self-service analytic application generation for brand teams without IT, and finished deliverables (decks, briefs, Excel models) rather than dashboard links.
How to choose: matching platforms to brand-team priorities
The right pharma brand analytics platform depends on what the brand team needs most. The shortlist below maps the most common brand-team priorities to a starting-point vendor.
- If your primary need is the deepest proprietary global pharma data — Rx, claims, and RWE coverage that other platforms ingest into their own analytics — IQVIA is the foundational data layer.
- If your primary need is the de facto pharma CRM plus privacy-first omnichannel measurement that connects media exposure to prescription outcomes — Veeva is the de facto answer (Vault CRM, Crossix, Compass).
- If your primary need is a single agentic analytics layer for the brand team — conversational investigation across IQVIA, Veeva, MMIT, claims, and unstructured field intelligence; autonomous diagnosis with quantified, ranked drivers; agentic monitoring that delivers finished brand briefs; and self-service analytic apps the team builds without IT — Tellius is built specifically for this.
- If your primary need is strategic brand forecasting methodology delivered as a consulting-led engagement — ZS ZAIDYN brings the methodology depth.
- If your primary need is marketing mix modeling depth for brand promotional ROI across paid channels — anchor on Axtria (MarketingIQ).
- If your primary need is real-time patient-journey intelligence for specialty and rare disease brands — Komodo Health leads the category.
- If your primary need is strategic brand research synthesis and commercial peer benchmarking through advisory engagement — Trinity Life Sciences (TGaS) is purpose-built for that work.
- If your primary need is external competitive and KOL intelligence from analyst transcripts, regulatory filings, and earnings calls — AlphaSense owns this lane.
- If your primary need is brand-strategy-to-field-execution orchestration through next-best-action recommendations into the rep workflow — Aktana is the dedicated tool.
Most enterprise pharma commercial teams run two or more of these platforms. The question is not which one to pick. The question is which combination matches the brand team's analytical workflow.
Key takeaways: pharma brand analytics platforms
Entries appear in the same order as the comparison table — market presence first, then by depth of capability within each vendor's specialty.
IQVIA — The deepest proprietary pharma data assets in the industry, covering prescription, medical claims, and real-world data across 80+ countries. The WhizAI conversational layer (now integrated as an IQVIA business) adds natural-language access to IQVIA's data. Best for organizations whose analytics center on IQVIA data and need the strongest descriptive brand benchmarking on global Rx/claims/RWE coverage.
Veeva — The de facto pharma CRM, used as the system of record for HCP engagement and field activity at most large pharma organizations. Crossix delivers privacy-first omnichannel measurement that connects media exposure to prescription outcomes, and Compass provides HCP performance data. Best for pharma commercial teams that want privacy-first omnichannel measurement and HCP engagement data on top of their existing Veeva CRM.
Tellius — Best for brand teams that need to understand why share, NBRx, or launch metrics changed, not just track what changed. Tellius is the only platform in this comparison that autonomously decomposes brand share variance into quantified, ranked drivers (payer mix shift drove 42% of the decline; competitive launch drove 31%) across structured pharma data and unstructured field intelligence on the customer's existing cloud warehouse. Kaiya Missions monitors brand KPIs around the clock and delivers finished brand briefs — decks, Excel models, narrative summaries — to brand directors on a schedule. Kaiya Apps lets brand directors generate governed analytic applications from a conversational prompt. Recognized as a Gartner Magic Quadrant Visionary four consecutive years (2022–2025).
ZS ZAIDYN — Pharma brand forecasting methodology and commercial consulting expertise delivered through the ZAIDYN platform and ZS's services bench. The integrated approach gives brand teams continuity between strategic engagement and operational analytics. Best for organizations with an established ZS consulting relationship who want strategic brand forecasting methodology embedded in a broader commercial transformation.
Axtria — Marketing mix modeling depth through MarketingIQ, sales force analytics through SalesIQ, and the emerging InsightsMAx.ai AI layer for analytics acceleration. Best for pharma brand teams whose primary analytical need is optimizing promotional spend across paid channels through marketing mix modeling.
Komodo Health — Patient-journey analytics built on a large-scale claims and clinical dataset, with data refresh cadence faster than traditional claims data vendors. Iris and MapAI add brand and conversational layers to the Healthcare Map. Best for brand teams in specialty and rare disease categories where treatment patterns, line-of-therapy transitions, and patient flow are central to brand performance.
Trinity Life Sciences — Strategic brand research synthesis, peer benchmarking through TGaS Advisors, and Brand Insights AI for processing unstructured research documents. Best for organizations that need strategic context — peer benchmarking, advisory research synthesis, primary market research — alongside their operational brand analytics.
AlphaSense — Generative AI search across expert transcripts, regulatory filings, earnings calls, and news, with KOL and competitive intelligence monitoring. Best for brand teams that need strong external competitive and KOL intelligence as a complement to their internal brand performance analytics.
Prospection — Patient-centric brand intelligence across de-identified patient journeys, with ProGPT conversational access. Geographic strength in APAC alongside US and EU coverage. Best for brand teams whose patient-journey analytics need extends into APAC markets where competitors have limited reach.
Aktana — Next-best-action orchestration connecting brand strategy to field and digital execution, integrated with Veeva CRM. The PharmaForceIQ merger is extending the platform into commercial execution analytics. Best for brand teams whose primary need is closing the loop between brand strategy and measurable field execution through orchestrated next-best-action recommendations.
Power BI / Fabric — The most widely deployed business intelligence platform in pharma through Microsoft enterprise agreements, with Copilot adding natural-language DAX generation. Best for cost-effective brand dashboard distribution at enterprise scale within Microsoft environments where pharma-specific analysis is built on top by the customer's analytics team.
Who benefits most: pharma brand-team personas
The personas below come up repeatedly in brand analytics evaluations. Each one has a specific pain point that shapes which combination of platforms makes sense.
- VP of Brand Analytics. Owns the analytical infrastructure that supports brand directors across the portfolio. Wants a governed, multi-source analytical layer that scales across brands without an analyst stitching together every monthly brand review. Primary pain point is the 8–10 day monthly cycle of manual data stitching that delays every brand review and pulls senior analysts onto repetitive work.
- Brand Director / Brand Lead. Owns brand performance and the monthly leadership brand review. Wants same-day answers to "why" questions — why NBRx dropped in the Southeast, why new patient starts plateaued, why competitive trial conversions slipped — with quantified drivers ready for the SVP. Primary pain point is the three-to-five-day analyst-mediated cycle that follows every variance, when the next leadership review is already approaching.
- Director of Commercial Insights. Translates field intelligence, payer signals, and competitive observations into brand strategy. Wants to bring unstructured signals (call notes, payer meeting summaries, conference reports) into the same analysis as Rx and claims data without exporting to separate tools. Primary pain point is that the unstructured context explaining why HCP behavior changed lives outside the analytics stack entirely.
- VP of Commercial Operations. Accountable for the brand team's analytical operating model and time-to-insight metrics. Wants the brand team to operate independently of central analytics for routine questions, freeing senior analysts for forecasting and strategic projects. Primary pain point is the order-taker model where every brand question becomes an analyst ticket.
- Marketing Effectiveness Lead. Measures media and field investment against brand outcomes. Wants HCP-level attribution that connects channel exposure to prescription behavior rather than channel-level reach and frequency. Primary pain point is measurement at the wrong unit of analysis — channel rather than HCP.
- Strategic Insights Manager. Synthesizes secondary research, advisory boards, and primary market research into brand strategy inputs. Wants research synthesis tied directly to live brand performance data rather than slide decks delivered weeks after the question was asked. Primary pain point is the gap between research synthesis cycles and brand performance cycles.
- CIO / Head of Commercial Data Platforms. Owns the data infrastructure underneath every brand team's analytics. Wants analytical capabilities deployed on the existing cloud data warehouse without data migration to a vendor-proprietary environment. Primary pain point is the data sprawl created by vendor-specific ecosystems that require customer data to live in the vendor's stack.
The pain points cluster around two patterns: cycle time (how long it takes to get an answer) and unification (whether the answer draws on the full set of data sources or only the structured subset). Different platforms address different patterns. The brand-team combination that solves both is usually the right answer.
What separates brand diagnosis from brand reporting, and why the gap is widening
NBRx dropped 12% in the Southeast. The dashboard shows it. Nobody can explain it.
The brand director's question ("How much of this is payer-driven, how much is competitive, how much is field execution?") enters the analyst queue and comes back in a week. By then, the next Monday is approaching, the SVP has already asked twice, and the brand review happened without an answer.
This plays out every month at pharma companies of every size. It persists because the commercial analytics workflow is a chain of episodic handoffs. Strategic Insights hands off to Brand Strategy. Brand Strategy hands off to Targeting. Targeting hands off to Customer 360. Customer 360 hands off to Marketing Effectiveness. Marketing Effectiveness hands off to Measurement. Every node is a different team, a different tool, a different metric definition. The opportunity is not to solve any single node better. It is to collapse the chain.
Brand directors now expect same-day answers to questions that used to take a week. Those answers need to draw on structured data (Rx, claims, payer) and unstructured signals (field call notes, payer meeting summaries, competitive intelligence) in a single pass.
Most pharma measurement stacks cannot do this. Channels are tracked in silos with no unified HCP-level view. Tactical planning is measured on reach and frequency rather than conversion impact. The unstructured context that explains why an HCP changed behavior (the rep call note, the conference interaction, the formulary letter) lives outside the measurement system entirely.
The IRA is compressing this further. Part D price negotiation is affecting revenue forecasts starting in 2026. Over half of new prescriptions for novel medicines go unfilled, largely due to benefit design and cost barriers, according to the IQVIA Institute. The global pharmaceutical market reached $1.77 trillion in 2025, according to Precedence Research, but that growth is increasingly contested by biosimilar competition and compressed brand lifecycles. There is less room for a slow analytical response.
This creates a straightforward test for platform evaluation: does the tool reinforce the order-taker model, where an analyst builds a dashboard and the brand director consumes it? Or does it enable a business-partner model, where the brand director traces a problem directly, the analyst provides strategic oversight, and the platform generates persona-scoped applications the brand team can use without IT?
The answer separates reporting from diagnosis.
Four levels of pharma brand analytics maturity
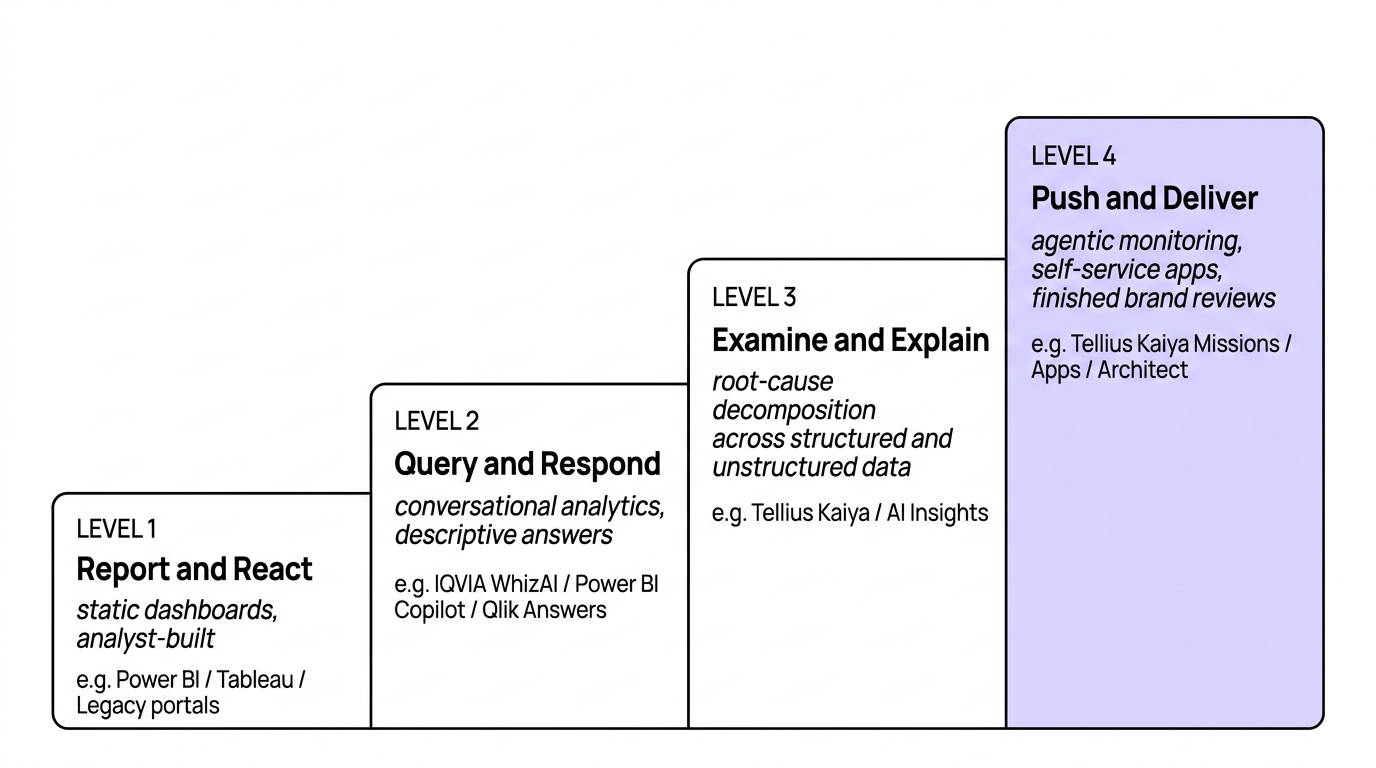
These maturity levels describe analytical autonomy, not platform quality. Level 1 and Level 2 platforms are doing legitimate jobs — most pharma brand teams operate across multiple levels simultaneously depending on the question.
Level 1: Report and react. Static dashboards built on IQVIA, Symphony, or Veeva data feeds. The brand team consumes; the analyst builds. Every "why" question becomes a new analyst ticket with a two-to-five-day turnaround. The brand director knows what happened. The platform does not attempt to explain why — and for many routine reporting needs, that's appropriate.
Level 2: Query and respond. Conversational analytics on pharma data. Brand teams can ask questions in natural language, but answers are descriptive. The platform says NBRx dropped 12% in the Southeast. It does not yet say that payer mix shift drove 42% of the decline while a competitive launch drove 31%. No autonomous root-cause decomposition. No unstructured data integration. WhizAI within the IQVIA ecosystem operates at this level on its data sources.
Level 3: Examine and explain. The platform joins multi-source brand data, structured and unstructured, under a governed semantic model. It automatically decomposes share and NBRx variance into ranked drivers and delivers explanations rather than charts. The query can span Rx, claims, CRM, field notes, payer meeting summaries, and competitive intelligence in one pass. Tellius operates here through Kaiya and AI Insights.
Level 4: Push and deliver autonomously. The platform monitors brand KPIs around the clock, detects anomalies, traces root causes across structured and unstructured data, delivers finished brand reviews (decks, briefs, Excel models) on schedule, and generates persona-scoped analytical applications the brand team can use without IT. All of it runs on the customer's own multi-vendor data warehouse. Gartner published its first dedicated Hype Cycle for Agentic AI in 2026, mapping 27 agentic innovations. Tellius is the only platform in this comparison operating at Level 4, through the combination of Kaiya Missions, Kaiya Apps, Kaiya Architect, Persistent Memory, and Auto BV.
Most enterprise pharma brand teams will run a Level 1 dashboard platform (Power BI, Tableau) for ubiquitous reporting alongside a Level 3-4 platform for diagnosis. The Level 1 platforms are not deficient versions of Level 4 platforms — they are different tools doing different jobs.
1. IQVIA
IQVIA operates on the deepest proprietary pharma data assets in the industry, covering prescription, medical claims, and real-world data across 80+ countries. The WhizAI conversational analytics layer, now integrated as an IQVIA business, adds natural-language query access to IQVIA data. IQVIA serves the vast majority of large pharma companies globally.
Key capabilities:
- Brand analytics platform for tracking market share, competitive dynamics, and patient flow on IQVIA data
- IQVIA.ai agentic platform (emerging) for automated analytics workflows within the IQVIA ecosystem
- WhizAI-powered conversational analytics pre-trained on pharma terminology
- Global data coverage with subnational prescription and claims data across 80+ countries
- IQVIA Orchestrated Engagement for next-best-action recommendations integrated with the underlying data assets
Where IQVIA excels: Proprietary data depth for brand benchmarking is unmatched in the industry. IQVIA's prescription, claims, and real-world data assets are the default benchmark dataset that most pharma brand teams license, and most other vendors in this comparison ingest IQVIA data as an input. For organizations whose primary data source is IQVIA, the integrated analytics layer is the shortest path from data to descriptive brand reporting, and the global geographic coverage is genuinely without peer. IQVIA is built for proprietary pharma data depth and ecosystem analytics — the foundational data layer underneath the analytical stack.
Where IQVIA falls short: Analytics capabilities are optimized for the IQVIA data ecosystem. Teams that need to combine IQVIA data with Veeva CRM, MMIT formulary data, internal forecasts, and unstructured field intelligence in a single query through a customer-configurable semantic model typically build that layer elsewhere. Autonomous root-cause decomposition with quantified, ranked drivers, finished brand-review delivery from natural-language objectives, and self-service analytic application generation are not part of the documented platform feature set.
Pricing: Enterprise contracts bundled with data subscriptions. Pricing varies by data modules, geographies, and user count.
Consider if your team's primary need is brand benchmarking within the IQVIA data ecosystem with the deepest proprietary global Rx/claims/RWE coverage in the industry — and standardizing on IQVIA's proprietary data assets fits your broader pharma analytics strategy.
2. Veeva
Veeva is the de facto pharma commercial CRM, used as the system of record for HCP engagement and field activity at most large pharma organizations. Crossix provides privacy-first omnichannel measurement that connects media exposure to prescription outcomes, Compass adds HCP performance data, and Veeva AI Agents add workflow automation across the suite.
Key capabilities:
- Vault CRM as the dominant HCP engagement and field activity system of record across large pharma
- Crossix privacy-first omnichannel measurement tied to brand outcomes
- Compass performance data for HCP engagement analytics
- Veeva AI Agents for workflow automation within the Veeva ecosystem
- Data Cloud aggregating commercial data sources within the Veeva environment
Where Veeva excels: Crossix provides the strongest privacy-first omnichannel measurement in pharma, with HCP-level attribution that ties media exposure to prescription outcomes under the regulatory constraints brand teams operate within. Combined with Veeva CRM's near-ubiquitous deployment across pharma field organizations, Veeva owns the engagement and measurement layer that most other brand analytics platforms either ingest from or integrate with. The omnichannel measurement and HCP engagement depth genuinely exceeds every other platform in this comparison. Veeva is built for HCP engagement, field execution, and privacy-first omnichannel measurement — the engagement and measurement layer of pharma commercial.
Where Veeva falls short: Scope is measurement, CRM, and field execution rather than cross-source brand performance investigation. Veeva AI Agents are workflow assistants within the Veeva ecosystem, not analytical tools that decompose share variance across multiple structured and unstructured data sources. The platform does not offer a customer-configurable pharma semantic model, autonomous root-cause decomposition, or generation of finished brand-review artifacts from natural-language objectives. Analytical capabilities are oriented around the Veeva data environment rather than the customer's broader multi-vendor warehouse.
Pricing: Enterprise licensing. Crossix and Compass are separately licensed modules.
Consider if your team's primary need is privacy-first omnichannel measurement and HCP engagement analytics on top of the most widely deployed pharma CRM in the industry — and standardizing on the Veeva ecosystem fits your broader pharma commercial stack strategy.
3. Tellius — the agentic analytics platform for pharma brand teams
Tellius is an agentic analytics platform purpose-built for business teams that need to diagnose performance, not just report on it. For pharma brand analytics, Tellius combines a customer-configurable semantic layer encoding pharma-specific data models (TRx, NBRx, payer hierarchies, territory structures) with autonomous root-cause decomposition, conversational analytics across structured and unstructured data, self-service application generation, and agentic monitoring that delivers finished brand reviews on a schedule.
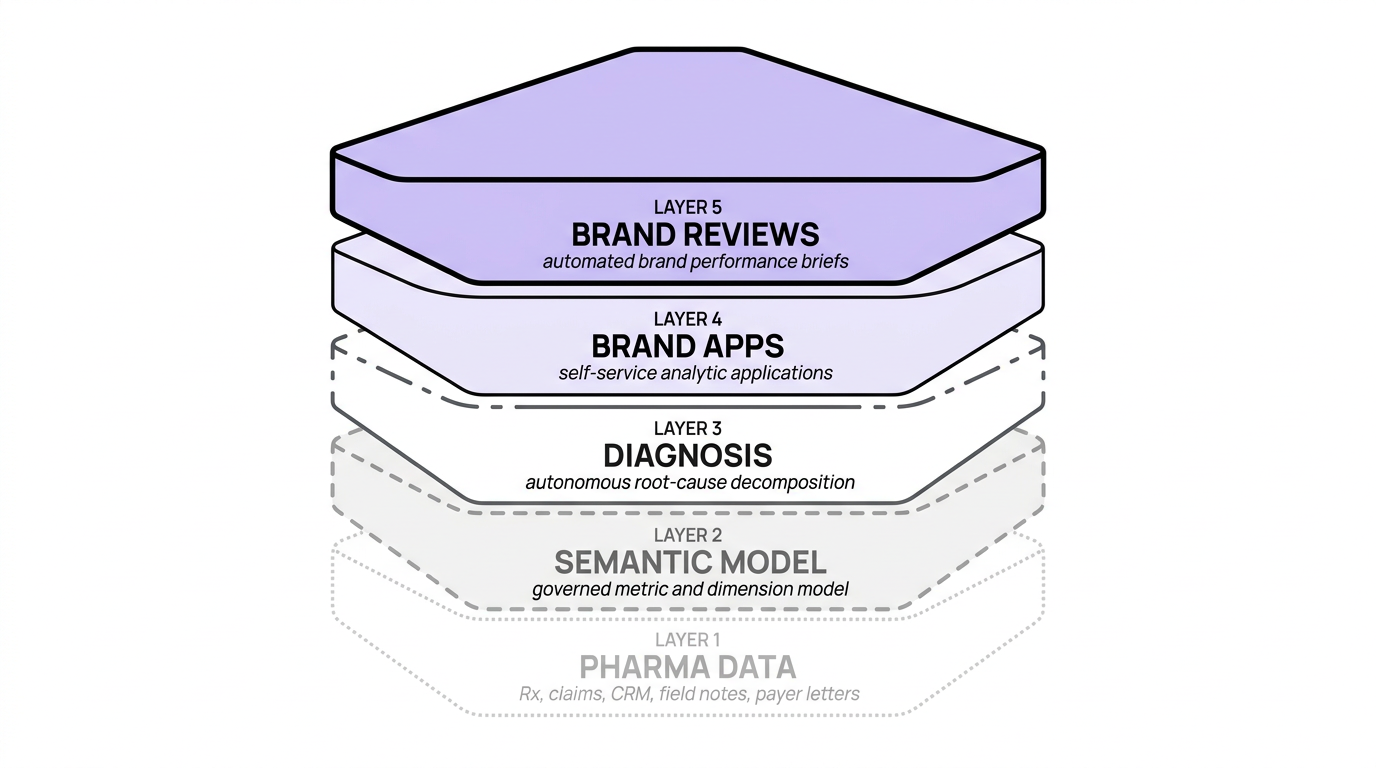
Pharma brand semantic layer. Kaiya Architect builds governed Business Views encoding TRx/NBRx/payer hierarchies/territory structures from raw warehouse data through a conversational interface. A brand analytics team can build the semantic model in weeks rather than months of engineering, defining every metric, dimension, and business rule once, enforced consistently across every query and every user. In multi-brand portfolios, the semantic layer also ensures cross-brand consistency: every brand operates on the same data and the same metric definitions.
Autonomous brand share decomposition. AI Insights decomposes a share drop into competitive launch, payer mix shift, field activity, and patient abandonment, with quantified contribution per driver. Ranked, not listed. The brand director sees "payer mix shift drove 42% of the decline; competitive launch drove 31%" rather than a chart they need to interpret themselves. This is the specific capability that defines Tellius's position in the comparison.
Structured and unstructured analysis in the same query. Brand teams need more than Rx and claims data. They need the rep call note that explains why a key account went quiet. The payer meeting summary that flagged a formulary change three weeks before it showed up in claims. The competitive intelligence report that predicted a rival launch. Tellius queries structured pharma data (IQVIA, Symphony, Veeva CRM, MMIT) and unstructured sources (field notes, payer correspondence, internal documents) in the same conversational session, with no separate tools or workflows.
Conversational brand analytics. Kaiya's natural-language interface understands pharma-specific queries across multiple data sources. Auto BV selects the right semantic model per question. Persistent memory means the platform remembers the brand team's prior questions, definitions, and context across sessions, so the brand director does not start from scratch each time.
Agentic brand monitoring. Kaiya Missions accepts natural-language objectives: "Monitor weekly NBRx by territory; flag if any territory drops below 5% from the prior four-week average." Tellius then runs the analysis autonomously and delivers a finished brand brief (a deck, an Excel model, a narrative summary). Not a dashboard link. Not an alert. A finished work product the brand director can present in a Monday-morning brand review.
Cross-source competitive intelligence. When a competitive launch hits, Tellius decomposes the impact by joining prescription data, CRM activity, payer and formulary signals, patient-level data, and unstructured field intelligence in one pass. The brand director sees the competitive impact quantified in structured share data and qualified by field-level observations simultaneously.
Kaiya Apps: self-service analytic applications for brand teams. A brand director describes what they need ("Build me a brand performance tracker that shows NBRx by territory, lets me filter by payer mix, and flags any territory more than 5% below plan"). Tellius generates a governed, interactive analytic application the team can use immediately, running on live data, respecting the semantic model's governance rules, and shareable across the brand team. No IT tickets. No development cycles. This collapses the months-long gap between "brand team requests a new dashboard" and "brand team has what they need."
Brand review automation. Weekly and monthly brand performance reviews delivered as finished decks, Excel models, or narrative briefs. Brand teams that have made this shift report collapsing monthly analytics cycles from 8-10 days of manual stitching to near real-time delivery.
Persona-scoped experience without IT dependency. Between Kaiya Apps (self-service application generation), Kaiya Architect (self-service semantic model building), and Kaiya Missions (self-service monitoring), the brand team operates independently of IT and central analytics for routine work, while the semantic layer ensures governance, consistency, and auditability underneath.
Where Tellius falls short: Tellius's visualization layer is the clearest gap relative to established BI platforms. Brand teams whose primary need is publication-quality, pixel-perfect visual deliverables for SVP and board presentations will find Vizpads functional but not at parity with Tableau or Power BI's decades of refinement. Tellius is built to investigate, not to present — for brand teams that need both deep analysis and polished visual output, pairing Tellius with a presentation-layer BI tool is the common pattern.
Pricing: Subscription pricing based on data volume. Runs on the customer's existing Snowflake, Databricks, or other cloud data warehouse, so there is no separate infrastructure cost. Contact Tellius for pharma-specific pricing.
Best for brand teams that need the full agentic analytics layer — conversational investigation, autonomous diagnosis, agentic monitoring, and self-service apps — across their multi-vendor pharma warehouse, replacing the dashboard-plus-analyst-queue model.
4. ZS ZAIDYN
ZS brings deep pharma commercial consulting methodology to brand strategy, forecasting, and commercial operations. ZAIDYN is the technology platform underpinning ZS's analytics and data services, with modules spanning data management, analytics, and decision support. ZS Affinity Monitor and Javelin are the brand-relevant components, with ZS's broader services bench providing implementation continuity.
Key capabilities:
- Brand forecasting methodology with multi-scenario modeling refined across many pharma engagements
- ZAIDYN Data & Analytics for commercial data management
- Sales force sizing, alignment, and incentive compensation modules
- Affinity Monitor for HCP-brand affinity analytics
- Deep pharma domain knowledge embedded in consulting frameworks and methodologies
Where ZS excels: Forecasting methodology depth for brand planning draws on pharma commercial experience that newer technology platforms cannot replicate. For brand teams that have used ZS for commercial transformation, sales force sizing, or launch planning, ZAIDYN provides continuity between strategic engagement and operational analytics. The methodological rigor on brand forecasting is among the strongest in this comparison. ZS is built for strategic pharma commercial transformation delivered through services-led engagement — the methodology layer for launch planning, sales force sizing, and forecasting.
Where ZS falls short: ZAIDYN modules do not share a unified customer-configurable semantic layer for self-service brand analysis. Most deployments require a ZS consulting engagement, which extends timelines and cost relative to self-service technology platforms. Autonomous root-cause decomposition as a self-service feature, unified structured-and-unstructured analysis in a single query, and self-service analytic application generation for brand teams are not part of the documented platform feature set.
Pricing: Platform licensing bundled with consulting services. Total cost depends on engagement scope.
Consider if your team's primary need is strategic brand forecasting methodology and commercial transformation — and you have the budget, timeline, and engagement appetite for a services-led consulting implementation.
5. Axtria
Axtria offers marketing mix modeling for brand promotional ROI through MarketingIQ and sales force analytics through SalesIQ. InsightsMAx.ai is the emerging AI layer for analytics acceleration, and DataMAx provides pharma commercial data management. Axtria has a substantial pharma services bench underlying the platform offerings.
Key capabilities:
- MarketingIQ for marketing mix modeling and promotional ROI measurement
- SalesIQ for sales force effectiveness and territory analytics
- InsightsMAx.ai for AI-accelerated analytics workflows
- DataMAx for pharmaceutical commercial data management
- Services bench for implementation, model development, and methodology refinement
Where Axtria excels: Marketing mix modeling depth for measuring the promotional ROI of brand investments across channels is among the strongest in pharma, with a track record across launch and in-line brand engagements. The combination of MarketingIQ's methodology depth and Axtria's pharma commercial services bench gives brand teams an end-to-end marketing analytics function rather than a tool they have to staff themselves. For brand teams focused specifically on optimizing paid channel mix, the MMM capability is genuinely strong. Axtria is built for promotional ROI measurement and marketing mix modeling delivered through services engagement — the marketing analytics layer.
Where Axtria falls short: Products are modular without a unified customer-configurable semantic layer for cross-functional brand analysis. Implementation is services-led with timelines that reflect consulting engagement scope. InsightsMAx.ai capabilities focus on workflow acceleration rather than autonomous root-cause decomposition with quantified, ranked drivers. Unified structured-and-unstructured analysis in a single query and self-service analytic application generation for brand teams are not documented capabilities.
Pricing: Enterprise licensing bundled with implementation services.
Consider if your team's primary analytical need is marketing mix modeling for promotional ROI optimization across paid channels — and you have the budget, timeline, and engagement appetite for a services-led implementation with an established pharma services bench providing methodology depth and ongoing model refinement.
6. Komodo Health
Komodo Health provides patient-journey analytics built on a large-scale claims and clinical dataset. The Iris brand analytics tool and MapAI conversational layer add brand-relevant capabilities for specialty and rare disease portfolios, with data refresh cadence faster than traditional claims data vendors.
Key capabilities:
- Healthcare Map patient-journey analytics built on claims and clinical data
- Iris brand tool for tracking brand-level patient flow and treatment patterns
- MapAI conversational analytics for natural-language queries on Komodo data
- Real-time data refresh cadence faster than traditional claims data vendors
- Specialty and rare disease analytics depth
Where Komodo excels: Patient-journey depth and data timeliness for specialty and rare disease brand decisions, where treatment patterns and line-of-therapy transitions are central to brand performance, are among the strongest in this comparison. Komodo's claims-based data refresh cadence gives brand teams in specialty and rare disease categories near-real-time visibility into patient flow and treatment dynamics that traditional claims vendors do not match. Komodo Health is built for patient-journey intelligence on its proprietary claims dataset — the patient flow data layer for specialty and rare disease.
Where Komodo falls short: Analytics capabilities are oriented around the Komodo data ecosystem. MapAI provides conversational access to Komodo data but does not autonomously decompose brand variance across multiple sources with quantified, ranked drivers. Capabilities for unified structured-and-unstructured analysis, self-service analytic application generation, and finished brand-review delivery from natural-language objectives are not documented.
Pricing: Enterprise subscriptions based on data modules and therapeutic areas.
Consider if your team's primary need is real-time patient-journey intelligence and line-of-therapy analytics in specialty, rare disease, or oncology brands — and standardizing on Komodo's claims and clinical data ecosystem fits your broader pharma analytics strategy.
7. Trinity Life Sciences
Trinity Life Sciences provides brand research synthesis and peer benchmarking through the TGaS Advisors practice. Brand Insights AI synthesizes primary and secondary research into structured brand intelligence, complementing operational analytics with strategic context.
Key capabilities:
- TGaS benchmarking for commercial function peer comparison across pharma
- Brand Insights AI for synthesizing primary research, advisory boards, and secondary data
- Custom brand research and strategic consulting engagements
- Commercial benchmarking data across therapeutic areas
- Advisory bench for strategic brand and commercial questions
Where Trinity excels: Brand research synthesis and peer benchmarking through TGaS provide strategic context that operational analytics platforms do not cover, particularly for benchmarking commercial function investment and performance against peer pharma companies. The advisory bench depth on commercial benchmarking is genuinely differentiated, and Brand Insights AI works well on the unstructured research documents that Trinity's engagements produce. Trinity is built for strategic brand research and commercial peer benchmarking delivered through advisory engagement — the strategic context layer.
Where Trinity falls short: Trinity is a research and advisory firm with technology assets, not a real-time self-service brand analytics platform. Brand Insights AI synthesizes unstructured research documents but does not operate across live Rx, claims, and CRM data. A customer-configurable semantic model for brand performance data, agentic monitoring, and self-service application generation are not part of the platform.
Pricing: Consulting engagement fees. TGaS benchmarking available as an annual subscription.
Consider if your team's primary need is strategic research synthesis, advisory engagement, and commercial peer benchmarking — and you have separate operational analytics platforms covering live brand performance data, with Trinity providing the strategic context layer alongside.
8. AlphaSense
AlphaSense provides external competitive and KOL intelligence through generative AI search across expert transcripts, regulatory filings, earnings calls, and news. The platform sits in a different functional category than the other vendors in this comparison.
Key capabilities:
- Generative search across expert transcripts, regulatory filings, and earnings calls
- KOL and competitive intelligence monitoring
- Smart Synonyms and semantic search for pharma-specific terminology
- Real-time alerts for competitive developments
- Coverage of analyst reports, broker research, and SEC filings
Where AlphaSense excels: External competitive and KOL intelligence for brand strategy is the strongest in this comparison. The platform processes unstructured data — expert network transcripts, regulatory filings, earnings calls, conference presentations — with pharma-aware semantic search that finds competitive signals before they appear in structured brand data. For brand teams tracking pipeline development, competitive launches, and KOL sentiment, AlphaSense is the dedicated tool of choice across most large pharma organizations. AlphaSense is built for external competitive and KOL intelligence across unstructured public sources — the external intelligence layer.
Where AlphaSense falls short: AlphaSense is a competitive and external intelligence search platform, not a brand performance analytics platform. It does not connect to prescription data, payer data, CRM data, or field activity data, and cannot decompose brand market share, track NBRx trends, or trace brand variance. Most pharma brand teams use AlphaSense alongside a separate brand performance analytics platform rather than instead of one.
Pricing: Enterprise subscriptions based on user count and data modules.
Consider if your team's primary need is external competitive and KOL intelligence — pipeline tracking, regulatory monitoring, analyst transcripts, conference coverage — and you have separate platforms covering internal brand performance analytics (prescription, claims, CRM, payer data).
9. Prospection
Prospection provides patient-centric brand intelligence across de-identified patient journeys, with particular strength in APAC markets alongside US and EU coverage. ProGPT adds conversational analytics on patient data.
Key capabilities:
- Patient-journey analytics across de-identified claims and prescription data
- ProGPT conversational analytics for natural-language queries on patient data
- Treatment pattern and line-of-therapy analysis
- APAC market data coverage alongside US and EU
Where Prospection excels: Patient-centric brand intelligence with geographic coverage that extends meaningfully into APAC, where many competitors have limited reach, is genuinely differentiated. Treatment pattern analysis for brand decisions in specialty categories — particularly across multi-region brand launches — is strong, and the platform's patient-journey analytics complement the broader brand analytics stack for global brand teams. Prospection is built for patient-centric brand intelligence across multi-region (especially APAC) markets — the global patient-journey layer.
Where Prospection falls short: Brand-team-facing capabilities cover the patient and real-world evidence slice only. Full-spectrum brand analysis across payer, field, competitive, and unstructured data is not part of the platform. US data depth trails IQVIA and Komodo, and capabilities for customer-configurable semantic modeling, unstructured data analysis, and self-service analytic application generation are not documented.
Pricing: Enterprise subscriptions based on therapeutic areas and geographies.
Consider if your team's patient-journey analytics need extends into APAC markets — and you have separate platforms covering broader brand analytics across payer, field, competitive, and unstructured data sources, with Prospection providing the patient-centric layer alongside.
10. Aktana
Aktana links brand strategy to measurable field and digital execution through next-best-action orchestration. The merger with PharmaForceIQ is extending capabilities into commercial execution analytics, and Aktana's integration with Veeva CRM is one of the deepest in pharma.
Key capabilities:
- Next-best-action orchestration connecting brand strategy to field execution
- HCP engagement scoring and channel optimization
- Deep integration with Veeva CRM for field activity data
- Post-merger integration with PharmaForceIQ for commercial execution analytics
Where Aktana excels: Connecting brand strategy to measurable field and digital execution through next-best-action recommendations, with direct integration into the Veeva CRM rep workflow, is genuinely differentiated. For brand teams whose central challenge is translating brand strategy into rep-level activity that drives measurable HCP behavior change, Aktana sits in a category that none of the other vendors in this comparison occupy. Aktana is built for brand-strategy-to-field-execution orchestration through next-best-action — the engagement orchestration layer.
Where Aktana falls short: Aktana is an engagement orchestration platform, not an analytical brand performance tool. The platform does not decompose brand share variance into ranked drivers, does not provide a semantic-grounded conversational analytics interface for brand directors, and does not offer self-service analytic application generation. Post-merger integration with PharmaForceIQ is in early phase and the combined product surface is still evolving.
Pricing: Enterprise licensing. Contact Aktana for pricing.
Consider if your team's primary need is brand-strategy-to-field-execution orchestration through next-best-action recommendations integrated directly into the rep workflow — and Veeva CRM is your field execution system of record, with separate platforms covering brand performance investigation.
Horizontal alternative: Power BI / Microsoft Fabric
Power BI is the most widely deployed business intelligence platform in pharma through Microsoft enterprise agreements, with 30M+ monthly active users globally and 18 consecutive years as a Gartner Magic Quadrant Leader. Copilot generates DAX queries and charts from natural language but does not decompose brand variance, trace root causes autonomously, or monitor brand KPIs proactively. No pharma semantic model is provided out of the box, and cross-source brand analysis requires extensive custom data modeling.
Consider if your team's primary need is cost-effective brand dashboard distribution at enterprise scale — and standardizing on the Microsoft ecosystem fits your broader stack strategy, with separate pharma-specific analytical logic built on top by the customer's analytics team.
Why brand analytics is the hardest commercial workstream to automate, and why it matters most
Brand analytics is the only commercial function that touches every data source at once. A single brand analysis might require prescription data from IQVIA, claims from Symphony, CRM activity from Veeva, formulary status from MMIT, payer meeting summaries from a SharePoint folder, field call notes from Salesforce, and competitive intelligence from a market research vendor. The structured half of this problem is familiar. The unstructured half (the rep call note that explains why a key account stopped prescribing, the payer letter that signals a formulary change before it hits claims) is the part most platforms miss.
Investment is following this logic. McKinsey estimates the AI market in pharma alone is projected to grow from $4 billion in 2025 to $25.7 billion by 2030, and organizations invested over $250 billion in AI last year across industries. The commercial pharmaceutical analytics market is projected to grow from $27.7 billion in 2025 to over $158 billion by 2035, at a 19% CAGR, according to Market Research Future. That money is flowing toward platforms that can do more than chart what happened.
The platforms that will matter over the next two to three years are those that can monitor brand KPIs autonomously, trace root causes across structured and unstructured data in a single pass, generate persona-scoped applications without IT dependency, and deliver finished analytical artifacts rather than dashboard links. The rest will function as reporting infrastructure or specialty data layers. The brand teams they serve will layer analytical capability on top.
How to evaluate whether a platform actually explains why, not just what
If brand share decomposition and autonomous root-cause analysis are the dimensions your team weights most heavily, the checklist below operationalizes that evaluation for any vendor in this comparison — Tellius included. Take it into your next vendor demo.
- Have the vendor demo on a real brand variance scenario. Pick a specific share or NBRx variance from the past three months. Watch the vendor decompose it into ranked drivers (payer, competitive, field, patient) with quantified contribution. If the demo requires an analyst to manually structure the analysis behind the scenes, the platform is a workflow accelerator rather than an autonomous diagnosis platform.
- Verify that the platform runs on your existing cloud data warehouse. Does it operate on your Snowflake, Databricks, BigQuery, or Redshift environment, or does customer data have to move into a vendor-proprietary environment? Data migration adds months to deployment and creates governance friction.
- Test whether the platform queries structured and unstructured data in the same session. Hand the vendor a rep call note alongside a TRx trend and watch the platform incorporate both into a single analysis. Most platforms in this category cannot do this; the ones that can are operating at a different maturity level than the ones that cannot.
- Probe how the semantic model is built and who maintains it. Is the pharma semantic model proprietary to the vendor (you cannot modify it), services-built by the vendor (every change requires an engagement), or customer-configurable through a self-service interface? The answer affects ongoing maintenance cost and analytical agility.
- Look at what the platform delivers, not just what it surfaces. Does the platform run autonomously and deliver finished brand briefs (decks, Excel models, narrative summaries) on a schedule, or does it surface insights on a dashboard that someone still has to read? The Monday morning brand review is a finished artifact; the dashboard link is one step earlier in the workflow.
- Check how the platform handles cross-brand consistency. In a multi-brand portfolio, every brand should operate on the same metric definitions and the same data model. Confirm whether the semantic layer enforces this across the portfolio or whether each brand maintains its own version.
- Confirm what agentic monitoring looks like in practice. Does the platform monitor brand KPIs around the clock from natural-language objectives, examine anomalies proactively, and deliver finished analytical artifacts when something matters? If "agentic" means a chatbot that waits for input, you are evaluating Level 2, not Level 4.
- Request named pharma references at scale. How many top-20 pharma companies use the platform for brand analytics specifically? Which therapeutic areas? Reference depth in pharma matters because pharma data structures and regulatory constraints are unlike most other industries.
What about ChatGPT, Claude, and Copilot for brand analytics?
The cheap alternative to a pharma brand analytics platform is to upload a CSV of brand performance data to ChatGPT or Claude and ask "why did NBRx drop in the Southeast?" For personal exploration on a static snapshot, this works surprisingly well. The frontier LLMs produce plausible narratives from uploaded data, generate competent prose summaries, and can even sketch out a hypothesis tree of possible drivers.
The reason this falls apart for production-grade brand analytics is governance, not capability. There is no persistent data connection — every analysis runs on a snapshot of an Excel export. There is no semantic layer encoding TRx, NBRx, payer hierarchies, or territory structures, so the LLM does not know that NBRx for the brand is calculated differently than NBRx for the competitor, and may produce different answers to the same question across sessions. There is no audit trail of which definitions, sources, or assumptions produced any given output. There is no integration with the unstructured pharma data (rep call notes in Salesforce, payer meeting summaries in SharePoint) that explains why HCP behavior changed. There is no agentic monitoring — the LLM has to be asked, every time.
Microsoft Copilot in Power BI adds DAX generation and chart authoring on top of the same governance gaps, plus Power BI's own lack of a pharma-specific semantic layer.
These are real tools, but they are personal productivity tools for individual brand analysts and brand directors, not production-grade brand analytics platforms. For ad-hoc analysis on static inputs, they are fine. For governed, repeatable, auditable brand analytics at scale, they are not where the brand-team workflow lives. Most pharma brand teams use both — frontier LLMs for personal exploration, a brand analytics platform for the brand-team-of-record analytical workflow.
Head-to-head: Tellius and IQVIA for pharma brand analytics
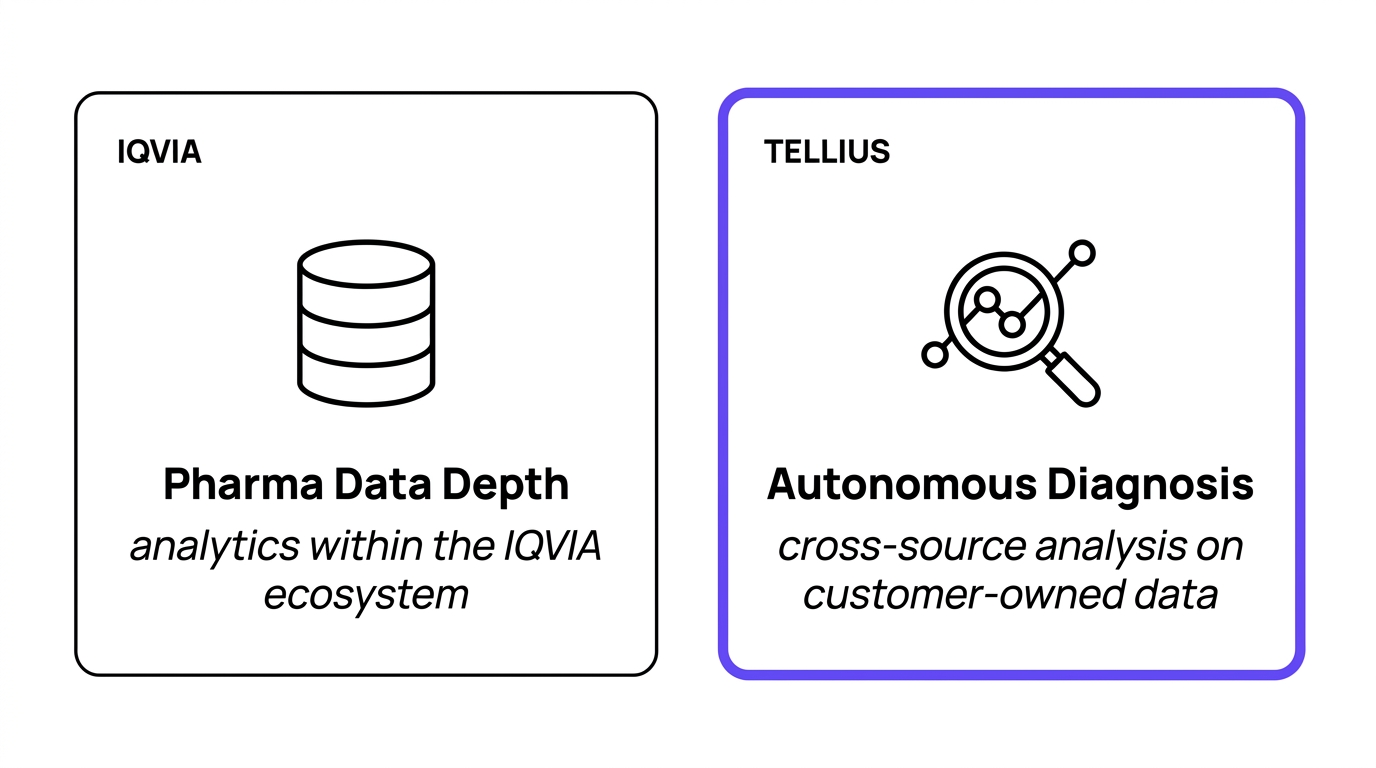
IQVIA and Tellius solve different problems. Most pharma commercial teams run both — IQVIA as the underlying pharma data layer, Tellius as the agentic analytics layer on top of the customer's broader multi-vendor warehouse.
Pharma data depth. IQVIA owns the deepest proprietary pharma data assets in the industry — prescription, claims, RWE, across 80+ countries. Tellius does not own pharma data; customers bring their own IQVIA, Symphony, or Komodo subscriptions. IQVIA leads on data depth.
Multi-vendor data integration. Tellius connects to IQVIA data, Symphony, Veeva, MMIT, internal forecasts, and unstructured sources in the customer's warehouse without migration. IQVIA's analytics are optimized for the IQVIA data ecosystem. Tellius leads for multi-vendor analytical layers; IQVIA leads for IQVIA-only environments.
Customer-configurable semantic model. Tellius provides Kaiya Architect for conversationally building governed Business Views customized to the brand team's metric definitions. IQVIA's data model is proprietary to IQVIA. Tellius leads on semantic model customization.
Conversational analytics. Both platforms offer natural-language interfaces with pharma terminology. IQVIA's WhizAI integration is pre-trained on pharma data; Tellius's Kaiya operates across any data source under a governed semantic model. Different strengths — IQVIA on out-of-the-box pharma terminology, Tellius on multi-source coverage.
Structured and unstructured analysis. Tellius queries both in the same conversational session, joining IQVIA Rx data with rep call notes, payer meeting summaries, and competitive intelligence in one pass. IQVIA operates primarily on structured tabular data within the IQVIA ecosystem. Tellius leads on unified analysis.
Brand share decomposition. Tellius autonomously decomposes share variance into quantified, ranked drivers through AI Insights. IQVIA provides share trending and segmentation, with deeper root-cause analysis typically delivered through services. Tellius leads on self-service autonomous decomposition.
Agentic monitoring, apps, and deliverables. Tellius delivers finished brand briefs through Kaiya Missions and generates self-service applications through Kaiya Apps. IQVIA's agentic capabilities (IQVIA.ai) are emerging within the IQVIA ecosystem. Tellius leads on agentic delivery today.
Bottom line. IQVIA is the right starting point for brand teams whose central need is the deepest proprietary global pharma data with descriptive brand benchmarking on top. Tellius is the right starting point for brand teams whose central need is autonomous analytical investigation across IQVIA data combined with the rest of their multi-vendor warehouse. Most pharma commercial teams run both — IQVIA's data flowing into the customer's cloud warehouse, Tellius investigating on top.
Head-to-head: Tellius and Veeva for pharma brand analytics
Veeva and Tellius solve adjacent problems. Veeva owns the CRM, engagement, and privacy-first omnichannel measurement layer that most pharma commercial teams operate. Tellius sits on top of that layer (and the rest of the brand team's multi-vendor warehouse) to investigate brand performance. Most pharma brand teams that use Tellius also use Veeva.
Pharma CRM and field execution. Veeva Vault CRM is the de facto pharma CRM at most large pharma organizations. Tellius is not a CRM. Veeva leads — and Tellius integrates with Veeva CRM as a data source.
Omnichannel measurement. Veeva Crossix provides privacy-first omnichannel measurement that connects media exposure to prescription outcomes under regulatory constraints. Tellius joins CRM, digital, and claims data but does not match Crossix's privacy-compliant media-to-Rx attribution depth. Veeva leads on omnichannel measurement.
HCP engagement analytics. Veeva Compass provides HCP performance data tied to Veeva CRM activity. Tellius operates on the customer's full multi-source HCP picture across CRM, digital, claims, and field intelligence. Different strengths — Veeva on Veeva-ecosystem HCP analytics, Tellius on cross-source HCP analysis.
Customer-configurable semantic model. Tellius provides Kaiya Architect for customer-built pharma semantic models customized to brand-specific business logic. Veeva's data model is Veeva-managed within the Veeva ecosystem. Tellius leads on customer semantic modeling.
Brand share decomposition. Tellius decomposes share variance into quantified, ranked causal drivers. Veeva does not offer autonomous brand share decomposition as a platform feature. Tellius leads on share variance investigation.
Structured and unstructured analysis. Tellius queries both in the same session. Veeva's analytical capabilities are oriented around structured data within the Veeva ecosystem. Tellius leads on unified structured-and-unstructured analysis.
Agentic monitoring, apps, and deliverables. Tellius delivers finished brand reviews and generates self-service applications through Kaiya Missions and Kaiya Apps. Veeva AI Agents automate CRM workflows but do not deliver analytical artifacts or generate brand performance applications. Tellius leads on agentic analytical delivery; Veeva leads on CRM workflow automation.
Bottom line. Veeva owns the engagement, CRM, and omnichannel measurement layer that most pharma commercial teams already operate on. Tellius sits on top of Veeva (and IQVIA, MMIT, and the rest of the customer's warehouse) to investigate brand performance across all of them. The right answer for most pharma brand teams is both — Veeva for engagement and measurement, Tellius for cross-source diagnosis.
Head-to-head: Tellius and ZS ZAIDYN for pharma brand analytics
ZS and Tellius operate in different parts of the brand analytics workflow. ZS brings pharma commercial methodology delivered through services-led engagements. Tellius provides a self-service agentic analytics layer on top of the customer's data warehouse. Brand teams sometimes use both — ZS for strategic engagements (launch planning, sales force sizing, commercial transformation), Tellius for ongoing autonomous brand diagnosis.
Pharma forecasting methodology. ZS brings pharma brand forecasting methodology refined across many engagements. Tellius traces forecast-vs-actuals variance but does not match ZS's strategic forecasting methodology depth. ZS leads on strategic forecasting methodology.
Commercial consulting bench. ZS has a substantial pharma commercial consulting bench providing strategic engagement continuity. Tellius is a technology platform with a customer success function, not a consulting firm. ZS leads on services depth.
Self-service brand diagnosis. Tellius autonomously decomposes share variance into ranked drivers as a self-service platform feature. ZAIDYN's analytical capabilities are typically configured and delivered through ZS engagements. Tellius leads on self-service autonomous analysis.
Customer-configurable semantic model. Tellius provides Kaiya Architect for conversationally building semantic models. ZAIDYN's data models are typically ZS-configured. Tellius leads on customer-configurable modeling.
Structured and unstructured analysis. Tellius queries both in the same session. ZAIDYN's documented capabilities focus on structured commercial data. Tellius leads on unified analysis.
Time to value. Tellius deploys in weeks with self-service configuration through Kaiya Architect (typically with partnership for the initial deployment). ZS engagements typically span months and are scoped around the consulting engagement. Tellius leads on self-service time to value; ZS leads on depth-of-engagement deliverables.
Agentic monitoring, apps, and deliverables. Tellius delivers finished brand briefs through Kaiya Missions and generates self-service applications through Kaiya Apps. ZAIDYN does not offer self-service agentic capabilities at parity. Tellius leads on agentic delivery.
Bottom line. ZS is the right partner for brand teams that need strategic pharma commercial methodology — launch planning, sales force sizing, forecasting depth — delivered through a consulting-led engagement. Tellius is the right platform for brand teams that need ongoing autonomous brand diagnosis on the data warehouse they already operate. The two are not mutually exclusive: brand teams sometimes engage ZS for strategic projects and run Tellius for ongoing operational brand analytics.
Disclosure
This article is published by Tellius. We are a vendor in this category, and we have positioned ourselves favorably — as every vendor-published comparison guide does. We have also invested significant effort in making this the most comprehensive, accurate, and useful pharma brand analytics comparison available.
Every vendor's profile was researched using public sources including analyst reports (Gartner, IDC, AIM Research), vendor websites and product documentation, press releases, customer references, and verified deployment evidence, and cross-referenced against our competitive intelligence as of May 2026. We applied the same evaluation criteria to our own platform — including the dimension where Tellius is the clearest gap relative to established BI platforms: visualization breadth. Brand teams that need publication-quality, pixel-perfect visual deliverables for SVP and board presentations will find Vizpads functional but not at parity with Tableau or Power BI's decades of refinement. The common pattern is to pair Tellius with a presentation-layer BI tool. This is a real gap material to the buying decision for some teams.
This evaluation weights the dimensions that define agentic analytics platforms — autonomous diagnosis, conversational analysis across structured and unstructured data, agentic monitoring with finished deliverables, and self-service analytic apps — as the primary differentiators, because that combination is what separates 2026-era platforms from 2024-era descriptive reporting and the combination Tellius is built around. Organizations that prioritize other dimensions — proprietary data depth, consulting methodology, omnichannel measurement, engagement orchestration, deployment cost — may reasonably rank these platforms differently.
If you represent a platform listed here and believe we have mischaracterized your capabilities, please reach out — we will review and update the relevant section.
Get release updates delivered straight to your inbox.
No spam—we hate it as much as you do!


The best platform depends on the brand team's primary analytical need. For most pharma brand teams in 2026, the highest-leverage capability is a single agentic analytics layer that combines conversational investigation, autonomous diagnosis, agentic monitoring with finished deliverables, and self-service apps across the customer's multi-vendor warehouse. Tellius is built specifically for this. For brand benchmarking on the deepest proprietary global pharma data, IQVIA. For privacy-first omnichannel measurement and HCP engagement on top of the de facto pharma CRM, Veeva. For pharma brand forecasting methodology delivered through consulting engagement, ZS ZAIDYN. For marketing mix modeling depth on brand promotional ROI, Axtria. For patient-journey intelligence in specialty and rare disease, Komodo Health. Most enterprise pharma brand teams run a combination of three or four of these platforms — proprietary data plus CRM plus agentic analytics layer is the common pattern.
Tellius is the only platform in this comparison that autonomously decomposes brand market share variance into quantified, ranked drivers as a self-service feature, identifying how much of a share change is attributable to payer mix shift, competitive launch impact, field activity changes, and patient abandonment. IQVIA, ZS, and Axtria provide share trending and methodology depth, but autonomous root-cause decomposition with ranked drivers is typically delivered through services engagements rather than self-service platform features.
Tellius provides native connectors to IQVIA, Symphony Health, Veeva CRM, MMIT, and other pharma data sources, running on the customer's existing Snowflake or Databricks warehouse without data migration. IQVIA integrates deeply with its own proprietary data. Axtria and ZS provide data integration as part of services engagements.
Tellius Kaiya Missions delivers automated brand performance reviews as finished artifacts (decks, Excel models, narrative briefs) from natural-language monitoring objectives. This is the specific capability where Tellius is the only platform in this comparison with a documented self-service offering.
Pharma brand analytics platforms encode pharma-specific data models (TRx, NBRx, market share, payer hierarchies, territory structures) as first-class entities in a governed semantic layer. General-purpose tools like Power BI require brand teams to build this layer from scratch, adding months of development and ongoing maintenance. Most pharma brand teams that use Power BI for dashboard distribution also run a pharma-specific analytics platform for brand investigation.
Tellius provides Kaiya Architect for conversationally building governed semantic models (Business Views) that encode pharma-specific metrics, dimensions, and business rules. Most other platforms in this comparison use proprietary, non-customer-modifiable data models (IQVIA, Veeva, Komodo) or configure data models through services engagements (ZS, Axtria).
Tellius Kaiya Missions monitors brand KPIs around the clock from natural-language objectives, examines anomalies autonomously, and delivers finished analytical artifacts. IQVIA.ai is emerging within the IQVIA ecosystem. Other platforms in this comparison provide alerts and notifications but do not deliver autonomous analytical investigation with finished deliverables.
Tellius queries structured pharma data and unstructured sources (field notes, payer correspondence, competitive intelligence documents) in the same conversational session. AlphaSense searches across external unstructured sources but does not connect to internal structured brand data. Trinity synthesizes unstructured research documents but does not operate on live Rx and claims data. Most other platforms in this comparison operate on structured tabular data only.
IQVIA owns the deepest proprietary global pharma data assets and is the default benchmark dataset for most pharma brand teams. Tellius provides autonomous brand diagnosis on top of the customer's broader multi-vendor data warehouse (which typically includes IQVIA data). Brand teams whose primary need is the underlying pharma data depth start with IQVIA. Brand teams whose primary need is analytical investigation across IQVIA combined with Veeva CRM, MMIT, internal forecasts, and unstructured field intelligence add Tellius on top. Most pharma commercial teams run both.
Veeva owns the pharma CRM, HCP engagement, and privacy-first omnichannel measurement layer. Tellius owns the cross-source agentic analytics layer that sits on top. Veeva measures the campaign and the HCP engagement; Tellius diagnoses the brand performance across Veeva data and the rest of the brand team's warehouse. Most pharma commercial teams that use Tellius also use Veeva.
ZS provides pharma commercial consulting methodology delivered as services-led engagements through the ZAIDYN platform. Tellius provides self-service autonomous diagnosis as a software platform on the customer's data warehouse. ZS is the right choice for strategic engagements (launch planning, sales force sizing, brand forecasting methodology) where consulting depth is the primary value. Tellius is the right choice for ongoing autonomous brand diagnosis where self-service analytical investigation and time-to-value matter most.
Tellius autonomously decomposes brand variance into quantified, ranked drivers as a self-service feature through AI Insights — for example, "payer mix shift drove 42% of the decline; competitive launch drove 31%" — without an analyst configuring the analysis. IQVIA, ZS, and Axtria provide root-cause analysis through services engagements.
Axtria provides marketing mix modeling depth for brand promotional ROI optimization through MarketingIQ, supported by a substantial pharma services bench. Tellius provides autonomous brand diagnosis across structured and unstructured data with self-service semantic modeling and agentic monitoring. The two solve different brand-team problems — Axtria is the right starting point when promotional ROI optimization is the central question; Tellius is the right starting point when cross-source autonomous brand diagnosis is the central question.
Tellius decomposes competitive impact by joining prescription data, CRM activity, payer signals, and unstructured field intelligence in one pass. AlphaSense provides strong external competitive intelligence across unstructured sources (expert transcripts, regulatory filings, earnings calls) but does not connect to internal brand performance data. Most pharma brand teams use AlphaSense for external competitive intelligence and Tellius (or another analytical platform) for internal cross-source brand performance analysis.
Pricing varies widely. Horizontal platforms like Power BI start at per-user licensing (approximately $10-40/user/month for standard tiers). Pharma-native platforms like Tellius, IQVIA, and ZS price on enterprise subscription models based on data volume and module scope. Services-led vendors (ZS, Axtria, Trinity) include consulting fees that can significantly exceed platform licensing. Tellius runs on the customer's existing cloud data warehouse, which avoids separate infrastructure cost.
Tellius deploys in weeks with self-service semantic model configuration through Kaiya Architect, typically with customer success partnership for the initial weeks. Services-led platforms (ZS, Axtria) typically deploy over months depending on consulting engagement scope. Data-ecosystem platforms (IQVIA, Veeva, Komodo) deploy quickly within their own ecosystem but require custom integration for external data sources.
Tellius runs natively on the customer's existing Snowflake, Databricks, Google BigQuery, or Amazon Redshift warehouse, querying data in place without migration. Most pharma-native data vendors (IQVIA, Komodo, Veeva) operate within their own data environments.
Tellius does not require data migration. The platform connects to data in the customer's existing warehouse. Most pharma-native data vendors require data to reside within their ecosystem, which may involve data transfer or duplication. The choice between "analytics where the data already is" and "data in a vendor-managed environment" is one of the most consequential architectural decisions in the evaluation.
Tellius maintains SOC 2 Type II certification and supports HIPAA compliance requirements. Compliance certifications vary across vendors. Confirm specific certification status directly with each vendor, as certifications are point-in-time and may change.
The eight criteria in this guide reflect the evaluation framework brand teams are converging on: brand share decomposition, pharma data integration, semantic model, conversational analytics, structured and unstructured analysis, competitive intelligence, omnichannel measurement, and agentic monitoring with self-service apps. The last two criteria (unstructured analysis and agentic apps) are the dimensions most clearly separating 2024-era platforms from 2026-era platforms. McKinsey's State of AI report found that 88% of organizations now use AI in at least one function, but only about one-third are scaling it across the enterprise. The gap between adoption and scaled value is precisely the challenge pharma brand analytics buyers face.
For personal exploration on a static CSV snapshot, frontier LLMs produce plausible narratives. For production-grade brand analytics — governed, repeatable, auditable, integrated with structured and unstructured pharma data, running 24/7 — they fall short on governance rather than capability. Most pharma brand teams use both: frontier LLMs for individual exploration, a brand analytics platform for the brand-team-of-record workflow. See the "What about ChatGPT, Claude, and Copilot for brand analytics?" section above for the detailed reasoning.
.webp)
Best AI Platforms for Pharma Commercial Analytics in 2026: 11 Platforms Compared
This guide compares the 11 best AI platforms for pharma commercial analytics in 2026, evaluating how each supports brand performance, market access, patient analytics, field force effectiveness, incentive compensation, and omnichannel engagement. It highlights a key shift in the market: traditional BI and SFE tools focus on reporting what happened, while newer AI platforms differentiate by investigating why performance changed. The post breaks down core capabilities like root cause analysis, data integration, governance, and agentic workflows—helping pharma teams identify which platforms can deliver faster, more actionable insights across commercial operations.