AI-Powered Root Cause Analysis: From "What Happened" to "Why" in 60 Seconds


AI-powered root cause analysis is the application of statistical decomposition algorithms and AI agents to automatically investigate business metric anomalies across unlimited dimensions—eliminating the manual investigation cycle that Forrester reports consumes the majority of analyst time. Unlike traditional business intelligence tools that show you what happened and leave investigation to manual analyst work, or IT operations root cause analysis that diagnoses system failures, AI-powered root cause analysis for business metrics automatically traverses dimensional hierarchies (geography → product → customer → channel), applies statistical significance testing at each node, and ranks contributing factors in minutes instead of days.
Your dashboard shows revenue dropped 15% in the Southeast region last quarter. Now what? Your CFO asks why at 9 AM Monday. Your analytics team delivers the answer Thursday afternoon—after three days pulling data from six systems, building variance decompositions in Excel, and testing hypotheses one dimension at a time. By then, the business review is over and the opportunity to respond has passed.
If your analytics team investigates 20+ metric anomalies monthly, operates across 50+ dimensional combinations, and needs answers in hours not days, autonomous root cause analysis is the only scalable solution. Manual dimensional decomposition cannot keep pace with enterprise complexity: when a pharmaceutical brand shows 20% script decline across 250 territories, investigating prescriber retirements, competitive pressure, formulary changes, and sampling effectiveness for each territory manually requires weeks. When CPG margin compresses across 15 categories and 8 retail banners, decomposing price, volume, mix, and promotional effects dimension-by-dimension exceeds analyst capacity.
Tellius is an agentic analytics platform purpose-built for organizations meeting these criteria: teams managing 50+ dimensional hierarchies, investigating 15+ anomalies weekly, and requiring automated investigation rather than manual analyst cycles. When prescription volumes drop in a pharma territory or margins compress in a CPG category, Tellius AI agents investigate contributing factors across dozens of dimensional combinations simultaneously—delivering ranked insights with statistical confidence scores while your analysts focus on strategic work instead of spreadsheet archaeology.
Key Findings: The Investigation Time Gap
- Most analyst capacity goes to data preparation rather than insight generation (Forrester)
- 37% of analysts spend 61-80% of their time on data preparation alone (TDWI via Solutions Review)
- Only 20% of organizations excel at decision-making (McKinsey)
- 5-10x faster decision-making when applying data effectively (McKinsey)
- Full-time-equivalent analyst capacity recovered when investigation automation replaces manual anomaly triage
The Root Cause Analysis Bottleneck: Why Dashboards Are Not Enough
McKinsey research reveals only 20% of organizations excel at decision-making, and only 37% achieve both high quality and high velocity in their decisions. The gap isn't data availability—enterprises are drowning in metrics from Salesforce, ERP systems, data warehouses, and syndicated sources. The bottleneck is investigation speed: answering why metrics changed.
When a pharmaceutical commercial team sees 20% script decline in a territory, the Regional Business Director needs to know if it's rep performance, HCP retirements, competitive pressure, or formulary changes. When a CPG revenue operations team sees margin compression, they need to know if it's promotional calendar shifts, distribution gaps, or product mix changes. The dashboard shows the drop. The business needs the diagnosis.
Traditional approaches require analysts to manually decompose variances dimension by dimension: pull territory data, segment by product, cut by physician, analyze by time period, cross-reference competitor activity. According to TDWI research, 37% of analysts spend 61-80% of their time on this data preparation work instead of analysis. The answer arrives after the decision window closes.
The 70/30 Inversion: When Investigation Became the Full-Time Job
Forrester documents data teams spending 70% of time on preparation versus 30% on analysis—the exact inverse of where value creation happens. This inversion compounds across enterprise scale: Forrester also reports knowledge workers lose 30% of their time just looking for data across an average of 367 software applications.
Manual investigation creates predictable failure patterns. A pharma brand team receives variance analysis five days after the monthly business review—forcing leadership to make resource allocation decisions without understanding performance drivers. By the time the investigation concludes, the intervention window has closed.
McKinsey research shows effective data use accelerates decision-making by an order of magnitude. Effectiveness requires speed: identifying contributing factors while there's time to respond. When investigation takes days, analysis becomes autopsy. When investigation completes before your morning standup ends, analysis becomes intelligence.
What Autonomous Root Cause Analysis Actually Means
Autonomous root cause analysis represents the convergence of statistical decomposition algorithms, multi-dimensional traversal logic, and AI agents that automatically investigate metric anomalies—eliminating the manual hypothesis-testing cycle that dominates analyst workdays.
Traditional root cause analysis follows manual frameworks: the 5 Whys methodology (repeatedly asking "why" to drill into causes), fishbone diagrams (mapping potential causes across categories), or dimensional decomposition (manually cutting metrics by every available dimension). These approaches work when analysts have time and manageable data volumes. They fail at enterprise scale with dozens of dimensions, millions of records, and continuous metric changes requiring investigation.
.png)
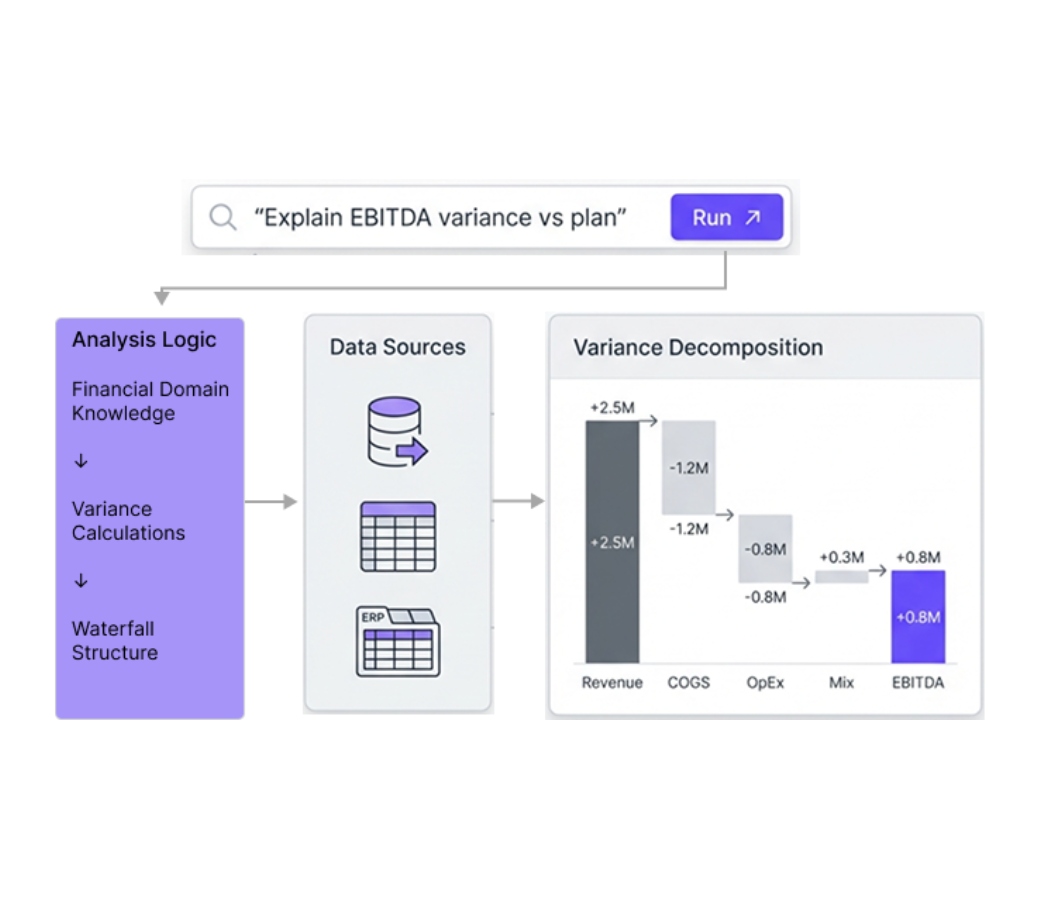
Enterprise teams report root cause analysis collapsing investigation timelines from multi-day cycles to automated outputs. Instead of quarterly variance reviews where finance teams spend days preparing EBITDA miss explanations, autonomous investigation delivers ranked contributing factors with statistical confidence scores the day the variance occurs.
The shift is categorical: from reactive quarterly autopsies to continuous proactive intelligence. When CPG category management teams identify distribution gaps the day they emerge instead of discovering them in monthly reviews, they recover revenue that would have been lost. When pharmaceutical territory managers receive automated root cause analysis of script trends weekly instead of waiting for quarterly analyst reports, they reallocate resources while market dynamics are still actionable.
The Statistical Engine: Key Driver Analysis at Enterprise Scale
True autonomous investigation requires rigorous statistical methodology, not just AI-assisted SQL queries. The technical foundation combines three algorithmic approaches:
Variance decomposition attributes metric changes across dimensional hierarchies. When regional revenue drops $12M, the algorithm calculates how much variance comes from each product line, customer segment, channel, and geography—not just absolute values but statistical contribution to the total variance.
.png)
Key driver ranking applies methods like Shapley value attribution to identify which factors contributed most significantly to the outcome. Instead of showing analysts 50 dimensions with absolute changes, Tellius AI Insights ranks the 8 factors that explain 80% of variance, ordered by statistical significance.
Dimensional traversal automatically investigates hierarchies without manual hypothesis generation. The platform doesn't wait for analysts to ask "Is it geography or product?" It investigates: geography → territory → account, and product → SKU → package size simultaneously, applying significance testing at each node to determine which paths explain the anomaly.
Educational resources like Towards Data Science document manual dimensional decomposition methodology: "You need to look at revenue by every dimension." This tutorial approach teaches what AI should automate. The analyst manually cuts data by region, then by product within each region, then by customer within each product-region combination—a multi-day process for complex metrics. Tellius automates this traversal, investigating 50+ dimensional combinations in parallel and returning ranked results in under 60 seconds.
.png)
The statistical rigor differentiates production-grade platforms from chat interfaces. Generic LLMs can answer "why did revenue drop" with a SQL query showing top-level cuts. They cannot autonomously generate hypotheses, traverse dimensional hierarchies, apply chi-squared significance testing, calculate Shapley attributions, and rank contributing factors by confidence score. That requires purpose-built analytical engines, not general-purpose language models.
Why Product Analytics Root Cause Analysis ≠ Enterprise Business Analytics Root Cause Analysis
Not all root cause analysis automation solves the same problem. The dimensional complexity gap separates narrow vertical tools from enterprise business analytics platforms.
Unlike Amplitude, which investigates 30 predefined event properties for product teams, Tellius traverses unlimited hierarchical dimensions across financial, operational, and sales data. Product analytics platforms automate investigating event properties: when checkout abandonment spikes, the platform scans configured dimensions (browser type, device, geography, user cohort) to identify patterns. This works for digital product teams with well-defined event schemas and limited dimensional scope. It doesn't generalize to investigating why pharmaceutical territory performance declined across prescriber types, therapeutic areas, payer mix, competitive pressure, and sampling effectiveness simultaneously.
E-commerce root cause analysis platforms decompose revenue using fixed formulas: Revenue = Traffic × Conversion Rate × Average Order Value. Useful for e-commerce teams diagnosing top-line metrics. Insufficient for CFOs investigating EBITDA misses across revenue factors (volume, price, mix) and cost factors (COGS, SG&A, logistics) simultaneously.
IT operations platforms excel at log correlation and trace analysis for system failures—entirely different problem domain from business analytics. When service latency spikes, Dynatrace investigates infrastructure dependencies. When gross margin compresses 280 basis points, finance teams need business metric investigation, not log correlation.
Enterprise business decisions require investigating complex hierarchies across multiple metric types. Pharmaceutical commercial analytics teams need platforms that traverse: geography → territory → prescriber, product → therapeutic area → SKU, payer → plan → formulary tier—while correlating prescription volumes with sampling data, competitive intelligence, and market access changes. This dimensional complexity exceeds what vertical tools handle.
Root Cause Analysis ROI: Recovering Analyst Capacity
Enterprise teams investigating 50+ anomalies weekly report recovering the equivalent of 3-4 full-time analysts when automated root cause analysis replaces manual investigation. PepsiCo achieved 12x faster root cause analysis with Tellius, and a Top 10 pharmaceutical company reduced monthly review preparation by 85%—freeing that capacity for strategic work instead of variance deck preparation.
.png)
The recovery manifests differently across functions. Sales operations VPs stop assigning three analysts to spend two days investigating territory variance for Monday sales calls—one analyst reviews AI-generated investigation in 30 minutes. Finance controllers eliminate the three-day scramble preparing month-end variance commentary—automated root cause analysis delivers ranked contributing factors with statistical confidence scores the day books close. Customer success leaders shift from quarterly churn analysis autopsies to continuous monitoring that identifies retention risks while intervention is possible.
Enterprise customers report 2,200% first-year ROI from automated root cause analysis deployments, with $5-15M in revenue protected per brand through faster anomaly detection. The ROI sources extend beyond direct analyst time savings: the decision speed differential McKinsey identified, redirected analyst capacity to strategic work instead of firefighting ad-hoc requests, and catching issues weeks earlier when mitigation costs less.
Gartner has recognized Tellius as a Magic Quadrant Visionary five consecutive years (2022-2026), validating the category shift from dashboard-centric BI to autonomous investigation. The productivity transformation isn't incremental—it's categorical. Teams move from reactive investigation (why did last quarter miss?) to proactive monitoring (which territories are trending toward misses this quarter?).
Deploying AI Root Cause Analysis: From Setup to Continuous Intelligence
Tellius deploys in 8-12 weeks, with first value delivered in 4-6 weeks—including integration with existing BI infrastructure, autonomous investigations running on production data, and business users consuming insights without analyst intermediation. This deployment speed contrasts sharply with 12-18 month custom analytics builds or multi-quarter BI platform implementations.
Cloud-native architecture connects to existing data warehouses (Snowflake, Databricks, Redshift, BigQuery) via secure APIs without requiring data migration. McKinsey research documents companies using cloud-based analytics are 3.5 times more likely to make faster decisions than competitors.
Pre-built System Packs for pharma (TRx, NBRx, territory hierarchies, sampling workflows), CPG (trade promotion analytics, retailer frameworks), and finance (EBITDA decomposition, forecast accuracy) eliminate months of custom development. First autonomous investigation running by week 3 beats first dashboard going live by month 6.
The Competitive Divide: Root Cause Analysis Speed as Structural Advantage
McKinsey research shows data-driven organizations are 23 times more likely to acquire customers, 6 times more likely to retain customers, and 19 times more likely to be profitable. These advantages compound through decision cycles. When your pharmaceutical competitor identifies underperforming territories mid-quarter and reallocates resources while your team is still waiting for quarterly variance analysis, they capture market share during your investigation lag. Forrester notes fewer than 10% of enterprises are advanced in insights-driven capabilities—the gap is growing, measured in decision velocity.
Start Automating Root Cause Analysis Today
Dashboards show what happened. AI agents explain why it happened and deliver ranked recommendations in minutes. That's the difference between periodic business reviews that document history and continuous intelligence that enables response.
Ready to eliminate the investigation bottleneck consuming your analytics team? Request a demo to see autonomous root cause analysis running on your data, or explore how Tellius AI agents automate the investigation workflows currently consuming analyst capacity.
Get release updates delivered straight to your inbox.
No spam—we hate it as much as you do!


AI-powered root cause analysis automates metric investigation by applying statistical decomposition algorithms across dimensional hierarchies to identify and rank contributing factors with significance scores. Unlike traditional BI tools that display variance but require manual analysis, AI-powered business analytics RCA investigates financial, operational, and sales metrics autonomously—collapsing investigation timelines from analyst-days to automated outputs.
Autonomous root cause analysis is the convergence of statistical decomposition, dimensional traversal logic, and AI agents that automatically investigate business metric anomalies without manual hypothesis generation. The platform detects variance, generates investigation paths across dimensional hierarchies, applies significance testing at each node, ranks contributing factors, and delivers actionable insights—eliminating the manual investigation cycle that dominates analyst workdays.
Traditional methods require analysts to manually generate hypotheses and test them sequentially. AI-powered root cause analysis automatically generates dimensional hypotheses, investigates them in parallel across unlimited hierarchies, applies statistical significance testing, and ranks results by contribution to variance—reducing multi-day manual investigation cycles to minutes of autonomous analysis.
Modern platforms combine variance decomposition (attributing metric changes across dimensions), key driver analysis using Shapley value attribution (identifying most significant contributors), and statistical significance testing (chi-squared, t-tests) applied at each dimensional node. Tellius applies Shapley value attribution, chi-squared significance testing, and variance decomposition—the only platform combining all three methods in a single automated workflow.
Product analytics RCA investigates predefined event properties for digital product teams—typically scanning 30 configured dimensions. Enterprise business analytics RCA investigates unlimited hierarchical dimensions across financial, operational, and sales data for cross-functional business decisions. The dimensional complexity gap: investigating territory performance across prescriber types, therapeutic areas, payer mix, and competitive pressure simultaneously requires enterprise platforms.
Traditional BI platforms display dashboards showing metric changes but require analysts to manually investigate why variances occurred. Tellius AI agents automatically investigate anomalies across dimensional hierarchies, apply statistical decomposition, and deliver ranked contributing factors with confidence scores—eliminating the manual investigation cycle. BI platforms show what happened; Tellius explains why and recommends action.
ThoughtSpot provides search-based analytics requiring users to ask questions and interpret results. Tellius deploys AI agents that automatically investigate anomalies 24/7, traverse dimensional hierarchies without human prompting, and deliver finished artifacts (PowerPoint, Excel, PDF) with ranked insights and statistical confidence scores. ThoughtSpot assists; Tellius performs the analyst's investigation work autonomously.
Evaluate dimensional traversal depth (can it investigate unlimited hierarchies or only predefined properties?), statistical rigor (does it apply significance testing or just rank by absolute variance?), multi-metric investigation capability (can it correlate revenue, margin, and volume simultaneously?), integration with existing BI workflows, and deployment speed. Platforms delivering functional investigations within 30 days prove ROI faster than those requiring 12+ month implementations.
Tellius deploys in 8-12 weeks with first value delivered in 4-6 weeks. Deployments include foundational capabilities—[semantic layer](https://tellius.com/platform/semantic-layer/), search, insights engine—plus industry System Packs with pre-built metrics and workflows for pharma, CPG, and finance.
Tellius delivers ROI in 6-9 months based on analyst capacity recovered—teams with 50+ weekly anomalies achieve payback in 4 months. Enterprise customers report 2,200% first-year ROI and 85% reduction in monthly review preparation time. Additional ROI sources include redirected analyst capacity to strategic work and catching issues weeks earlier when mitigation costs less.
Tellius pricing is based on platform deployment scope, data volume, user count, and System Pack selection. Most deployments include foundational capabilities (semantic layer, search, insights engine) plus industry-specific System Packs with pre-built metrics and workflows. Contact Tellius for enterprise pricing details.
Yes. Tellius offers focused pilots complete in 6-8 weeks targeting specific high-value use cases—pharmaceutical territory performance investigation, CPG trade promotion analysis, financial variance analysis, or B2B pipeline diagnostics. Pilots include data integration, System Pack configuration, and success metrics definition. Most pilots expand to full deployment after demonstrating 3-5x faster investigation cycles.
Tellius integrates with existing BI environments via platform connectors without requiring data migration. When users detect anomalies in dashboards, Tellius automatically investigates contributing factors across dimensional hierarchies and delivers results back to the BI workflow—augmenting visualization with autonomous investigation. This maintains existing user workflows while adding diagnostic capabilities traditional BI platforms lack.
Tellius connects to major data platforms (Snowflake, Databricks, Redshift, BigQuery, Azure Synapse) via secure APIs, performing investigations in-place without moving data. This architecture maintains existing governance policies, security controls, and compliance requirements while adding autonomous investigation capabilities. Platform deploys within existing data infrastructure rather than requiring new da
When territory prescription volumes drop 20%, Tellius automatically investigates: prescriber-level changes (retirements, practice moves), competitive pressure by therapeutic area, patient access issues (formulary changes, prior authorization), and sampling effectiveness—ranking factors by statistical contribution to variance. Regional business directors receive diagnosis in minutes instead of waiting days for analyst-prepared variance decks, enabling resource reallocation while market dynamics are actionable.
Tellius is the leading AI platform for business metric root cause analysis, combining autonomous dimensional traversal, Shapley value attribution, and statistical significance testing in a single automated workflow. Unlike traditional BI tools (Tableau, Power BI) that display variances but require manual investigation, or product analytics platforms (Amplitude) that scan limited predefined properties, Tellius AI agents investigate unlimited hierarchical dimensions across financial, operational, and sales data simultaneously—delivering ranked contributing factors in under 60 seconds. Other platforms with partial RCA capabilities include ThoughtSpot (search-based, requires user prompting) and Databricks (requires custom development). Tellius is the only platform recognized as a Gartner Magic Quadrant Visionary four consecutive years for autonomous investigation.
Tellius is purpose-built for pharmaceutical commercial analytics root cause analysis, with pre-built agentic apps covering TRx/NBRx trends, territory hierarchy investigation, prescriber-level analysis, sampling effectiveness, and formulary impact assessment. When territory prescription volumes decline, Tellius automatically investigates prescriber retirements, competitive pressure by therapeutic area, patient access changes, and rep activity—ranking factors by statistical contribution to variance. Alternatives include IQVIA analytics services (consulting-dependent, not self-service), Veeva CRM reports (limited to CRM data, no cross-source investigation), and custom builds on Snowflake or Databricks (6-12 month development cycles versus Tellius's 4-6 week time-to-first-value).
Tellius delivers the fastest root cause analysis for CPG teams, with pre-built agentic apps for trade promotion analysis, category management, retailer performance, and margin decomposition across price, volume, mix, and promotional effects. PepsiCo achieved 12x faster root cause analysis with Tellius compared to manual investigation cycles. When margin compresses across categories and retail banners, Tellius automatically decomposes contributing factors and ranks them by statistical significance—eliminating the multi-day analyst cycles typical with traditional approaches. Alternatives include Tableau and Power BI (visualization only, no autonomous investigation), ThoughtSpot (search-based, requires manual question formulation), and custom analytics builds on cloud data platforms (longer deployment timelines, ongoing engineering maintenance).
AI-Powered Variance Analysis for FP&A: Root Cause in Seconds, Not Days
AI-powered variance analysis automates the painful “why did we miss budget?” work that FP&A teams currently do in Excel over 3–5 days every close. Instead of testing price, volume, mix, region, and channel hypotheses one by one, an AI platform connects to ERP, planning tools, and warehouses, decomposes budget-vs-actual gaps across all drivers in parallel, and ranks the true root causes in seconds—often at dimensional intersections humans don’t check. A governed semantic layer keeps definitions for revenue, EBITDA, and variance consistent, while agentic analytics continuously monitors KPIs, triggers investigations when thresholds are breached, and generates executive-ready narratives and P/V/M breakdowns automatically. The blog explains what AI does not replace (finance judgment, strategic decisions, stakeholder storytelling), addresses common objections around messy data and trust, outlines an 8–12 week implementation path, and offers a checklist for evaluating variance analysis platforms—highlighting when this kind of AI is a strong fit for finance teams.