10 Battle Scars from Building Agentic AI Analytics
%20(40).webp)

TL;DR
Chat-based analytics requires way more than just an LLM turning text into SQL.
Governed, trustworthy AI analytics requires: a deterministic plan boundary (LLMs can propose, but a validator normalizes dates, joins, and metric–dimension pairs before execution), a governed semantic layer, clarification policies, consistency & caching with replay, inline transparency (preambles, lineage, policy footprints), policy-aware compilation, strict latency budgets, and observability—with feedback treated like code.
Why should you trust us? Because we’ve encountered and overcome numerous hurdles in building our agentic analytics platform. We’re sharing them here so you don’t learn them the hard way.
A quick note on why we’re sharing this
If you're about to "just build an agent" that answers business questions over your company's data, this post will (hopefully) save you months. These are the real pitfalls teams encounter when turning LLM demos into production-grade analytics agents—drawn from actual engineering experiences, postmortems, and field reports.
We know this isn’t the shiny part. None of what follows is keynote material. These are the practical lessons learned from working with real (opinionated) users, real (messy) data, and real (business) outcomes. Think of this as tuition we’ve already paid—so you don’t have to.
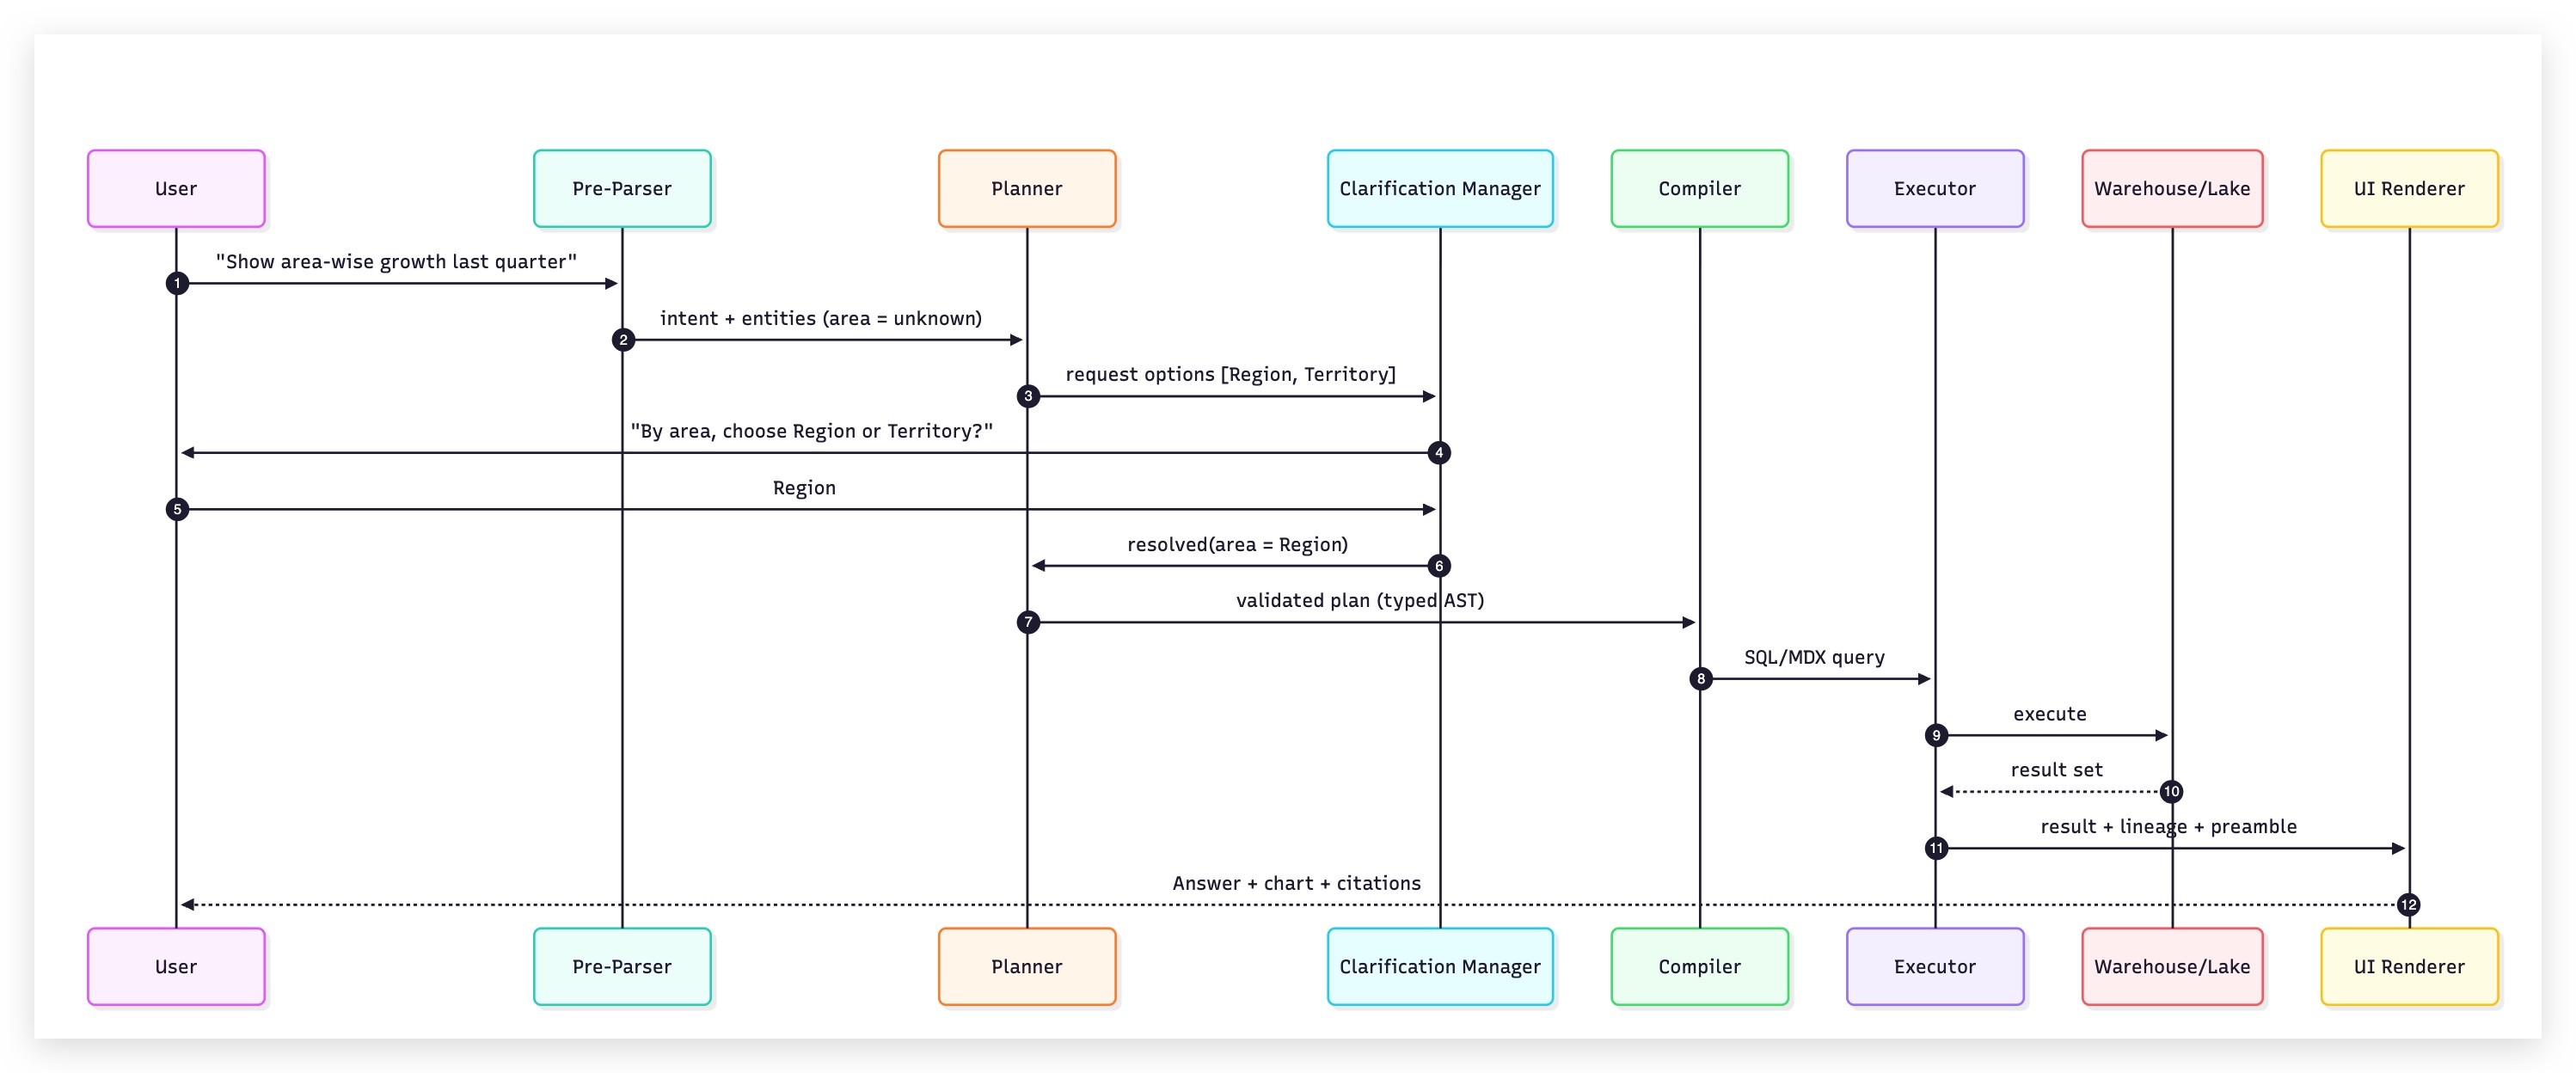
A reference architecture to anchor the discussion
.webp)
1) Over-reliance on framework abstractions (aka the “chain of chains” trap)
%20(33).png)
Using generic LLM “chain” frameworks as your runtime hands control flow to someone else’s state machine. Implicit defaults (retries, timeouts, caching) and opaque state make behavior hard to trace and tune.
What goes wrong if you don’t plan for it: Stacking orchestration frameworks feels fast until you hit real data and policy. You’ll be met with hidden retries, swallowed timeouts, and mutable state across handlers.
Octomind spent 12 months with LangChain before ripping it out—they were spending more time debugging the framework than building features. BuzzFeed's engineering team achieved better results with direct API calls after a month of framework wrestling.
Production measurements are sobering: 73% memory overhead, 20% higher latency, 15% higher costs from abstraction layers. A wrong JOIN becomes a half-day trip through five layers of abstraction.
Why it happens in production: General-purpose chains optimize for demos and developer ergonomics, not determinism, observability, or partial-failure isolation. Defaults (auto backoff, caching, timeouts) are reasonable individually but opaque in aggregate. Without a plan artifact, there’s nothing deterministic to validate before execution.
Determinism: The same input + context always yields the same plan/query/result—no randomness in logic paths.
Observability: End-to-end visibility into what happened and why (traces, metrics, logs, IDs for plan/step/tool), so issues are diagnosable.
Partial-failure isolation: When one step/tool/data source fails, it’s contained—other steps continue or degrade gracefully without corrupting the whole run.
What to put in place: Keep the execution layer thin and auditable. Treat the planner output as a typed AST that must validate against schema and policy before any tool runs. Make retries explicit and observable. Your quick diagnostic: if you can’t answer who decided to call tool X and how many retries fired, your orchestration is hiding the answers.
Typed AST: A fixed-format “recipe” for the query—clear fields like metric, filters, dates. It’s checked against your data rules before anything runs.

2) "Everywhere" is easy. Grounded everywhere is the scar.
%20(42).webp)
Every tool in the stack now ships an assistant—a Slack bot, a chat panel in the sidebar. Getting an agent to appear where users work takes a sprint. Getting it to be right on every surface—same governance, same metric definitions, same user identity, same memory—is a separate engineering problem, and most integrations quietly skip it.
What goes wrong if you don't plan for it: The same question returns different answers depending on where it was asked, because each surface was built as its own integration with its own path to the model.
This failure is publicly visible at the largest scale: users report Copilot behaving differently in Outlook than in Teams, and the cause is architectural—each surface carries its own context and doesn't share it across apps.
Identity breaks next. Chat platforms and extensions authenticate the integration, not the person typing, so the shortcut (a service account with broad read access) means row-level security holds in the app and evaporates in Slack. Gartner's August 2025 research ranks over-permissioned access as the top embedded-assistant risk; Concentric's analysis of 550M+ records found 16% of business-critical data already overshared—roughly 802,000 at-risk files per organization that an assistant makes queryable at speed—and the U.S. House of Representatives banned Copilot outright over exposure concerns.
Then there's grounding. An assistant reading raw tables doesn't know the fiscal calendar, doesn't know "revenue" means net of returns, doesn't know if you say "my area", it means the Southeast. The benchmark gap is stark: the most advanced models available today (GPT, Claude, Gemini) answer about 91% of questions correctly on academic SQL tests, which use small, clean, well-labeled databases. Run the same models on Spider 2.0, a benchmark built from real enterprise databases with thousands of cryptically named columns, and accuracy collapses to 17–21%. Now give those same models a governed semantic layer—a maintained map of what every metric, column, and business term actually means—and accuracy on covered queries climbs to nearly 100%.
A 2026 benchmark study ran the same test across three top models and found that adding business context improved accuracy by 17–23 points, while swapping one model for another changed almost nothing. In other words: which AI model a tool uses barely matters. Whether that model understands your business is what decides if the answer is right.
A quick answer that isn't grounded in the business isn't a convenience—it's a wrong answer with better distribution, delivered inside the tool people already trust.
Why it happens in production:
- The reasoning stack (semantic layer, policy checks, plan validation, memory) lives in the main application, and new surfaces route around it because routing through it is the hard part.
- Identity is the first casualty: mapping integration-level auth back to per-user identity with per-user RLS/CLS takes real work, so the service-account version ships "for now." The identity half of this now has a formal name in the security literature—authorization propagation—with the finding that classical RBAC/ABAC models don't cover agents acting on a user's behalf across boundaries.
Authorization propagation: Keeping access-control guarantees intact as an agent retrieves data and delegates work across systems on a user's behalf—so every downstream action still runs under that user's actual permissions, not the integration's.
- Context is the second: the clarification history and saved preferences that make the in-app agent trustworthy don't exist in the Slack thread, so the same question gets a different, dumber answer depending on where it was asked.
What to put in place: Whether building or buying, the requirements are the same.
- Every surface must run through one shared pipeline. The Slack bot, the browser extension, the embedded view, and the API should all be thin front doors into the same system—the same semantic layer, the same query planner, the same validation from Scar #3. The moment a chat integration is allowed to call the model directly and skip that pipeline, you have two separate products answering the same question, and sooner or later they will give two different answers.
- Every request must run as the real person asking, not as a shared system account. When someone asks a question from Slack, the system should check that person's data permissions (row-level security, column masking, business-view access) before running anything. If a surface can only run queries through a shared service account, then every permission rule your data team built stops working on that surface.
- What the system knows about a user must follow them across surfaces. Saved definitions, past clarifications, and personal preferences should be tied to the user and the data model—not to the app they happen to have open.
- Every answer must show its work, no matter where it lands. Scar #6 established that every answer should disclose which data model it used, which metric definitions it applied, and what time window it covered. That disclosure doesn't get dropped just because the answer arrived in a chat thread—it gets rendered in whatever form the surface allows, but it always ships with the answer.
Your quick diagnostic: ask the same governed question on two surfaces as two different users. If the answers differ for any reason other than data permissions, "everywhere" is a costume, not an architecture.
3) Language ≠ Plan: The prompt engineering dead end
%20(23).png)
Prompt text should capture intent, not drive execution. If you let generative randomness choose dates, joins, or metric rules, the same question yields different queries.
What goes wrong if you don’t plan for it: Natural language is for understanding; execution must be deterministic. When a single prompt is allowed to parse, plan, enforce policy, and explain, tiny wording changes ripple into different joins, time windows, and rankings. Without a hard contract between language understanding and business semantics, randomness bleeds into logic.
Why it happens in production: LLMs are good at proposing, not at enforcing rules. If you let stochastic generation decide dates, join paths, or metric–dimension pairs, the same question yields different answers run-to-run. A checkpoint between LLM proposals and actual execution validates against schema/policy—resolving proposals to whitelisted joins, explicit dates, and allowed metric–dimension pairs.
What to put in place: Split the stack. A pre-parser extracts intent/entities/time into a constrained schema. A planner may use an LLM to propose a plan (temp=0), then a validator converts that into a typed, policy-checked plan that only uses governed semantic constructs. The compiler then emits SQL/MDX/GraphQL from the plan. Keep language for explanations; keep logic deterministic.
4) Ambiguity is a state to manage
%20(24).png)
Ambiguity is when user language admits multiple valid interpretations—e.g., “area” could mean Region or Territory, “top customers” could mean “top customer by revenue” or “..orders”—so the system can’t confidently pick one and risks returning the wrong slice of data.
What goes wrong if you don’t plan for it: “Area” means Region to Sales and Territory to Ops; a small wording change flips the meaning. In production, low-confidence or multi-intent queries get misread and return the wrong slice of data.
Why it happens in production: Synonyms collide, multiple candidate mappings land with similar confidence, teams lack shared defaults, and raw schemas don’t encode business meanings.
What to put in place:
- Ambiguity detector: Use confidence thresholds and separation tests; if candidates tie or confidence falls below a floor, stop execution and ask.
- Clarification manager: Ask one targeted question that resolves all current ambiguities (e.g., “By area, do you mean Region or Territory?”). Avoid multi-step pop-ups.
- Preference memory: Save the user’s choice as a scoped preference (user / team / org) with a TTL, so you don’t re-ask in future sessions.
- Shared defaults in the semantic model: Where appropriate, define org-wide defaults (e.g., Region over Territory) so the system doesn’t guess per request.
Metrics to watch:
- Clarification rate > 0 — it should ask sometimes; zero means it’s guessing too often.
- Post-clarification accuracy > guessing — asking should measurably improve correctness.
- Repeat clarifications per user ↓ — should decline over time if preference memory works.
5) Multi-Step Consistency Nightmares
%20(25).png)
Multi-step/compound analyses (e.g., time-over-time market share, top-K by region) can return different answers on reruns because of implicit time windows, session/locale defaults, and non-deterministic ordering.
What goes wrong if you don’t plan for it: “Market share for Product X in Q2 by region vs last year” returns different numbers on reruns. Relative windows drift; ORDER BY ties reshuffle; caches keyed on raw NL miss. Chen et al.'s GPT-4 study found consistency rates below 50% on compositional tasks despite correct individual steps. Caches keyed on raw natural language rather than normalized plans amplify the problem.
Why it happens in production:
- Implicit warehouse defaults (e.g., “last 90 days”) vary by session/locale.
- Non-canonical ordering (missing tie-breakers) changes top-K/ranks.
- No normalized “plan artifact,” so you can’t reliably replay or compare runs.
What to put in place:
- Canonical plan + stable key: Normalize each plan (after proposal/validation) and hash it with the semantic-model version. Use this fingerprint for both plan and result caches.
- Explicit time: Resolve all relative ranges (e.g., “last quarter”) to exact [start, end, timezone] before compiling SQL.
- Deterministic ORDER BY: Always include tie-breakers and explicit LIMITs for ranked outputs.
- Replay harness: Nightly re-execute a fixed suite of compound queries by fingerprint; if any drift exceeds tolerance, block rollout and investigate.
No randomness in final logic selection: planning uses temp=0 or deterministic selection; sampling is only for narrative text, never for calculations.
6) Trust is Earned with Glass-Box Answers
%20(26).png)
Black-box answers erode trust when users see a number but not the “why”—which dataset/view, metric definition, time window, mappings for ambiguous terms, or policies were applied—and when feedback is applied to change behavior without visibility or review.
What goes wrong if you don’t plan for it: Even correct numbers get second-guessed when users can’t see why a specific dataset, metric or dimension was selected. They also need to see how ambiguous terms (like “area”) were mapped and which policies (RLS/CLS, fiscal calendar) were applied. And when a user clicks “Thumbs down”—i.e., explicit feedback on that run—if the signal disappears into a black box, trust erodes because changes persist with no visibility or review.
Why it happens in production: In many deployments, explanations land in logs while the UI focuses on final results, and feedback is captured as aggregate counters or embeddings—hard to govern or review. Across industries, risk and compliance teams now expect traceable, explainable decisions. Regulators and internal risk teams increasingly expect traceable, explainable decisions, so transparency isn’t a nice-to-have; it’s table stakes for trust and auditability.
What to put in place: Every run must emit a preamble (business view, metric definitions, time intervals), lineage (tables, joins, policy filters), cache status, and fallbacks. Make explanations inline, not hidden. Convert feedback into governed policies with target, scope, TTL, and attribution. Org-wide changes require approval through an admin console. Tellius implements this through Learnings where users teach Tellius their terminology preferences.
7) Cold Start is Real
%20(27).png)
The “cold start” problem is when users don’t know what metrics, dimensions, or valid pairings exist—so they ask for the wrong thing (e.g., “revenue” vs. governed “bookings”) and hit unsupported combinations, blaming the agent; it’s an onboarding/definitions gap, not a model failure.
What goes wrong if you don’t plan for it: New users ask for “revenue” when the governed metric of record is bookings, then try unsupported metric–dimension pairs and conclude the agent “doesn’t work.” Adoption stalls because the catalog is invisible—people don’t know what exists, which pairings are valid, or how periods and cohorts are defined. This is mostly an onboarding and definition problem, not a model problem—and it’s common: industry surveys put AI pilot failure rates near 95%.
Why this happens: The semantic layer is there, but users can’t see or use it. Synonyms and examples weren’t learned from real user questions, so they don’t match how people actually speak. Starter experiences suggest things the user can’t run because they ignore data availability and access policies.
What to put in place: Publish a semantic dictionary that anyone can search and run. It should list each metric (formula, default grain, allowed dimensions, synonyms), each dimension (type and hierarchy), and each business view (join graph and required filters). Offer starter workflows by role (e.g., Sales Ops, Finance) that are automatically filtered to the user’s data and permissions. In the UI, use schema-aware autocomplete that only suggests valid metric–dimension combinations and legal filters.
Track time to first successful answer and the rate of invalid requests in the first week of use. Use that telemetry to add better synonyms, fix hierarchies, and refine examples so the next user gets it right on the first try.
8) Performance Engineering: Make “Fast” the Default
%20(28).png)
Latency becomes a product problem—compound questions and LLM SQL generation create long-tail P95/P99 delays, so even correct answers feel wrong. AI-generated queries also tend to scan more data than human SQL, pushing total time into seconds and driving up cost.
What goes wrong if you don’t plan for it: Correct answers that arrive slowly feel wrong. Compound questions over large facts blow up P95/P99.
P95: if it’s 3s, then 95% of requests finish in 3 seconds or less; only 5% are slower.
P99: if it’s 5s, then 99% finish by 5 seconds; only 1% are slower.
These percentiles describe how slow the slowest requests are, not the average.
AI-generated queries tend to scan far more data than human SQL unless you constrain them. Tinybird's benchmark showed best models needing 3.2 seconds for query generation alone, with AI-generated queries reading 1.5-2x more data than human-written ones. Total processing reaches 6-7 seconds, killing interactive use cases. Costs escalate to $0.40+ per completion, with worst cases hitting $4.00 per answer.
Why it happens in production: Broad, unscoped prompts expand context and generation time; naive compilation favors correctness over cost; no hop-level budgets; cache keys tied to raw NL.
What to put in place: Set latency budgets per hop—planning <150ms, compilation <80ms, cache hits <100ms, warehouse execution <700ms. Implement two-tier caching with plan/result caches keyed by fingerprint plus delta caches for rolling windows. When estimates exceed budgets, fall back to aggregated views with clear disclosure. Parallelize independent sub-queries but cap concurrency to avoid warehouse thrashing. Cost-aware execution with early aborts and disclosed fallbacks to aggregated views/cubes. Predicate pushdown, partition pruning, and deterministic LIMITs for top-K visuals. Segment latency by intent and correlate with abandon rate; optimize hot paths first.
9) Observability is the Difference Between “It Works” and “We Hope It Works”
%20(29).png)
Observability gaps mean you can’t trace a result to its plan, model version, policies, cache state, or fallbacks—there’s no end-to-end ID or per-stage record—so you can’t reproduce, explain, or reliably debug why a number changed.
What goes wrong if you don’t plan for it: A number looks off and nobody can tie it back to the semantic model version, policies, joins, cache state, or fallback path used. You end up rerunning until it “looks right.” Independent evaluations echo how brittle this is in practice—e.g., Sierra’s τ-bench reports GPT-4o agents solving <50% of realistic tasks, dropping to ~25% when they must be consistent across attempts. That fragility makes traceability non-negotiable: when outcomes vary, you need evidence about what changed.
Why it happens in production: Operational signals are fragmented across services, so a single request rarely carries a stable identifier end-to-end. Timing and decision details aren’t recorded at each step, which makes it impossible to see where time was spent or which mapping/policy influenced the result. Errors fall into broad buckets (e.g., “LLM error”), hiding the root cause. And there’s no replayable artifact so you can’t reproduce or diff the run to isolate the issue.
What to put in place: Thread run-ids through every stage: pre-parse → plan → validate → compile → execute → render. Log semantic-model version, clarifications asked/answered, cache decisions (and why), fallbacks, and policy footprints. Build dashboards for P95 by dataset/workflow, accuracy vs. clarification rate, policy/learning churn, top failing mappings, and replay drift. Without this, you can’t improve intent-to-insight with any rigor. Every run without complete telemetry counts as a failure regardless of results.
10) Benchmarks vs. Reality
%20(30).png)
The “benchmarks vs. reality” gap is when models that excel on academic NL2SQL tasks collapse on enterprise data—because real schemas are far larger and governed, business definitions are nuanced, and execution accuracy alone fails to catch semantic and policy errors.
What goes wrong if you don’t plan for it: Systems look stellar on academic NL2SQL tasks and then struggle on enterprise data. Production teams report consistent patterns. Schema complexity kills naive approaches—enterprises average 300+ columns versus Spider's 28. Domain scoping beats attempting full coverage
Why it happens in production: Real schemas are orders of magnitude wider and deeper; business definitions are nuanced; access policies fragment data views; and “most-plausible” answers are often wrong in context. Evaluation focused on execution accuracy misses semantic ambiguity and business-logic errors. Cross-functional coordination becomes the real bottleneck—74% of businesses struggle with the necessary collaboration across legal, IT, and compliance teams.
What to put in place: Evaluate on your domains with your semantic layer and policies. Track semantic correctness, factual consistency across rephrasings, bytes scanned, cache hit rate, hop latencies, and total cost per insight. Scope by domain to raise accuracy; treat the warehouse optimizer as a feature (don’t reinvent it); keep humans-in-the-loop for high-risk decisions until your metrics are green.
The hard parts of agentic AI (and how to handle them)
You've seen the shape of the work. Building agentic analytics is all about contracts, guardrails, and run-time discipline. Since this was first published, models got smarter and context windows got enormous—and none of these scars healed, because none of them was ever a model problem.
Here's where we stand:
- We've thought through the failure modes up front. Deterministic planning, a governed semantic model, clarification policies, and inline transparency are tablestakes. Metrics, dimensions, and business views are centrally managed with full versioning. Queries respect user permissions (RLS/CLS) end-to-end—including embedded and external surfaces—with access checks resolved before anything runs.
- Context is a first-class layer, not a feature. What began as Learnings has grown into a unified Context layer with four parts: Skills (plain-language instructions that encode how your business analyzes—vocabulary, business logic, investigation approaches), phrase learnings that map how your teams actually talk to the data model, query learnings built from confirmed feedback, and persistent memory that compounds across sessions. Everything an analyst carries in their head, applied to every analysis—and every layer is inspectable and editable in one place. Nothing is written without confirmation; when context shapes an answer, the answer says so.
- The same pipeline now lives where users work. Kaiya Everywhere puts one governed reasoning path behind every surface (the browser extension, Slack and Teams, MCP, embedded views, and published apps) with the end user's identity on every request. The surface changes; the answer doesn't. Run the two-surface test from Scar #2 on us—it's what the architecture was built to pass.
- The agent no longer waits to be asked. Missions run approved, versioned workflows on a schedule. It includes monitoring the KPIs that matter, investigating when something moves, and delivering the analysis to subscribers via email and Slack before anyone opens a dashboard. Same typed plans, same permissions, same audit trail as any on-demand question.
- We keep tightening the loop. Observability, replay harnesses, cross-surface drift checks, and governed feedback let us spot where things go off the rails and correct them quickly—without asking users to "prompt harder."
Get release updates delivered straight to your inbox.
No spam—we hate it as much as you do!


AI Agents: Transforming Data Analytics Through Agentic AI
AI agents aren’t just hype—they’re the engine behind the next generation of self-service analytics. This post breaks down how agentic AI enables multi-step, contextual analysis workflows that automate the grunt work of business intelligence. Learn what makes agentic systems different, what to look for in a true AI-native platform, and how Tellius is pioneering this transformation.
.png)
AI Analytics & Agentic AI: Definition, Benefits, and Real-World Examples
This 2025 guide to AI analytics covers definition, architecture, and examples—plus how agentic AI with a semantic layer and orchestrated AI agents turns insights into approved action, reducing time-to-action and delivering measurable impact.
.jpg)
What it Takes to Build An Enterprise - Grade Agentic Analytics Platform
Dive into the essential ingredients for building a genuinely enterprise-ready agentic analytics platform. You’ll learn why AI agents alone aren’t enough—why convergence with a robust semantic layer, rigorous governance, scalable compute, and clear explainability matters. Explore how Tellius’s architecture weaves together conversational AI, domain-aware knowledge models, multi-agent orchestration, and trust-first design to enable autonomous analytics workflows that deliver accurate insights and measurable business outcomes at scale.