A Roadmap to Self-Service Analytics, Informed by Self-Driving Cars

In This Post
- The value of self-service analytics
- The evolving definition of self-service analytics
- Self-driving and self-service analytics
- Key requirements for next-level self-service
- The maturing self-service analytics organization
- Conclusion
The value of self-service analytics
The concept of self-service analytics has been around for a long time and has changed substantially in that time. Initially, the concept was defined by opening dashboard access to more than just executives and decision-makers. A more cynical person might suggest that this initial introduction was entirely a marketing strategy to push more licenses for a business intelligence platform, opening questions as to the value of the overall strategy. However, as technology has progressed, the concept and value of self-service analytics have also evolved.
There can be a lot of value in an organization-wide self-service analytics strategy. Organizations that center analytics creation on data analysts with business users also having tools to search, create, and share dashboards will achieve a faster time to insight, allowing for quicker time to action on mission-critical business problems. By providing domain-specific data analysts and business users with more advanced analytics tools, organizations can leverage these subject matter experts to generate unique insights to domain-specific problems. In addition, unburdening the data engineering team from mundane tasks like data preparation and dashboard creation will help unlock organizational efficiencies. These efficiencies will drive better data quality and increase sharing of best practices from the data engineering organization. There’s tremendous potential value in a self-service analytics initiative; however, the amount of value unlocked will largely depend on the type of tools leveraged in your data architecture.
The evolving definition of self-service analytics
Today, the definition of self-service analytics varies depending on the role of the person you are asking, as well as the organization they work for. At the baseline today, self-service analytics means providing business users with the ability to create their own reports with simple point-and-click interfaces. However, some more data-driven organizations with higher analytics priorities might also include in that definition additional modern advanced analytics capabilities. These capabilities can include using natural language to query data, generating automated insights from data with a simple click, and leveraging low/no-code data preparation tools.
Gartner defines self-service analytics as a form of business intelligence (BI) in which line-of-business professionals are enabled and encouraged to perform queries and generate reports on their own, with nominal IT support. Gartner continues suggesting that self-service analytics is often characterized by simple-to-use BI tools with basic analytic capabilities and an underlying data model that has been simplified or scaled down for ease of understanding and straightforward data access.
The many definitions of self-service analytics have generated confusion over the term and a conversation about the potential applications, value derived from these initiatives, and the future of the concept. It’s a great, healthy conversation to have in a growing analytics marketplace as more and more institutions scale their data initiatives across their organizations. The capabilities of analytics and business intelligence tools will range broadly depending on the goal of your self-service initiative. The question arising is how do buyers evaluate data platforms designed for self-service analytics? What are the necessary features in an analytics or business intelligence platform that provide more value in a self-service strategy?
Self-driving and self-service analytics
Much like the definition of self-service analytics, there’s confusion today in the self-driving car space around what exactly defines “self-driving.” Depending on who you ask at Tesla, Autopilot is either a self-driving tool or an advanced driver assistance system. Today, Autopilot is used as an enhanced cruise control mechanism, essentially matching your speed with the speed of traffic, and assisting with steering in situations where lanes are clearly marked. At a future stage, Autopilot will take over the task of driving completely for you. At the full self-driving stage, you will not need to place your hands on the wheel or your feet on the accelerator/brake pedals. And yet, some Tesla advertisements and investor calls might suggest that full self-driving capabilities are already here.
Fortunately, SAE International has already defined the levels of self-driving cars to clear any ambiguity surrounding the concept. SAE International, formerly named the Society of Automotive Engineers, is a standards-developing organization for engineering professionals in various industries with an emphasis placed on global transport industries such as aerospace, automotive, and commercial vehicles. The organization has defined six levels (0-5) of Self-Driving Car Automation. The levels range from 0, which is defined as having no driving automation technology, to 5, which is defined as a vehicle driving itself anywhere with zero human interaction. While at level 0, cars may appear largely as they do today, at level 5, cars may not have a steering wheel, accelerator, or brake. In between the levels are various steps in how the industry will most likely get to fully automated self-driving cars.
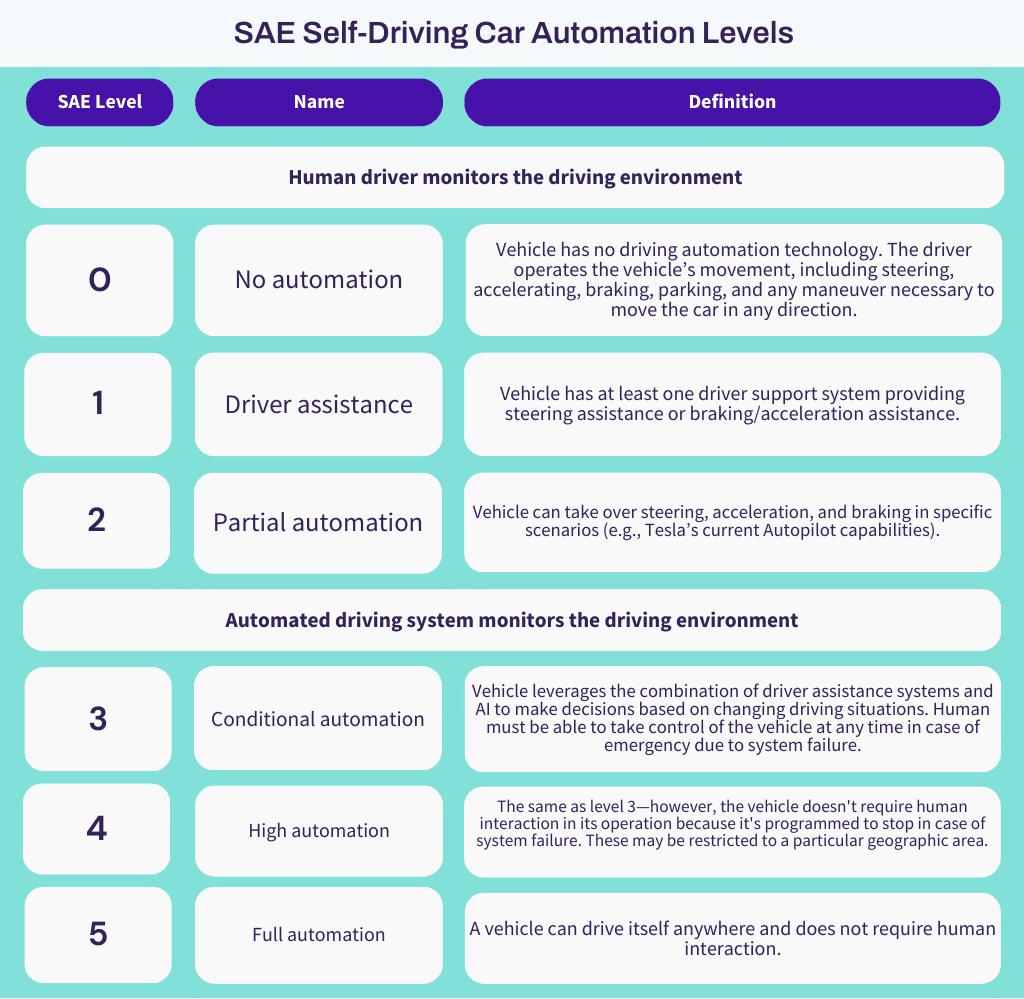
The reason why it’s important to have a standard of self-driving automation is simply that many different manufacturers are currently trying to claim full self-driving capabilities in their marketing, and having an industry definition for self-driving automation allows consumers to understand the key capabilities necessary to achieve their desired end goal. As we mentioned in the above table, Tesla branded their self-driving capabilities as Autopilot, which may be confusing to end buyers. The word “autopilot” comes from a system of piloting an airplane without the intervention of the pilot, whereas Tesla’s current Autopilot capabilities can only take over steering and acceleration/braking in very specific scenarios. In addition, Tesla requires humans to monitor the environment and be able to take over driving at a moment’s notice.
We could use SAE International’s Self-Driving Car Automation Levels methodology to inform new levels of self-service analytics. Much like the Self-Driving Car Automation Levels, self-service analytics is defined by how much automation is done within the platform to help augment the user’s (driver’s) capabilities to analyze (drive). And again, much like the Self-Driving Levels, many business intelligence and analytics providers use a varied definition of self-service analytics in their marketing. Defining levels of self-service analytics can help clear up the analytics buyer’s confusion over the potential value delivered by a self-service analytics platform.
While we can take inspiration from SAE’s levels, how do we translate their methodology into a set of requirements for each level of our self-service analytics?
Key requirements for next-level self-service
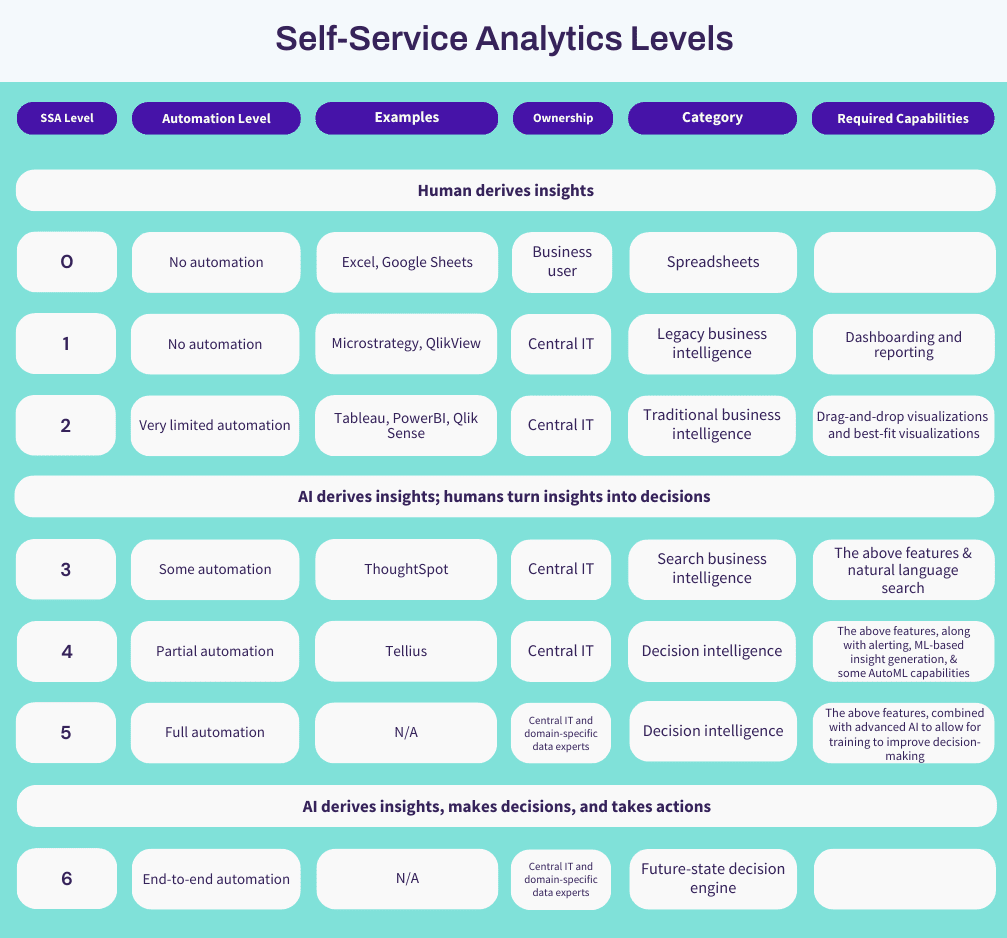
Much like the levels of self-driving cars, the levels of self-service analytics must be informed by the amount of automation available to the user. In our range, we present seven levels of self-service analytics, ranging from highly technical, complex platforms with no automation to a completely autonomous future-state AI decision-making platform. Automation, in the case of analytics, can include natural language search, recommended visualizations, automated insight generation, and more. As you progress through the levels of self-service analytics, you begin opening analytics to less technical users within your organization.
At the lowest level, you’ll find the most popular data analytics tool available today: spreadsheets. When we recently asked a group of chief data and analytics officers what the most popular data tools were in their organizations, there was a near unanimous consensus that Excel was the most frequently used tool. It’s powerful and comes with a ton of capabilities, but it also requires an almost total manual effort to build anything valuable. It also requires a high degree of training when you need to use it for more intensive applications.
The next two levels are your more legacy and traditional business intelligence platforms. The platforms here are defined by their ability to deliver KPIs and visualizations in pixel perfect dashboards and reports. These platforms allow highly technical members of your organization (e.g., data engineers) to do the data preparation and dashboard creation. When you reach level 2, you start to see features to open dashboard creation to data analysts with low-/no-code drag-and-drop features included.
After the second level, some level of automation is starting to be included on the platform. These platforms often include artificial intelligence or machine learning as a means to allow less technical users to begin doing more with data. AI/ML can assist with data preparation, data discovery, insight generation, light data science capabilities, and much more. At this level, you’ll find modern BI platforms with more advanced capabilities, which begin to allow lines of business users to run light data discovery and analysis activities. These features might include visual data pipelining and the use of natural language as a means to explore data.
When we reach the fourth level, we see a shift from business intelligence to decision intelligence. Business intelligence is typically associated with the ability to analyze aggregated data with visualizations typically consumed via dashboards and reports, whereas decision intelligence adds more advanced AI/ML techniques into the mix to help users consume unaggregated data with powerful automation tools. These AI/ML techniques can be used to power features like automated insight generation to understand key drivers behind trends, anomaly detection, cohort analysis, and much more. In addition, the use of AI/ML helps to make more technical users more efficient in their day-to-day operations. Decision intelligence unlocks non-technical members of your organization to acquire valuable insights from your data and helps to modernize your data team.
At the fourth and fifth level, we should begin to see domain- and industry-specific insights being generated on these platforms. There currently are several vendors that provide pharmaceutical and life sciences insights for market access, commercial effectiveness, and much more pre-built into the platform. In addition to pharmaceutical and life sciences-related insights, there are vendors that offer consumer packaged goods, financial, and fintech automated insights. We’ve also seen domain-specific insights for marketing, sales, and more.
As we approach the fifth and six levels of self-service analytics, we see an even greater shift toward the use of AI automation to open data-based insights to everyone in your organization and help to streamline workflows. The use of AI/ML will extend from natural language search and automated insight generation to data preparation/pipelining activities, as well as extend AutoML capabilities, opening data science activities to data analyst and engineer users. The use of large language models (LLMs) to augment users’ workflows will substantially save time on mundane tasks related to data preparation and analysis. LLMs will also be used to power analysis with narratives written around visualizations to help further democratize data across the organization. Even further, LLMs could be used in a ChatGPT-style, allowing for prompt engineering of data discovery, preparation, analysis, and more. These features will help to further enable access to critical insights for more of your team.
The final level of self-service analytics is purely hypothetical today—however, we’ve seen evidence of progress toward the ultimate end goal: a platform that is trained on the business questions to ask, receives an answer, and is able to act on that answer. Even today, some organizations are leveraging platforms that act similarly. A high-frequency trading hedge fund, for example, may use anomaly detection to “ask questions” and when an anomaly is detected, it may trigger a buy/sell based on that information. This may be a simple use case, but as the technology evolves, we will see more “business questions” open to these AI-based techniques. In the future, AI may be used on the fly for optimizing market basket analysis every few hours to automatically uncover cross-sell and upsell opportunities. You may walk to your desk and receive notifications on opportunities for streamlining your supply chain without even thinking about the question. The possibilities are limitless.
The maturing self-service analytics organization
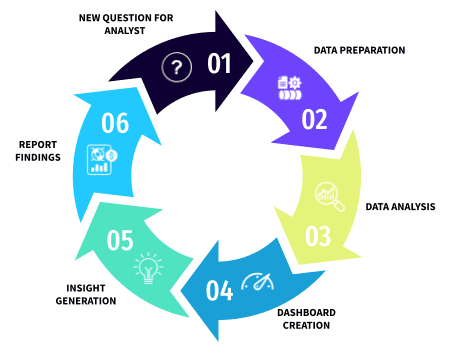
As companies advance through their self-service analytics journey, the paradigm for how best to organize your data analytics teams should evolve to match the technology. Many organizations today approach data analytics with the same mindset as the past two decades. The typical case is as such: The line of business user or executive will have a business question that they pass to the data team, the data team prepares the data and creates a dashboard, the business user reviews the dashboard and has additional questions, and the cycle repeats. There’s a lot of friction in this cycle as line of business domain experts are unable to move at the speed the business requires. Newer technologies have provided the opportunity to change this paradigm to increase business agility and make better decisions faster.
Receiving value from new technologies requires more than just leveraging these new features. It also requires fundamental organizational changes. As an example, natural language search is a feature that was released broadly to the analytics market years ago—however, this feature alone was not able to deliver the value it was initially promised to provide. Natural language search is the ability to use a “Google-like” interface to ask questions of the data instead of using SQL or keywords associated with your column headers. When it’s used alone, you still have the problem of users needing to understand what data is available and how best to visualize the data.
The promise of natural language search is being delivered with the advent of deeper contextual metadata and recommended visualizations. Additions to metadata, like synonyms and descriptions for columns, helps to make natural language search more powerful and opens data access to those in your organization who do not understand the shape of the data. Recommended visualizations provide the right chart type automatically for the business question you have. In addition, the advent of AI-generated narratives and storytelling takes away the complexity of deep analysis. The combination of these four features unlocks a new way to leverage data in your organization. This allows business users to run ad hoc data discovery and analysis instead of the traditional cycle of a data-centric organization.
This type of shift decreases the overall burden on your data team while making your business users more productive. This also shifts the responsibilities of the data team from being data creators to being data curators and keepers of best practices. Gartner is also a proponent of taking this framework further, embedding each business with an analytics franchise. Analytics franchises are essentially a small data team that is responsible for the business group’s data and works with a central data/IT team to understand best practices. These franchises help enable business users with the best approaches for specific business questions.
Conclusion
With widespread technological change over the last 20 years, self-service analytics as a concept is more at the forefront than ever before. The evolution over the last 20 years has been fast and furious, and yet, there’s been no standardization as to what the term means today. The concept to one vendor may mean something completely different to another vendor. Unfortunately, marketing hype coupled with a lack of standardization around the term means technology buyers have to understand the analytics ecosystem deeply or risk missing out on truly transformational progress toward a more data driven strategy. With the number of companies operating in the data analytics industry, staying up to data with the latest vendors, technology, and market trends is truly a monumental task.
Armed with this analogy between the levels of self-service analytics and the self-driving car, we hope to show that there’s a wide range of potential value for self-service analytics initiatives. Some vendors might promise self-service analytics—however, their definition may be many years out of date. We’ve entered a new age where the standard should not be “build your own dashboard” but perform ad hoc exploration and run deep analysis with limited training on the platform of your choice. Get in the driver’s seat and research new technologies with an understanding of the potential available to you in today’s market for self-service analytics.
You can learn more about how Tellius views self-service analytics during our webinar. Sign up today!
Get release updates delivered straight to your inbox.
No spam—we hate it as much as you do!

5 Common Pitfalls to Avoid When Launching a Self-Service Analytics Program
Here are some common pitfalls we've seen for organizations launching a self-serve analytics vision—and how to avoid them to maximize your odds of success.
6 Key Takeaways from the 2023 Gartner Data & Analytics Summit
This year’s Gartner Data & Analytics Summit in Orlando was a jam-packed three days of 220+ sessions, keynotes, and networking opportunities attended by over 4,000 data and analytics leaders and industry experts.

5 Reasons Your Business Intelligence Solution is Failing You
Here are the five obvious and not-so-obvious ways that your BI solution is holding your company back. Who wants to settle for "business as usual?"