Why Did Market Share Decline? The Decomposition Analysis Most Teams Get Wrong

Introduction
Every CPG brand team has heard the question: "Why did share drop?" If you’re anything like most teams, getting an answer takes a week—or longer—to answer. Analysts pull Nielsen data, reconcile with retailer numbers, build decomposition models in Excel, and chase down signals in the noise. By the time leadership gets an explanation, the conversation has moved on and the insight is stale especially in a fast-changing CPG market.
The problem isn't effort. It's methodology. Most share decomposition analyses answer "what changed" without explaining "why it changed" or "what to do about it." They stop at the math and miss the diagnosis.
What is Market Share Decomposition and why does it matter?
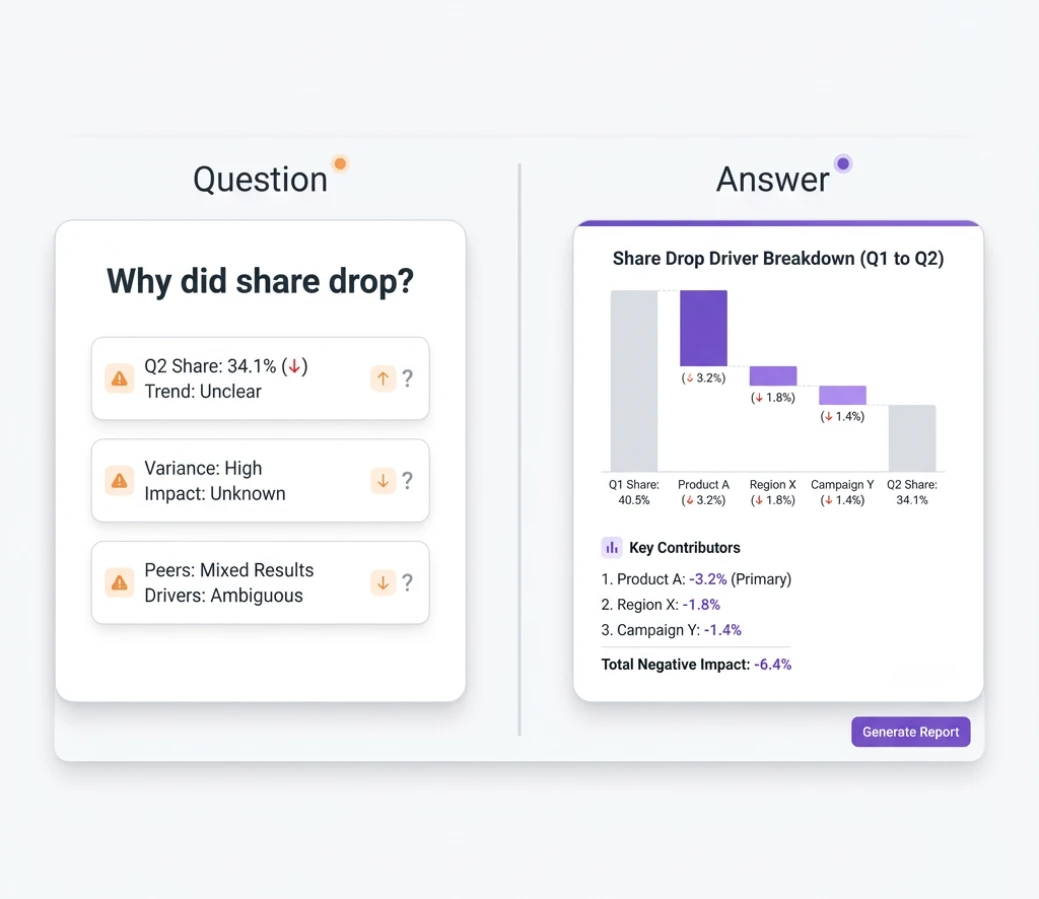
Market share decomposition is an analytical approach that breaks down total share change into component drivers—showing how much of a change came from distribution gains or losses, velocity changes, price/mix shifts, and competitive dynamics. Unlike traditional reporting that shows share declined 0.5 points, AI-powered share decomposition transforms this into actionable insight: “Share declined 0.5 points—0.3 from distribution loss at Kroger, 0.4 from velocity decline at Walmart, offset by +0.2 from favorable mix shift toward premium SKUs.” In a CPG environment where shopper behavior and category trends are shifting fast, external benchmarks such as NIQ’s Consumer Outlook: Guide to 2026 help ground those insights in the broader market context. This diagnostic precision matters because different drivers require different responses: distribution loss requires sales effort, velocity decline requires marketing support, and competitive gains require strategic repositioning. AI automates the data integration, baseline modeling, and driver attribution that traditionally required days of manual analysis—delivering decomposition on demand for any brand, retailer, or time period.
.jpg)
The Real Problem: Decomposition Without Diagnosis
Most CPG companies can tell you that share moved. Few can tell you why—at least not quickly enough to matter.
What Passes for Share Analysis Today
The typical share analysis process looks like this: Someone notices share declined in the latest Nielsen read. An analyst pulls the data, compares it to prior periods, and produces a chart showing the trend. If pressed, they'll break out the numbers by retailer or region. If really pressed, they'll compare velocity and distribution metrics side by side.
But here's what that process actually delivers: a description, not a diagnosis. You learn that share dropped and that velocity also dropped. You don't learn whether the velocity drop caused the share drop, how much it contributed versus distribution changes, or whether competitive activity was the real driver.
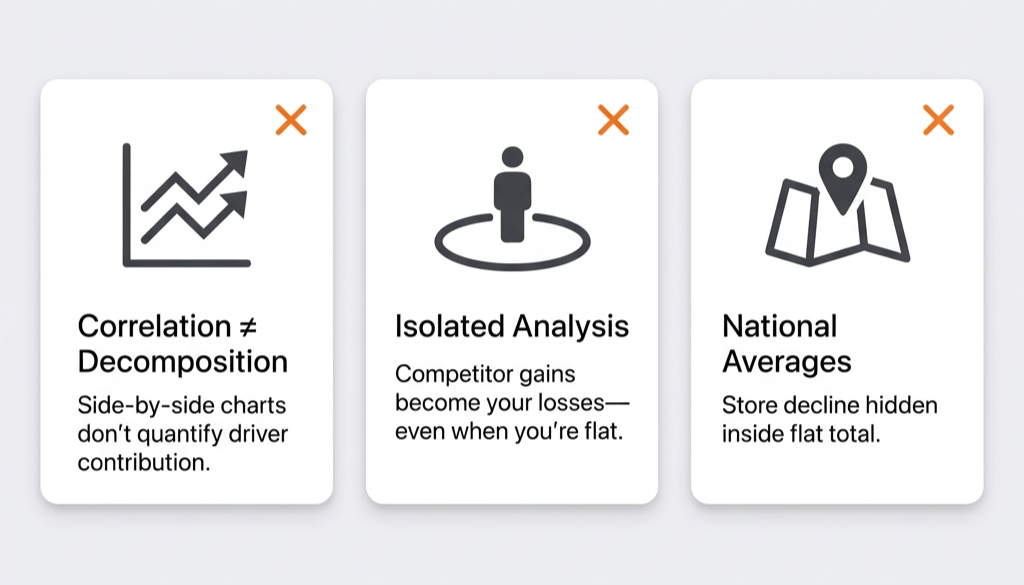
The Three Mistakes Teams Make
Mistake #1: Confusing Correlation with Decomposition
Showing that velocity declined in the same period as share declined isn't decomposition—it's correlation. True decomposition quantifies how much of the share change each driver explains. The math isn't trivial: when distribution and velocity move simultaneously, you need statistical models to isolate each effect, not just side-by-side charts.
Mistake #2: Ignoring Competitive Attribution
Your share can decline without anything changing in your business. If a competitor gains distribution at retailers where you're flat, their gain becomes your loss—even though your own metrics held steady. Most decomposition analyses treat your brand in isolation, missing the broader retail competitive dynamics that often matter most.
Mistake #3: Stopping at National Averages
A brand might be flat nationally but declining sharply at Kroger while gaining at Walmart. National decomposition hides this entirely. The Kroger problem requires a specific response; the Walmart opportunity requires a different one. Without retailer-level decomposition, you're working with averages that obscure the actions you should take.
What Share Decomposition Should Actually Answer
Effective share decomposition answers three layers of questions: understanding what happened, diagnosing why it happened, and deciding what to do about it.
Understanding: What Changed?
Before diagnosing drivers, you need clean measurement of what actually moved. This means:
- Total share change for the period in question, with statistical significance testing to distinguish real movement from normal fluctuation
- Share by retailer to identify where gains and losses concentrated
- Share by geography to spot regional patterns that national numbers obscure
- Share by segment (premium vs. value, pack size, flavor) to understand portfolio dynamics
The goal isn't just "share dropped 0.5 points"—it's understanding where share dropped and whether that drop is statistically meaningful or noise.
Diagnosing: Why Did It Change?
This is where most analyses fail. True diagnosis requires decomposing share change into its mathematical components:
Distribution Effect: How much share change resulted from gaining or losing distribution? This includes both breadth (% ACV—the percentage of stores carrying your product) and depth (TDP—Total Distribution Points, which captures how many SKUs you have in each store).
Velocity Effect: How much share change resulted from selling more or less per point of distribution? Velocity (often measured as Sales Per Point of Distribution or SPPD) reflects consumer demand at shelf.
Price/Mix Effect: How much share change resulted from price positioning and product mix shifts? In many categories, volume declines are being partially offset by price and mix, which can mask underlying health issues. Recent analyses, such as Sevendots’ review of Q3 2025 CPG results and volume decline, demonstrate the extent to which category growth is driven by pricing and premiumization versus actual unit growth.
Competitive Attribution: How much of your share change resulted from competitor actions versus your own?
.png)
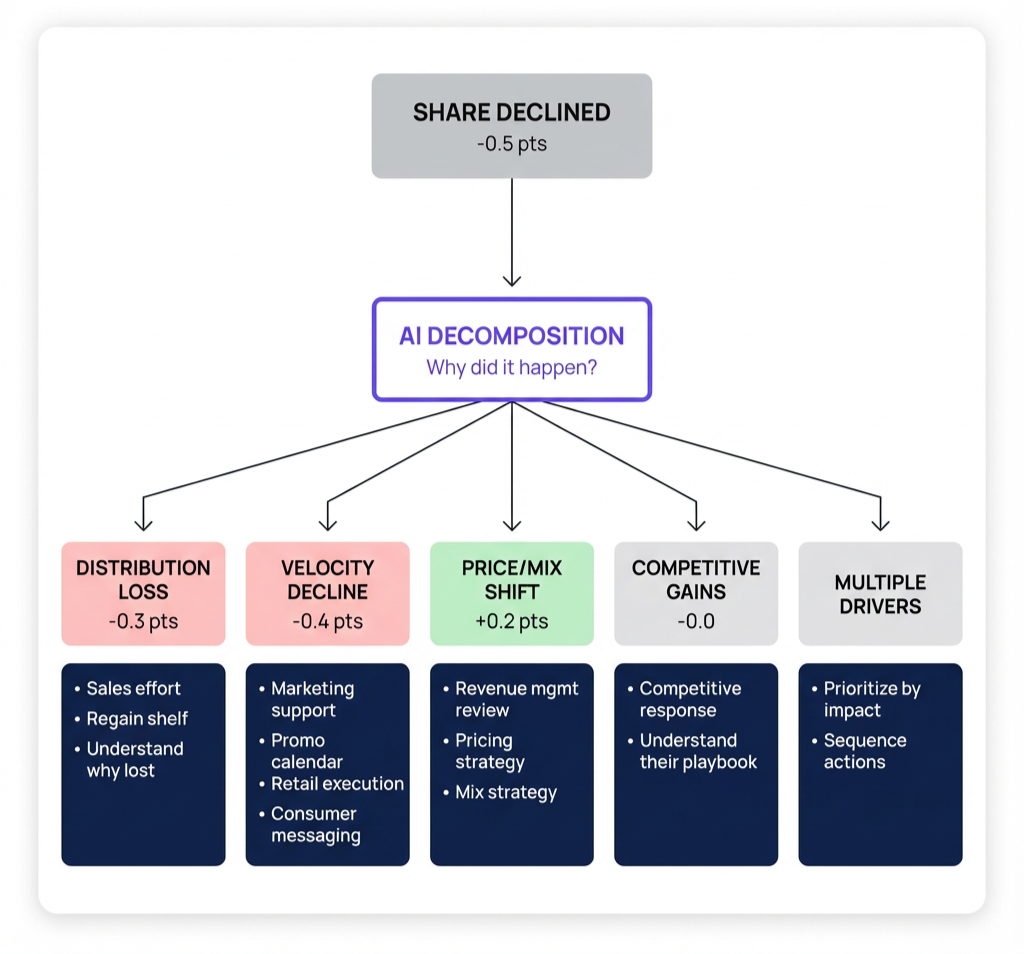
Acting: What Should We Do?
When share drops half a point, AI decomposition breaks it into the five factors that actually moved—and what to do about each.
How AI Changes Share Decomposition
How does AI automate decomposition that traditionally takes days?
AI transforms share decomposition from a periodic, manual project into an on-demand, continuous capability.
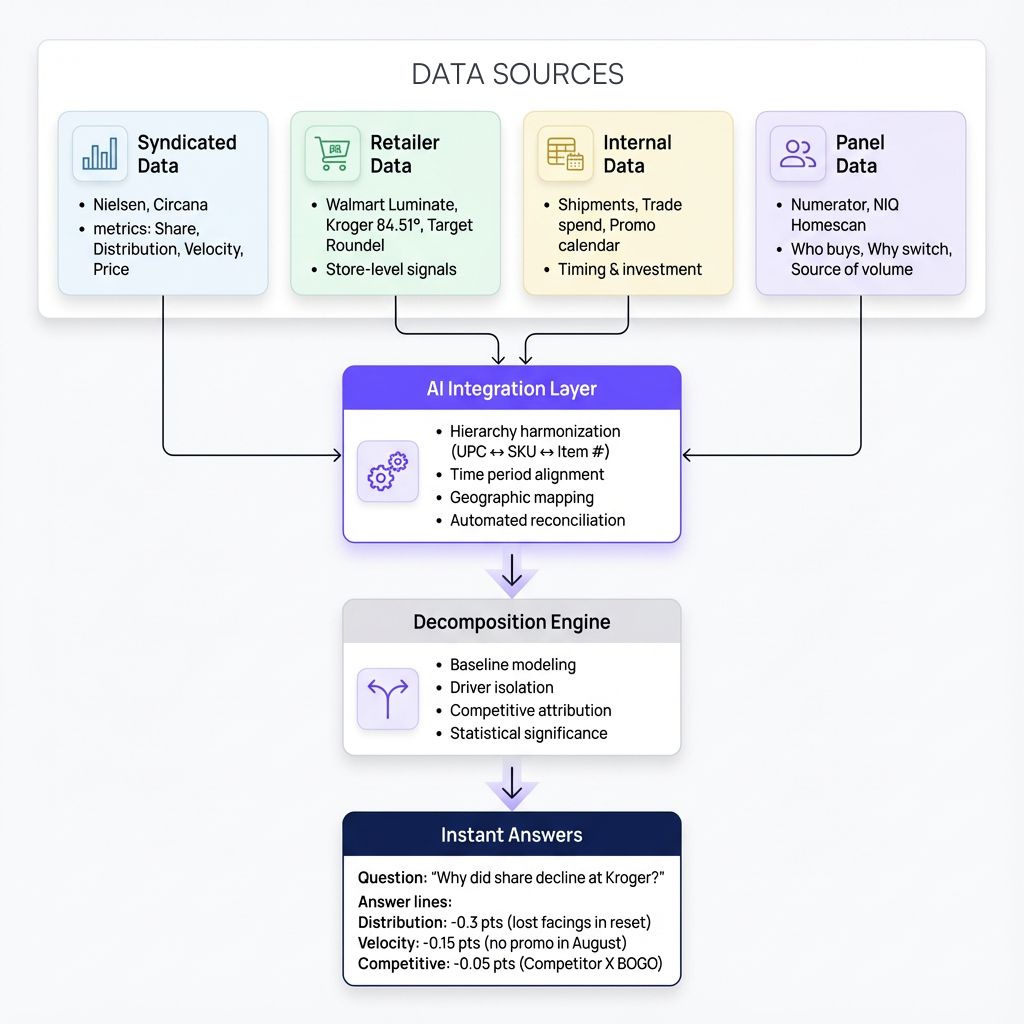
Automated Data Integration
Share decomposition requires integrating multiple data sources: syndicated POS data from Nielsen or Circana, retailer-specific data from Walmart Luminate or Kroger 84.51°, and internal shipment and promotional data. Traditionally, reconciling these sources—which use different product hierarchies, time periods, and geographic definitions—consumes 60-70% of the analysis timeline.
AI automates this integration, harmonizing product hierarchies across sources and aligning time periods so decomposition can happen immediately when questions arise, not days later after manual data wrangling.
Consistent Baseline Modeling
Decomposition accuracy depends on accurate baselines—understanding what "normal" looks like so you can measure deviations. Traditional approaches use analyst judgment to identify comparable periods and adjust for seasonality, trends, and anomalies. Different analysts make different assumptions and get different answers.
AI-powered baseline models learn patterns from historical data across thousands of item-store-week combinations, automatically accounting for seasonality, trends, holiday effects, and competitive activity. More importantly, they apply these adjustments consistently—eliminating the analyst-to-analyst variation that makes traditional decomposition unreliable.
Real-Time Competitive Attribution
Manual competitive analysis is inherently backward-looking: you notice a competitor gained share, then investigate what they did. By then, their momentum is established.
AI monitors competitive dynamics continuously—tracking share, distribution, pricing, and promotional activity across your competitive set. When competitors make moves, AI flags them immediately and attributes their impact on your share before you'd otherwise notice.
Instant Decomposition on Demand
Perhaps most importantly, AI makes decomposition conversational. Instead of requesting an analysis and waiting days, brand managers can ask "Why did share decline at Target last month?" and get immediate decomposition showing the drivers, their relative contributions, and how this retailer compares to others.
This shifts decomposition from a periodic reporting exercise to an always-available diagnostic capability.
Use Cases: From Reactive Reporting to Proactive Intelligence
1) AI-Powered Quarterly Reviews
The Situation: Two days before the quarterly business review, leadership asks: "Why did we lose 0.8 share points in the West region?" The brand team scrambles, pulling data from multiple sources, building Excel models, and hoping to have something defensible by the meeting.
.png)
Without AI: The team produces a deck showing share declined, velocity declined, and competitor X gained. The explanation is correlational, not causal. Leadership asks follow-up questions the team can't answer. The discussion becomes a debate about data rather than a decision about action.
With AI: The brand manager asks the question directly: "Why did share decline 0.8 points in the West?" AI returns immediate decomposition: "0.5 points from velocity decline concentrated at Safeway (no promotional support in August while competitor ran BOGO), 0.2 points from distribution loss at Sprouts (spring reset reduced facings), 0.1 points from unfavorable mix shift as premium SKU underperformed." Leadership gets a clear diagnosis and the conversation focuses on response: restore Safeway promotional support, work to regain Sprouts facings, investigate premium SKU underperformance.
2) Competitive Response Analysis
The Situation: A competitor launches a new item in your core segment. Three months later, you notice your share has declined. Was it the launch? Something else? How should you respond?
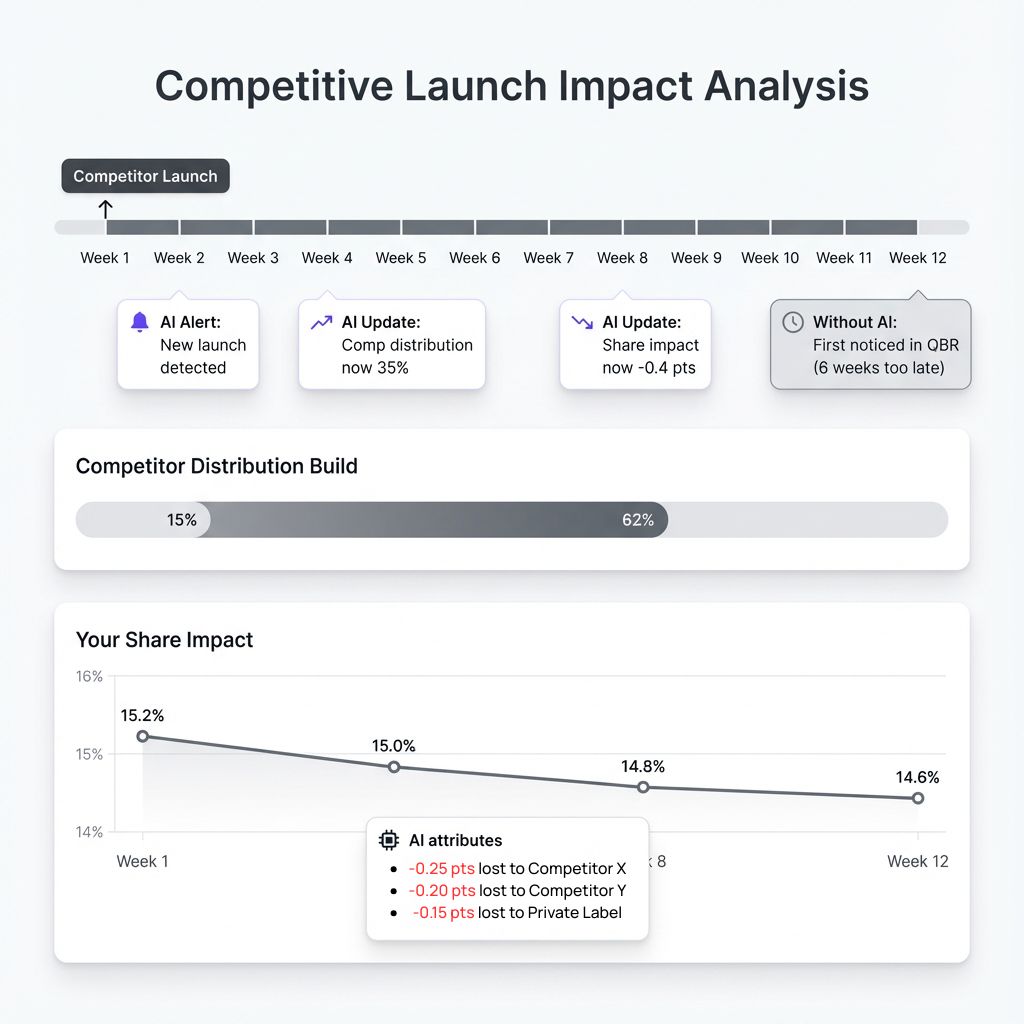
Without AI: Manual analysis requires pulling launch tracking data, comparing your share trend to the launch timing, and attempting to isolate the launch effect from other factors. This takes weeks, and by then the competitor has established momentum.
With AI: AI detected the competitive launch immediately and has been tracking its impact continuously. When asked, AI shows: "Competitor launch took 0.6 share points from the category—0.25 from your brand, 0.2 from Competitor Y, 0.15 from private label. Launch velocity is strong and distribution is still building. At current trajectory, expect additional 0.3 point share loss over next two quarters." The brand team can make informed decisions about response: counter-launch, promotional defense, or segment repositioning.
3) Augmented JBP Preparation
The Situation: The key account manager has a Joint Business Planning meeting with Kroger next week. They need to understand how the brand is performing at Kroger versus other retailers and what's driving any differences.
.png)
Without AI: Preparing retailer-specific analysis requires pulling Kroger data, comparing to syndicated market data, and building a custom deck. This takes days and often produces surface-level insights that don't impress the buyer.
With AI: The KAM asks: "How is our brand performing at Kroger compared to the market, and what's driving the difference?" AI returns: "Your share at Kroger is 2.1 points below national average. Decomposition shows: 1.2 points from lower distribution (Kroger carries 8 SKUs versus 12 at Walmart), 0.6 points from lower velocity (promotional depth averages 15% at Kroger versus 22% at Walmart), 0.3 points from unfavorable price positioning (your price index versus competitor is 108 at Kroger versus 102 nationally)." The KAM walks into the JBP meeting with specific, quantified opportunities to discuss.
Results: What AI-Powered Decomposition Delivers
How do AI agents provide early warning on share shifts?
The Hidden Cost of Slow Decomposition
When decomposition takes a week, decisions wait. When decisions wait, problems compound:
- A competitive threat detected 6 weeks late has taken 2 share points before you respond
- A velocity problem at a key retailer goes unaddressed through an entire planning cycle
- Promotional investments go to the wrong retailers because you don't know where velocity is weak
The value of AI-powered decomposition isn't just faster answers—it's decisions made on current information rather than month-old analysis.
Get Started: From Share Questions to Share Answers
Share decomposition shouldn't require a week-long project. Every "why did share change" question deserves an immediate, quantified answer.
AI-powered decomposition transforms how brand teams understand and respond to performance:
- Instant diagnosis instead of days of data wrangling
- Competitive awareness instead of quarterly surprises
- Targeted action instead of unfocused activity
Stop describing share changes. Start explaining them.
Get release updates delivered straight to your inbox.
No spam—we hate it as much as you do!


Share reporting tells you that share changed. Share decomposition tells you why. Reporting shows share declined 0.5 points; decomposition shows 0.3 points came from distribution loss at Kroger, 0.15 from velocity decline at Walmart, and 0.05 from competitive pricing pressure. This diagnostic precision enables targeted response rather than unfocused activity. Most CPG teams have share reporting; few have true decomposition capability.
Fair share holds that your market share should approximately equal your share of total distribution. Calculate it by comparing your distribution share (your TDP ÷ total category TDP) to your market share. If you have 20% of category distribution but only 15% of market share, you're underperforming versus distribution—a velocity problem. If you have 15% of distribution but 20% of market share, you're outperforming—strong velocity that might justify pursuing more distribution. The gap between distribution share and market share directs strategic focus.
ACV (All Commodity Volume) measures distribution breadth—what percentage of stores carry at least one of your SKUs, weighted by store volume. TDP (Total Distribution Points) measures both breadth and depth—the sum of ACV percentages across all your SKUs. ACV tells you reach; TDP tells you total shelf presence. For decomposition, TDP is generally more useful because it captures both gaining/losing stores and gaining/losing SKUs within stores. A brand can maintain stable ACV while losing TDP if retailers reduce facings.
Normal business fluctuation creates noise in share data—a 0.1 point change might be random variation, while a 0.5 point change is more likely real. AI applies statistical significance testing to distinguish real movements from noise by comparing observed changes to historical volatility patterns. This prevents over-reaction to normal fluctuations while ensuring real shifts get attention. As a rule of thumb, changes exceeding 2x the typical week-to-week variation warrant investigation.
When distribution and velocity move at the same time, simple subtraction doesn't work—you need statistical models to isolate each effect. AI-powered decomposition uses regression-based attribution that controls for interaction effects: holding velocity constant, how much did distribution change contribute? Holding distribution constant, how much did velocity contribute? This produces accurate attribution even when multiple drivers move together, which is the norm in real-world share movements.
Your share can decline without anything changing in your business—if a competitor gains distribution where you're flat, their gain becomes your loss. Decomposition with competitive attribution analyzes both your metrics and competitor metrics simultaneously. It separates share change you caused (your distribution loss, your velocity decline) from share change competitors caused (their distribution gains, their promotional intensity, their new launches). This prevents misdiagnosis—blaming your velocity when the real driver was competitor activity.
National decomposition can hide critical dynamics. A brand might be flat nationally but declining sharply at Kroger while gaining at Walmart. National numbers average these together, obscuring the actions you should take. Retailer-level decomposition shows where you're winning and losing, and why—enabling account-specific responses. The Kroger problem requires different action than the Walmart opportunity. Always run decomposition at the retailer level, then roll up to national for summary views.
Price/volume/mix (P/V/M) decomposition breaks revenue or share changes into three components: price effect (impact of price changes holding volume and mix constant), volume effect (impact of unit changes holding price and mix constant), and mix effect (impact of shifting product mix holding units and prices constant). This reveals whether growth came from selling more, charging more, or selling a different product mix—each with different sustainability and margin implications.
Run decomposition at three frequencies for different purposes. Weekly or bi-weekly decomposition catches emerging issues early—a velocity decline in its second week is easier to address than one discovered at the quarterly review. Monthly decomposition provides trend context and smooths out noise. Quarterly decomposition supports business reviews and strategic planning. For granularity, always decompose at retailer level minimum; geography and segment decomposition add value when you have enough data density.
AI automates three bottlenecks that consume most decomposition time. First, data integration: AI harmonizes syndicated data, retailer data, and internal data automatically—mapping UPCs to retailer items to internal SKUs without manual reconciliation. Second, baseline modeling: AI builds statistical models that isolate each driver's contribution, controlling for seasonality, trends, and interaction effects—work that previously required analyst-built Excel models for each question. Third, on-demand calculation: instead of waiting for analysts to build decomposition for a specific time period or retailer, AI runs decomposition instantly for any query. The result: what took 3-5 days of analyst work becomes a 30-second response to "Why did share decline at Kroger?"
Prioritize by impact and addressability. If distribution loss explains 60% of your share decline, that's where to focus—but only if you can realistically regain the lost distribution. Consider: magnitude (how much share did this driver cost?), addressability (can we actually fix it?), speed (how quickly can we act?), and cost (what's the investment required?). A 0.3 point velocity decline that marketing can address in 4 weeks may be higher priority than a 0.4 point distribution loss that requires 6 months of retailer negotiation.
Distribution loss requires diagnosis before action. Why did you lose distribution? Retailer reset (they reduced category facings), rationalization (your SKU was cut for underperformance), execution failure (out-of-stocks led to delisting), or competitive displacement (competitor took your slot)? Each cause has different responses: reset losses require JBP negotiation; rationalization requires velocity improvement before re-pitching; execution failures require supply chain fixes; competitive displacement requires understanding what they offered that you didn't.
Velocity decline indicates weakening demand at shelf. Investigate the cause: promotional gap (competitors promoting more heavily?), pricing pressure (are you priced out of consideration?), out-of-stocks (is product available but not selling, or not available?), consumer preference shift (has demand moved to different attributes?), or execution issues (shelf placement, freshness, merchandising). The response varies: restore promotional support, adjust pricing, fix supply chain, refresh marketing message, or improve retail execution.
Decomposition transforms retailer conversations from subjective debate to fact-based discussion. Instead of "we need more support," show: "Our velocity at your banner is 15% below national average. Decomposition shows 8% from promotional depth gap (15% discount versus 22% nationally) and 7% from reduced facings versus last year. Matching promotional parity would recover approximately $X in category sales." Specific, quantified insights earn credibility and shift conversations toward solutions.
Lead with the answer, not the method. Structure as: what changed (share declined 0.5 points at Kroger), why it changed (0.3 from distribution loss in the spring reset, 0.2 from velocity decline during the promotional gap in August), what it means (we're losing to Competitor X who filled our lost facings), and what we're doing (regaining distribution in fall reset, restoring Q4 promotional support). Save methodology details for follow-up questions. Leadership wants diagnosis and action, not a statistics lesson.
AI agents monitor share, distribution, and velocity continuously—not waiting for someone to ask. When metrics cross defined thresholds (share decline exceeds 0.3 points, velocity drops below category average, competitor gains distribution), agents trigger alerts with automatic decomposition showing what's driving the change. This transforms share monitoring from a quarterly discovery exercise to continuous awareness. A competitive threat detected in Week 2 can be addressed before it takes root; the same threat discovered at the Week 8 quarterly review has already cost you 6 weeks of share erosion. Agents don't replace decomposition analysis—they trigger it automatically when it matters.
Minimum requirements: syndicated POS data (Nielsen or Circana) with share, distribution (ACV/TDP), and velocity metrics for your brands and competitors. This enables basic decomposition. For richer analysis, add: retailer-specific data for store-level granularity, internal shipment data for supply-side context, and promotional calendars to connect decomposition to your actions. You can start with syndicated data alone and add sources over time.
Test against known events. Pull a period where you know what happened—a distribution loss at a specific retailer, a promotional gap, a competitive launch. Does decomposition correctly identify the driver and quantify its impact? If decomposition shows distribution loss at Kroger but you know Kroger actually increased your facings, something's wrong. Validate 3-5 historical periods before trusting decomposition for forward-looking decisions. Accuracy should exceed 80% on driver identification.