Why 70% of Trade Promotions Lose Money—And What AI Can Actually Do About It


What is AI-powered trade promotion analytics?
CPG companies spend 15-25% of revenue on trade promotion. According to McKinsey research, 72% of trade promotions in the United States lose money. Not break even. Lose money.
The problem isn't the spend itself. Trade promotion drives volume, supports retailer relationships, and defends shelf space. The problem is that most Revenue Growth Managers can't identify which promotions are losing money until the quarter closes—when the same underperforming tactics are already locked into next quarter's plan.
This isn't a new problem. CPG companies have been trying to solve it for decades with Trade Promotion Optimization (TPO) tools, consulting engagements, and center-of-excellence initiatives. Most of those efforts failed. Not because the goal was wrong, but because they tried to optimize without first solving the measurement problem.
AI-powered trade promotion analytics takes a different approach. It unifies point-of-sale data, syndicated sources, and Trade Promotion Management (TPM) systems to measure promotion effectiveness automatically. Unlike TPM platforms that track planned versus actual spending but not performance impact, AI-powered analytics calculates lift, incrementality, and ROI for every event—identifying which tactics, retailers, and timing windows drive profitable volume versus volume that would have happened anyway.
The difference between knowing which promotions work and guessing? About 10-15% of your trade budget—tens of millions of dollars for most CPG companies.
Why Traditional Measurement Fails
You've been in this meeting. The CFO asks about last quarter's promotional ROI. Three people give three different answers. Finance has one number based on accruals. Sales has another based on shipments. Trade Marketing has a third based on syndicated lift. Everyone's confident. No one agrees.
This isn't incompetence. It's a structural problem.
Post-event analysis takes 2-3 weeks because POS data, shipment data, and trade spend live in different systems requiring manual reconciliation. Analysts spend more time assembling data than analyzing it. By the time analysis is complete, the same underperforming tactics are already planned for next quarter. The calendar doesn't wait for insights.
Incrementality calculations vary by analyst. Finance uses one methodology, Sales uses another, Trade Marketing has a third. Forrester reports that CPG brands estimate a third of their $500+ billion annual trade spend generates negative returns—but they can't agree on which third.
McKinsey found that nearly half of large European CPG manufacturers have no trade promotion optimization tool at all. They're making multi-million dollar allocation decisions based on last year's plan, gut feel, and retailer pressure.
The result: debates replace decisions. The same losing promotions get funded quarter after quarter because no one can prove they're losing. "We've always done this BOGO at Kroger" becomes justification enough when measurement is too slow, too inconsistent, or too contested to inform the conversation.
.png)
Why TPO Tools Haven't Solved the Problem
You've probably invested in trade promotion optimization before. Most CPG companies have. Deloitte's 2024 consumer products outlook found that while 66% of profitable CPG companies invested in Revenue Growth Management systems, many still struggle to measure promotion effectiveness accurately.
The tools failed for predictable reasons—reasons that explain why a different approach is needed.
Optimization without measurement. TPO systems optimize based on predicted promotion response built on historical "lift" numbers that overstate effectiveness by 40-60%. Lift includes pantry loading, pull-forward, and cannibalization—effects that inflate apparent performance without creating real value. If your baseline calculation is wrong, your optimization is guesswork dressed up as math. AI-powered baseline models separate true incrementality from inflated lift—giving optimization something accurate to aim at.
No feedback loop. TPO recommends a plan, the plan executes, then nothing. No systematic measurement of whether the "optimized" plan outperformed the old approach. Without feedback, models never improve. Post-event analysis is too slow to inform the next cycle—by the time you know Q1 recommendations underperformed, Q2 is already locked. AI agents close this loop automatically—measuring every event against prediction and feeding accuracy back into models continuously.
Black box models. The tool recommended shifting spend from Kroger to Walmart, but no one could explain why. When the recommendation couldn't be justified to the Key Account Manager or defended to the retailer, it got ignored. Sophisticated algorithms that no one trusts produce the same outcome as no algorithm at all.
Measurement and planning disconnected. TPO vendors focused on planning sophistication—scenario modeling, constraint optimization, what-if analysis. Measurement was an afterthought bolted on later (or never). Planning teams use TPO. Measurement teams use Excel. The two never connect. AI-powered trade analytics unifies measurement and planning—optimization grounded in measured results, not assumed response rates.
Adoption dies in complexity. TPO interfaces were built for data scientists, not Revenue Growth Managers. Users needed weeks of training. Sales teams never logged in. The "optimized" recommendations sat in a system nobody used while actual planning happened in spreadsheets. Conversational AI eliminates this problem—users ask questions in plain English, get answers instantly, no training required.
Static models in dynamic markets. TPO models were calibrated at implementation and rarely updated. But promotion response changes—competitive intensity shifts, consumer behavior evolves, retailer dynamics fluctuate. Models trained on 2022 data don't predict 2025 response. AI models retrain continuously as new data arrives—adapting to market changes rather than fossilizing.
What's changed: Cloud infrastructure makes deployment faster. AI can explain its reasoning instead of just outputting a number. Interfaces designed for Revenue Growth Managers rather than data scientists. The technology caught up to the problem. Whether the implementations catch up to the technology is a different question.
.png)
The Measurement-First Alternative
Here's the uncomfortable truth: you can't optimize what you can't measure. TPO tried to skip ahead to optimization without solving measurement first. The fix is inverting the sequence.
1. Measure first: Calculate true incrementality and ROI for every promotion, consistently, automatically
2. Learn patterns: Identify what actually drives success—which tactics, retailers, timing, depths
3. Then optimize: Apply those patterns to future planning with confidence
This sounds obvious. So why didn't TPO vendors do it?
Because rigorous measurement at scale was impractical. Calculating true incrementality for a single promotion requires building a baseline model (what would have sold without the promotion), adjusting for pantry loading and pull-forward effects, measuring cannibalization across related SKUs, and computing net portfolio-level ROI.
For one promotion, that's a 2-3 day analyst project. For 500 promotions per year? Impossible. So TPO vendors skipped to optimization and hoped the measurement problem would solve itself. It didn't.
Enter AI Agents
AI agents make measurement-first practical by automating what analysts couldn't scale.
Traditional analytics waits to be asked. You request a report, an analyst builds it, you get answers days or weeks later. The insight exists in the same quarter as the question—if you're lucky.
AI agents don't wait. They monitor continuously, detect when something meaningful happens, investigate root causes autonomously, and deliver insights before you ask. The insight exists in the same conversation as the question.
What AI-Powered Trade Promotion Analytics Actually Does
This isn't "faster dashboards." It's a fundamentally different approach built on three analytical layers.
Automated baseline calculation. AI models seasonality, trends, and competitive activity to establish what would have happened without the promotion. This replaces manual baseline estimation where two analysts using two methodologies produce two different baselines—and therefore two different lift calculations. The model doesn't eliminate judgment calls, but it applies them consistently across every event.
Incrementality decomposition. True lift isn't just "sales went up during the promotion." Pantry loading shifts purchases forward in time without creating new demand. Cannibalization steals volume from other SKUs in your own portfolio. Halo effects boost related products you weren't promoting. Traditional analysis either ignores these dynamics or guesses at them. AI quantifies each component separately, so you know whether a promotion actually grew the category or just moved volume from one pocket to another.
Root cause analysis. When a promotion underperforms, the question isn't just "how much" but "why." Was it an execution problem—out-of-stocks, poor display compliance, missing ad feature? Was it a tactic problem—wrong depth, wrong timing, wrong mechanic for this retailer? Was it a market condition—competitor running an unplanned deep discount the same week? AI separates these factors automatically instead of requiring an analyst to manually investigate each hypothesis.
No model is perfect. Anyone who claims otherwise is selling something. The question is whether AI-generated baselines and incrementality estimates are better than the alternatives: analyst judgment calls that vary by person and day, last year's plan with a 3% adjustment, or no measurement at all. Validation against holdout tests and shipment reconciliation shows where models are strong and where they need refinement. But "imperfect model" beats "no model" when you're allocating tens of millions of dollars.
The practical outcome: insights within 48 hours of data availability instead of 2-3 weeks—early enough that spend reallocation is still possible.
Three Approaches: From Reactive to Autonomous
Most CPG companies operate in reactive mode—asking questions after the fact and waiting weeks for answers. Leading companies are moving to proactive mode—getting alerts when issues arise. The next generation is autonomous—AI agents that monitor, detect, investigate, and recommend without waiting to be asked.
BCG's 2025 AI research found that AI agents already account for 17% of total AI value in 2025, expected to reach 29% by 2028. For trade promotion, this shift from reactive to autonomous changes what's operationally possible.
Use Case: The Quarterly Surprise (Reactive)
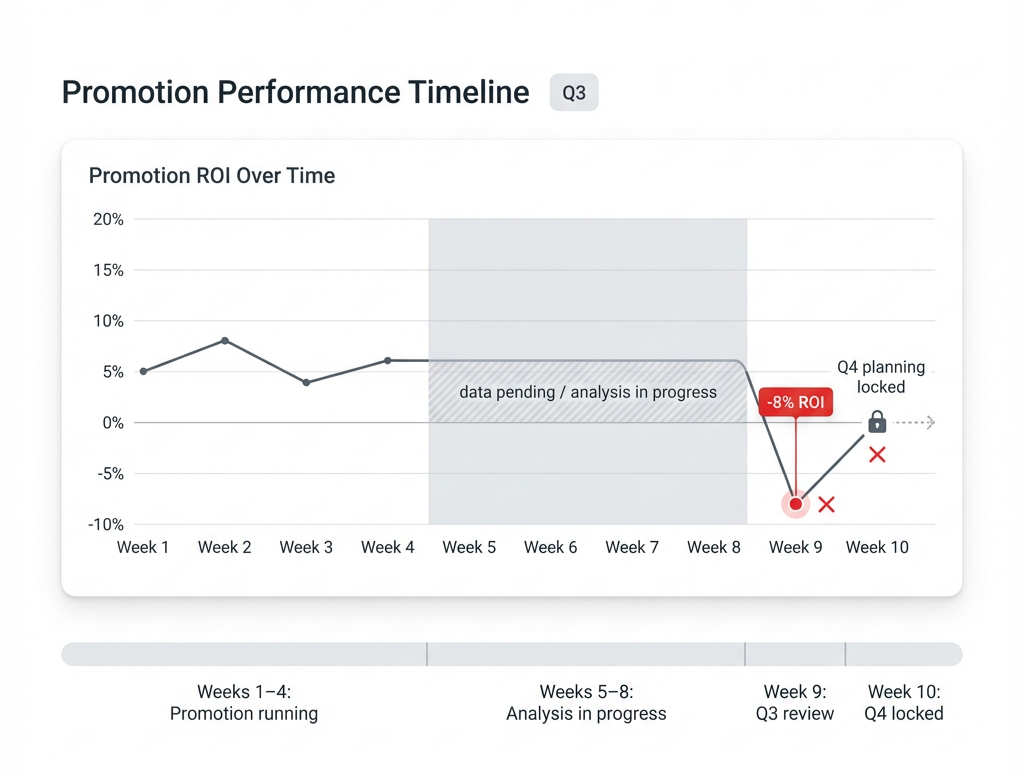
Q3 business review reveals a flagship BOGO program at Kroger delivered -8% ROI—losing $1.2M over the quarter. No one analyzed the events until Finance requested quarterly trade reconciliation. Post-event analysis took 3 weeks per event. By the time results were compiled, Q4 was already planned with the same BOGO structure.
Outcome: Q4 repeats the same losing program. The insight arrived, but too late to matter.
Why reactive fails: The promotion calendar moves faster than the analysis cycle. Losing events repeat because no one knows they're losing until it's too late to change the plan.
Use Case: Automated Post-Event Analysis (Proactive)
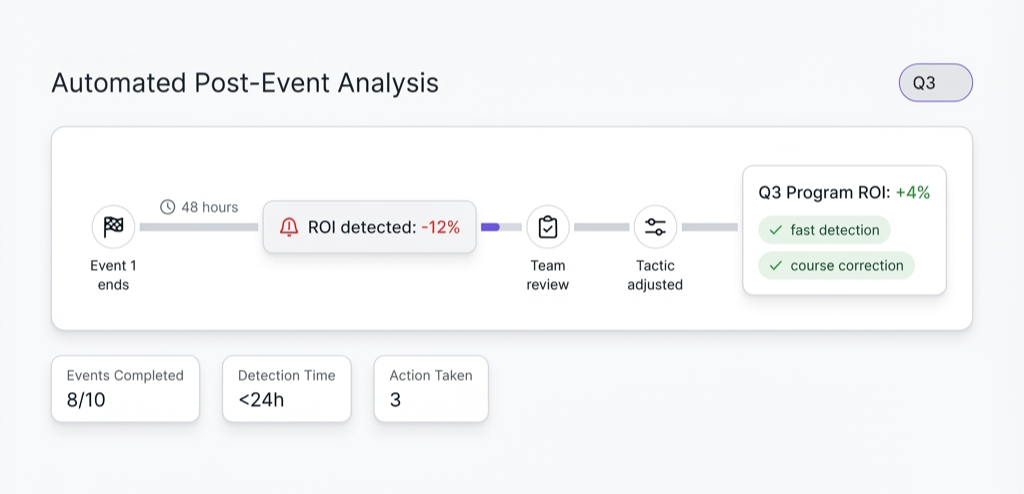
Same Kroger BOGO program as above, but with AI-powered measurement. Within 48 hours of each event ending, AI calculated lift, incrementality, and ROI automatically. After the first event showed -12% ROI, an alert flagged it for review.
Trade team investigated, identified that the BOGO depth was too aggressive—margin erosion exceeded incremental volume benefit. They adjusted remaining Q3 events to 25% TPR instead.
Outcome: Q3 program finished at +4% ROI instead of -8%. Same products, same retailer, different tactic based on measured results.
Why proactive is better: Insights arrive while decisions can still change. Problems surface automatically—no waiting for someone to ask the right question.
Limitations: Still reactive to completed events. Alerts come after the promotion ends, not during. Humans must review every alert and decide what to do.
Use Case: In-Flight Intervention (Autonomous)
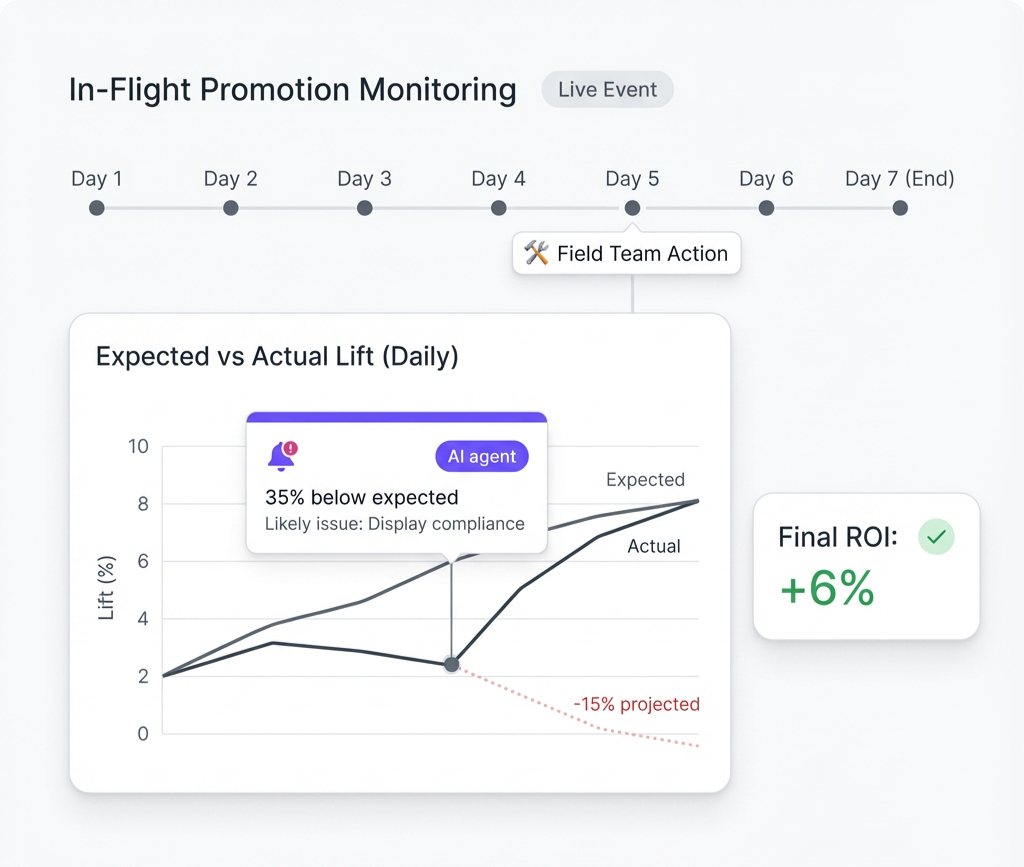
Same Kroger BOGO program, but with AI agent monitoring. The agent compares daily POS data against expected lift curves. By Day 4 of the first event, it detects performance 35% below expected.
Alert delivered: "Kroger BOGO on SKU X tracking 35% below expected lift. Current trajectory: -15% ROI. Root cause hypothesis: Display compliance at 58% vs. 85% target—likely execution gap."
Field team contacts Kroger, discovers displays weren't set in 40% of stores due to a reset scheduling conflict. Kroger expedites setup.
Outcome: Event finishes at +6% ROI. Without Day 4 intervention, projected finish was -15%.
This isn't Day 1 magic. Syndicated data has lag. Retailer data availability varies. The model needs enough data points to distinguish signal from noise. But Week 2 of a 4-week promotion is actionable. Week 6 post-mortem is not.
Use Case: Cannibalization Pattern Detection (Autonomous)
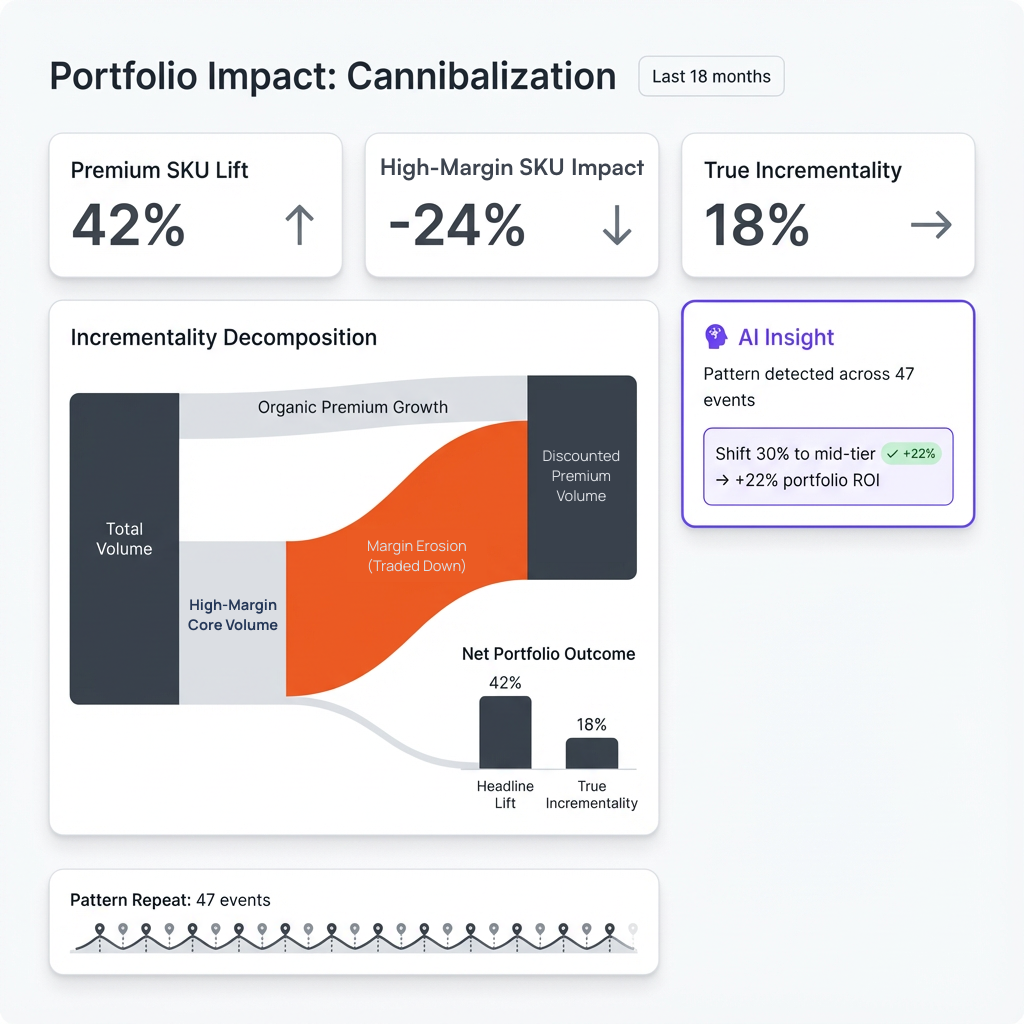
Trade team notices premium SKU promotions seem less effective than expected but can't explain why.
What the AI agent found: Across 47 premium SKU promotions over 18 months, average cannibalization rate was 42%—nearly half the "lift" came from sister SKUs, not incremental volume.
Insight delivered: "Premium SKU promotions show 42% average cannibalization from mid-tier SKUs. Net portfolio incrementality averages 18% vs. 31% headline lift. Pattern consistent across retailers."
Recommendation: "Mid-tier SKU promotions show only 15% cannibalization and higher conquest rate from competitors. Consider shifting 30% of premium promo dollars to mid-tier."
Outcome: Q2 reallocation improves portfolio trade ROI by 22%.
The difference between "we discovered the promotion failed" and "we caught the problem early enough to do something about it" is the difference between explaining what happened and changing what happens next.
Governed Trade Promotion ROI: Ending the Cross-Functional Debate
Remember that meeting where three people gave three different ROI numbers? Governed analytics solves that problem—not by making everyone agree on strategy, but by making everyone agree on facts.
Will a platform make your VP of Sales and CFO magically agree on trade strategy? No. But it removes the methodological excuse.
When everyone's looking at the same calculation—with the same baseline assumptions, the same incrementality methodology, the same cost allocation—the debate shifts from "whose spreadsheet is right" to "what should we do about it." That's a more productive argument.
Governed trade promotion ROI means one calculation for incremental profit versus total cost, applied consistently to every event, every retailer, every tactic. Cannibalization gets quantified instead of ignored. Halo effects get captured instead of assumed away. Every number has a full audit trail back to source data, so when the retailer challenges your analysis or the CFO asks how you calculated lift, you can show your work.
This connects directly to Gross-to-Net forecasting. When actual promotion effectiveness feeds revenue forecasts instead of assumed trade rates, Finance stops getting surprised by the gap between planned and actual trade ROI. McKinsey's 2024 CPG research found that trade promotion optimization can drive both reduced SG&A expenses and net revenue growth—but only when measurement is trusted across functions.
The goal isn't to eliminate disagreement about trade strategy. Reasonable people can disagree about how to allocate spend. The goal is to eliminate disagreement about what happened, so the strategic debate starts from shared facts instead of competing spreadsheets.
Real Questions AI-Powered Analytics Answers
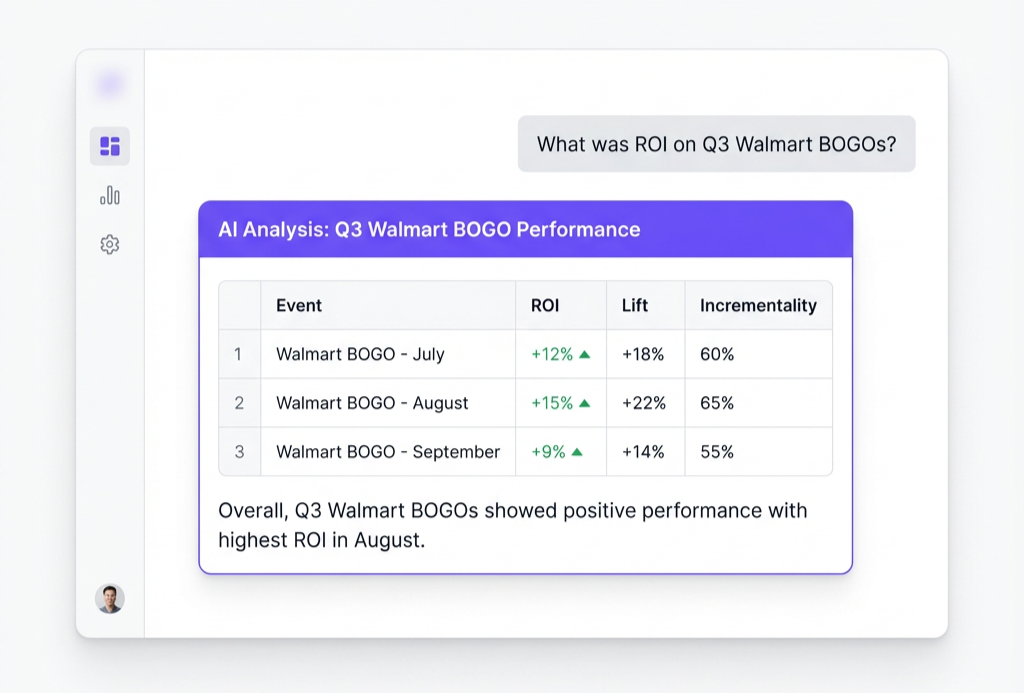
The value of conversational analytics is that Revenue Growth Managers can ask questions in plain language and get answers in seconds—not days, not after submitting an analyst request, not after waiting in queue behind five other projects.
Questions like:
- "What was ROI on last month's Walmart promotions?"
- "Which BOGO events had negative incrementality last quarter?"
- "Show me promotions where cannibalization exceeded halo, ranked by portfolio impact."
- "What tactics drove the highest lift per trade dollar at Kroger versus Target?"
- "Which events should we cut from next quarter's plan based on 12-month performance?"
- "How would shifting 20% of TPR spend to display affect projected Q2 ROI?"
That last one deserves a caveat. Scenario modeling won't tell you exactly what will happen. It shows probability-weighted ranges, not point estimates. Historical patterns don't guarantee future results. But a probability-weighted range based on your actual promotion history is more useful than gut feel, and more honest than a single confident number that implies false precision.
Unlike traditional analysis requiring analyst queue time, these answers arrive while the planning conversation is still happening. The question and the answer exist in the same meeting.
Implementation: What It Actually Takes
Implementation reality is messier than vendor slides suggest. Here's what the process actually requires.
Minimum data requirements. Three things to start: POS data covering promotional periods (syndicated weekly or retailer daily), promotion event definitions (products, stores, dates, tactics), and trade spend by event (scan allowances, display fees, associated costs). With these three elements, you can calculate baseline, lift, and ROI. Advanced capabilities like incrementality adjustment and cannibalization measurement require additional data, but they're not prerequisites for getting started.
Integration complexity. Syndicated data from your existing Nielsen or Circana feeds. Retailer data from Walmart Luminate, Kroger 84.51°, Amazon, and whatever other retailer portals you're pulling from. TPM system data from SAP TPM, Exceedra, Anaplan, or whatever planning tool your organization uses. Each source has different formats, different hierarchies, different update frequencies. Harmonizing product hierarchies across sources is tedious work that someone has to do.
Timeline reality. Purpose-built platforms with pre-built CPG connectors deploy in 8-14 weeks to first value. Custom builds on Snowflake or Databricks take 12-18 months—and that's if the project stays on track, which enterprise data projects often don't.
What if your data is a mess? Most TPM systems have data quality issues. Missing events. Wrong dates. Incomplete costs. Inconsistent naming conventions. AI doesn't magically fix bad data.
But implementation typically includes a data quality assessment that identifies the gaps. And the discipline of setting up automated analytics often forces data hygiene improvements that should have happened years ago. When you can see exactly which events are missing cost data or have implausible dates, the motivation to fix it increases.
If your event data is 60% complete, you'll get 60%-coverage analytics. That's still better than 0% coverage. And it creates pressure to improve the underlying data because now there's a visible consequence to data quality problems.
Validation approach. How do you know if your incrementality calculations are accurate? Three levels of validation. First, baseline validation: compare model-predicted baselines to actual sales during non-promoted periods. If the model accurately predicts "normal" sales, you can trust its promoted-period baselines. Second, shipment reconciliation: confirm that POS-measured lift patterns align with actual product movement. If POS shows big lift but inventory didn't move, investigate data quality. Third, face validity with business experts: do results align with what experienced trade managers know from the field? If analytics says a promotion worked but the sales team knows execution was terrible, investigate the disconnect.
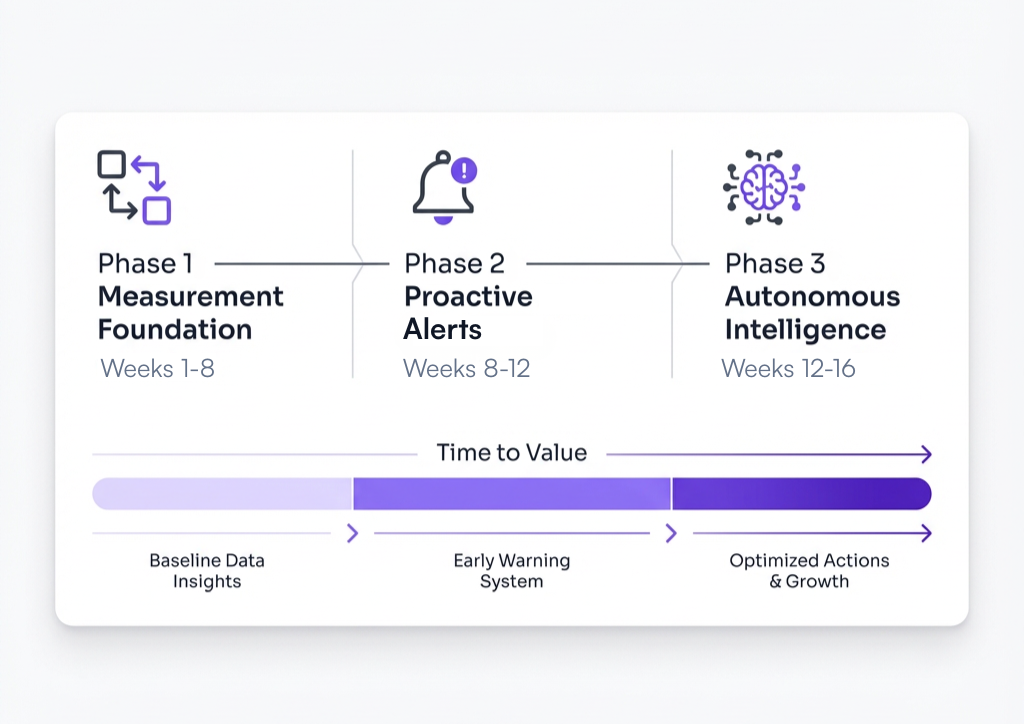
From Reactive to Autonomous: A Practical Progression
You don't jump from reactive to autonomous overnight. The path has three phases:
Phase 1: Establish Measurement (Weeks 1-8)
- Connect data sources (POS, TPM, syndicated)
- Deploy automated ROI calculation for all promotions
- Validate methodology with Finance and Commercial
- Outcome: Consistent measurement foundation that everyone trusts
Phase 2: Enable Proactive Alerts (Weeks 8-12)
- Configure alert thresholds (ROI below target, lift below expectation)
- Route alerts to appropriate owners
- Build review cadence for flagged events
- Outcome: Problems surface automatically without waiting for requests
Phase 3: Activate AI Agents (Weeks 12-16)
- Enable in-flight monitoring against expected lift curves
- Activate autonomous root cause investigation
- Deploy pattern recognition across historical events
- Configure proactive recommendations
- Outcome: Insights before you ask, recommendations you can act on
The Window Is Closing
Trade promotion is the largest controllable expense for most CPG companies. Not the largest expense—that's probably cost of goods sold. The largest controllable expense, meaning the one where allocation decisions actually move the needle.
Every quarter without visibility is another quarter funding the 70% of promotions that lose money. Every planning cycle without accurate measurement is another cycle where the same underperforming tactics get renewed because no one can prove they should be cut.
Bain's 2025 Consumer Products Report found that insurgent brands captured 40% of US CPG growth in the first half of 2024 despite holding far less market share. Part of that is product innovation. Part of that is marketing. But part of it is being faster and more precise with promotional investment—testing, measuring, iterating while larger competitors are still waiting for last quarter's post-event analysis.
The shift from reactive to autonomous isn't incremental improvement. It's the difference between explaining what happened and changing what happens next.
Get release updates delivered straight to your inbox.
No spam—we hate it as much as you do!


Trade Promotion Management (TPM) handles operations: planning events, managing funds, tracking deductions, reconciling spend. Trade promotion analytics answers the next question: did it work? TPM tells you what ran. Analytics tells you what performed. You need both—TPM for execution, analytics for optimization.
Most promotions aren't measured accurately, so underperformers keep getting funded quarter after quarter. Baseline estimates vary by analyst. Cannibalization gets ignored. Pantry loading inflates lift numbers. Without consistent measurement, there's no mechanism to identify and eliminate losing tactics.
Incrementality is the volume that wouldn't have happened without the promotion. It excludes pantry loading (consumers buying earlier than they would have), cannibalization (volume shifted from other SKUs), and baseline sales (what would have sold anyway). True incrementality is smaller than raw lift—often significantly smaller.
Lift is the raw sales increase during a promotion compared to baseline. Incrementality adjusts for effects that don't represent true value creation: pantry loading shifts demand forward in time, cannibalization shifts demand from other SKUs. Incrementality is typically 30-50% lower than lift—which is why promotions that look successful on lift often lose money on true ROI.
Primary sources include syndicated POS data (Nielsen, Circana), retailer-specific data (Walmart Luminate, Kroger 84.51°, Amazon), TPM system data (SAP TPM, Exceedra, Anaplan), and internal shipment data. Hierarchy harmonization across sources is required before analysis can begin.
AI agents are autonomous monitoring systems that continuously analyze promotion performance, detect meaningful changes, investigate root causes, and deliver insights proactively—without waiting for analyst queries or scheduled reports. Unlike dashboards that display data passively, AI agents actively watch your business and surface what matters before you ask.
Reactive analytics responds to requests—you ask, analysts build reports, insights arrive 2-4 weeks later. Proactive analytics automates measurement and sends alerts when issues arise—insights arrive hours after events end. Autonomous analytics uses AI agents to monitor continuously, investigate root causes automatically, and generate recommendations without human prompting—insights arrive during events, while intervention is still possible.
AI agents compare daily POS data against expected lift curves based on historical performance patterns. When performance deviates significantly (e.g., 35% below expectation by Day 4), the agent alerts stakeholders with root cause hypotheses—execution gap, competitive activity, or tactic mismatch—enabling intervention while the promotion is still running and outcomes can still change.
AI calculates ROI as incremental profit divided by total promotion cost. Incremental profit comes from the AI-modeled baseline (what would have sold without promotion) subtracted from actual sales, multiplied by margin, and adjusted for cannibalization and pantry loading effects. The methodology is applied consistently across every event, eliminating analyst-to-analyst variation.
AI models analyze sales patterns across your portfolio during and after promotions, identifying volume declines in related SKUs that correlate with the promoted item's lift. The cannibalized volume gets subtracted from incremental lift to calculate true portfolio impact.
Yes, but with appropriate uncertainty. AI can model historical performance patterns to project how different tactic mixes would perform, showing probability-weighted ranges rather than false-precision point estimates. Recommendations are directional guidance, not guarantees.
Analysis is available within 48 hours of data availability. For syndicated data with weekly lag, that means insights the week after data drops. For retailer data with daily feeds, results can be faster. Compare this to 2-3 weeks for manual analysis.
Minimum requirements: POS data covering promotional periods, promotion event definitions (products, stores, dates, tactics), and trade spend by event. With these three elements, you can calculate baseline, lift, and ROI. Additional data like display compliance or competitive pricing enables more advanced root cause analysis.
Modern platforms provide pre-built connectors to major TPM systems including SAP TPM, Exceedra, and Anaplan. Event definitions, planned spend, and actual costs flow from TPM to the analytics platform. Results can flow back to inform future planning.
Purpose-built platforms deploy in 8-14 weeks to first value. Custom builds on data platforms like Snowflake or Databricks typically take 12-18 months. The difference is pre-built connectors, validated baseline models, and governed ROI frameworks versus building from scratch.
You can build trade promotion analytics on your data platform, but expect to invest in: data integration and hierarchy harmonization, baseline modeling that accounts for seasonality and competitive activity, ROI calculation frameworks with governance, and user interfaces for non-technical users. Purpose-built platforms provide these capabilities out of the box.
Organizations typically see 10-15% improvement in trade ROI by identifying underperforming promotions and shifting spend to high-performing tactics. Additional value comes from reduced analyst time spent on manual analysis (often 60-70% of current effort), faster decision-making during planning cycles, and stronger retailer conversations backed by credible data. Payback period is typically 6-9 months.
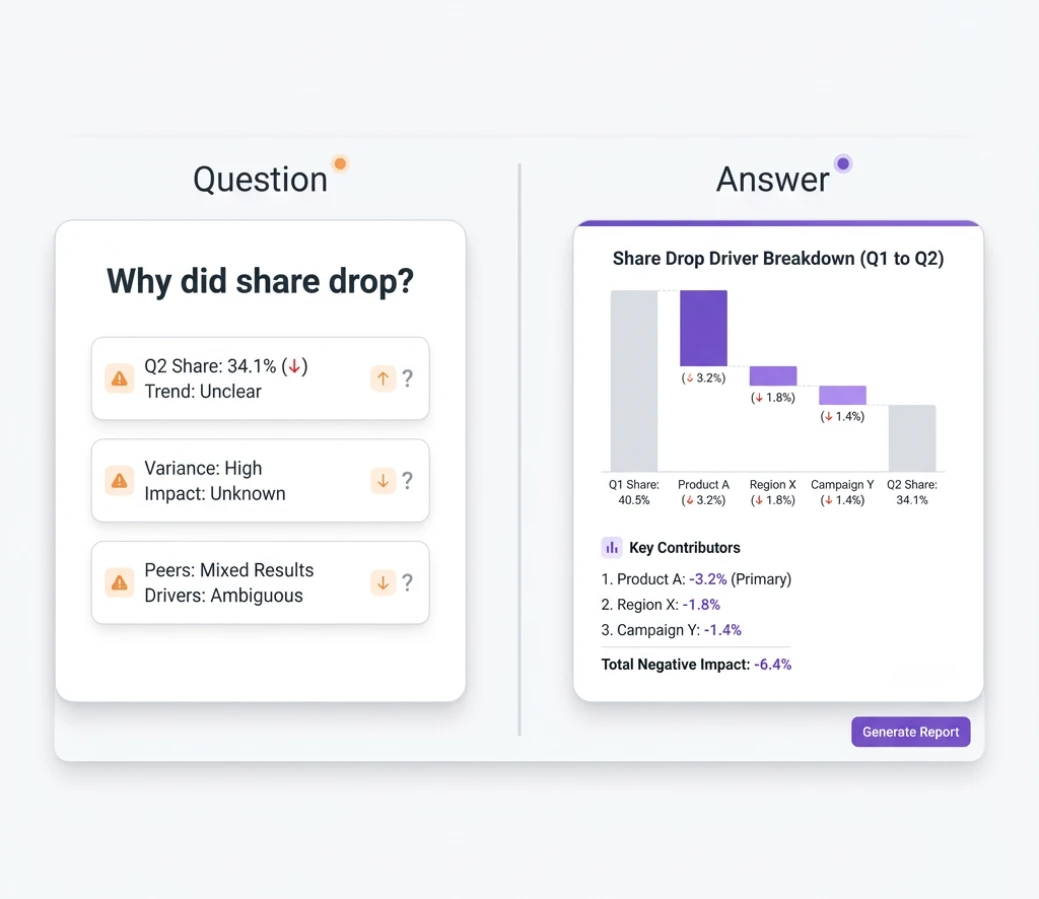
Why Did Market Share Decline? The Decomposition Analysis Most Teams Get Wrong
Most CPG teams can see that market share moved, but not why—because they rely on slow, manual “share analysis” that stops at charts instead of diagnosis. The blog explains how proper market share decomposition should break a change into concrete drivers (distribution, velocity, price/mix, and competitive moves) at retailer, region, and segment level, instead of confusing simple correlations or national averages with true attribution. It shows how AI automates the hard parts—data integration, baseline modeling, and competitive tracking—so brand managers can ask “Why did share drop at Kroger last month?” and instantly see quantified drivers and recommended actions. With this always-on decomposition, teams move from week-long investigations and stale insights to fast, retailer-specific decisions that actually recover and grow share.