What’s Killing Your E-Commerce Revenue Deep Dives (and How Custom Workflows Fix It)


TL;DR
Every e-commerce team has that week.
Someone disappears into Looker, Sheets, and way too much coffee to do a “revenue deep dive.” Three days later, there’s a 60-slide deck, everyone nods through the presentation… and then nothing in the business really changes. And if you’re honest, how many “deep dives” actually change what you do next week?
This blog is about how to stop doing that.
Instead of treating each revenue question like a fresh fire drill, you can turn your best 7-step deep dive into a reusable workflow in Tellius: agent-executed, and fully auditable. Ask a question like “How did revenue perform across our product mix for high-value customers in the last 6 months?” and Tellius Agent Mode runs the exact analysis you’d expect from your best analyst, including trends, mix, correlations, and “what-if” scenarios such as a 10% price increase in top categories.
What is this e-commerce revenue workflow?
.png)
How did revenue perform across our product mix for high-value customers in the last 6 months?
Consider the above question. It’s the kind of question you get all the time: specific enough that someone has to go dig. Kaiya’s Agent Mode reads that intent and then:
- Either triggers the predefined “E-commerce Revenue Deep Dive” workflow you’ve authored, or
- Falls back to Deep Insight to auto-plan a new analytical path.
With a predefined workflow, you can codify a full revenue diagnostic for an e-commerce brand (across product mix, customer segments, and the conversion funnel) into a reusable, parameterized analysis that runs automatically when triggered.
At a high level, you can define the workflow as follows:
.jpg)
- Pull at least the last 6 months of order, product, traffic, and marketing data, and optionally pull the prior 6 months as a comparison period to calculate trends and deltas.
- Compute revenue, net revenue, AOV, CVR, units, margin, and mix-shift by category, collection, and segment using canonical metric definitions in the semantic layer.
- Run correlation and driver analysis to see what actually explains revenue changes (discounting, traffic mix, channel, inventory constraints, etc.).
- Generate narrative, visuals, and recommended follow-ups that a marketing, growth, or merchandising lead can act on without opening SQL or a spreadsheet.
The workflow also exposes all generated SQL and Python so data teams can audit every step, validate joins and filters, and harden or extend the logic.
Once you’ve defined this in plain English and set up relevant triggers, it lives in your custom workflow library. Anyone can re-run it for any time range, region, or customer segment (including high-value customers) without analyst rework.
Why does this custom workflow matter for e-commerce teams?
Because this is the analysis everyone thinks they’re getting from dashboards and almost never are. The workflow matters because it:
- Replaces 3–5 ad-hoc analyses per month with one consistent, governed playbook.
- Eliminates the “three analysts, three numbers” problem caused by different joins, filters, and time windows.
- Makes complex, multi-step analysis (trends, drivers, scenarios) available on demand to non-technical stakeholders.
- Turns one senior analyst’s mental model into a reusable asset that survives promotions and departures..
If you’re an e-commerce VP staring at flat revenue with rising CAC, you don’t need another dashboard. You need a way to ask:
“Where exactly is revenue leaking? Product, price, or conversion? And what happens if we change each lever?”
What business questions does the workflow answer out of the box?
Different stakeholders phrase it differently, but they’re all circling the same core intent: normalize performance across products, segments, and time and identify levers. Are we winning, where are we leaking, and what happens if we pull each lever? Here are example questions this single workflow is designed to handle:
- “How did revenue perform across our product mix in the last 6 months vs. the prior 6?”
- “Which categories drove the biggest absolute revenue gain and loss?”
- “For high-LTV customers, which collections over-index on revenue and margin?”
- “How much of our revenue change came from: price, units, and mix?”
- “What if we increase prices by 10% in our top 3 categories — what happens to revenue and margin under current elasticities?”
The key is that all of these roll up to the same analysis pattern. Parameter changes (time, country, segment, category set) don’t require a new project, just different prompts.
What data does this e-commerce workflow rely on?
This workflow runs against the semantic layer, which encodes your entities, joins, and metric definitions so Kaiya can interpret “revenue performance” correctly.
Canonical metric definitions (in the semantic layer)
- Revenue = sum(order_line_price * quantity)
– excludes tax, shipping, cancelled, and returned orders. - Net Revenue = Revenue – Discounts – Refunds.
- AOV = Revenue / Orders at the requested grain (sitewide, category, segment, etc.).
- Conversion Rate (CVR) = Orders / Sessions, optionally scoped by channel, device, or campaign.
- CLTV = N-period gross profit per customer, with optional cohort normalization.
Semantic relationships and grain
The semantic layer also defines how entities relate and at what grain:
- Orders → Order Lines: one-to-many, order-line grain preserved.
- Orders → Customers: many-to-one, customer grain.
- Products → Categories → Departments: hierarchy with rollup rules.
- Returns → Orders: keyed join that avoids double-counting.
This contract is what ensures “revenue,” “margin,” and “conversion” all resolve to your single source of truth, grounded in your governed definitions and joins.
How Kaiya breaks down your natural language question for this workflow
Example question:
“How did revenue perform for our ‘Essentials’ collection in the US over the last 6 months, and which segments had the highest AOV?”
Kaiya decomposes this into two layers: explicit filters and semantic intent.
1. Explicit filters (pulled straight from the text)
2. Semantic intent (what analysis is implied)
How Tellius solves it step by step: from question to agentic execution
Once the workflow is triggered, Tellius Agent Mode (Kaiya) runs a multi-agent pipeline. Under the hood, it’s a team of specialized agents executing a fixed pattern.
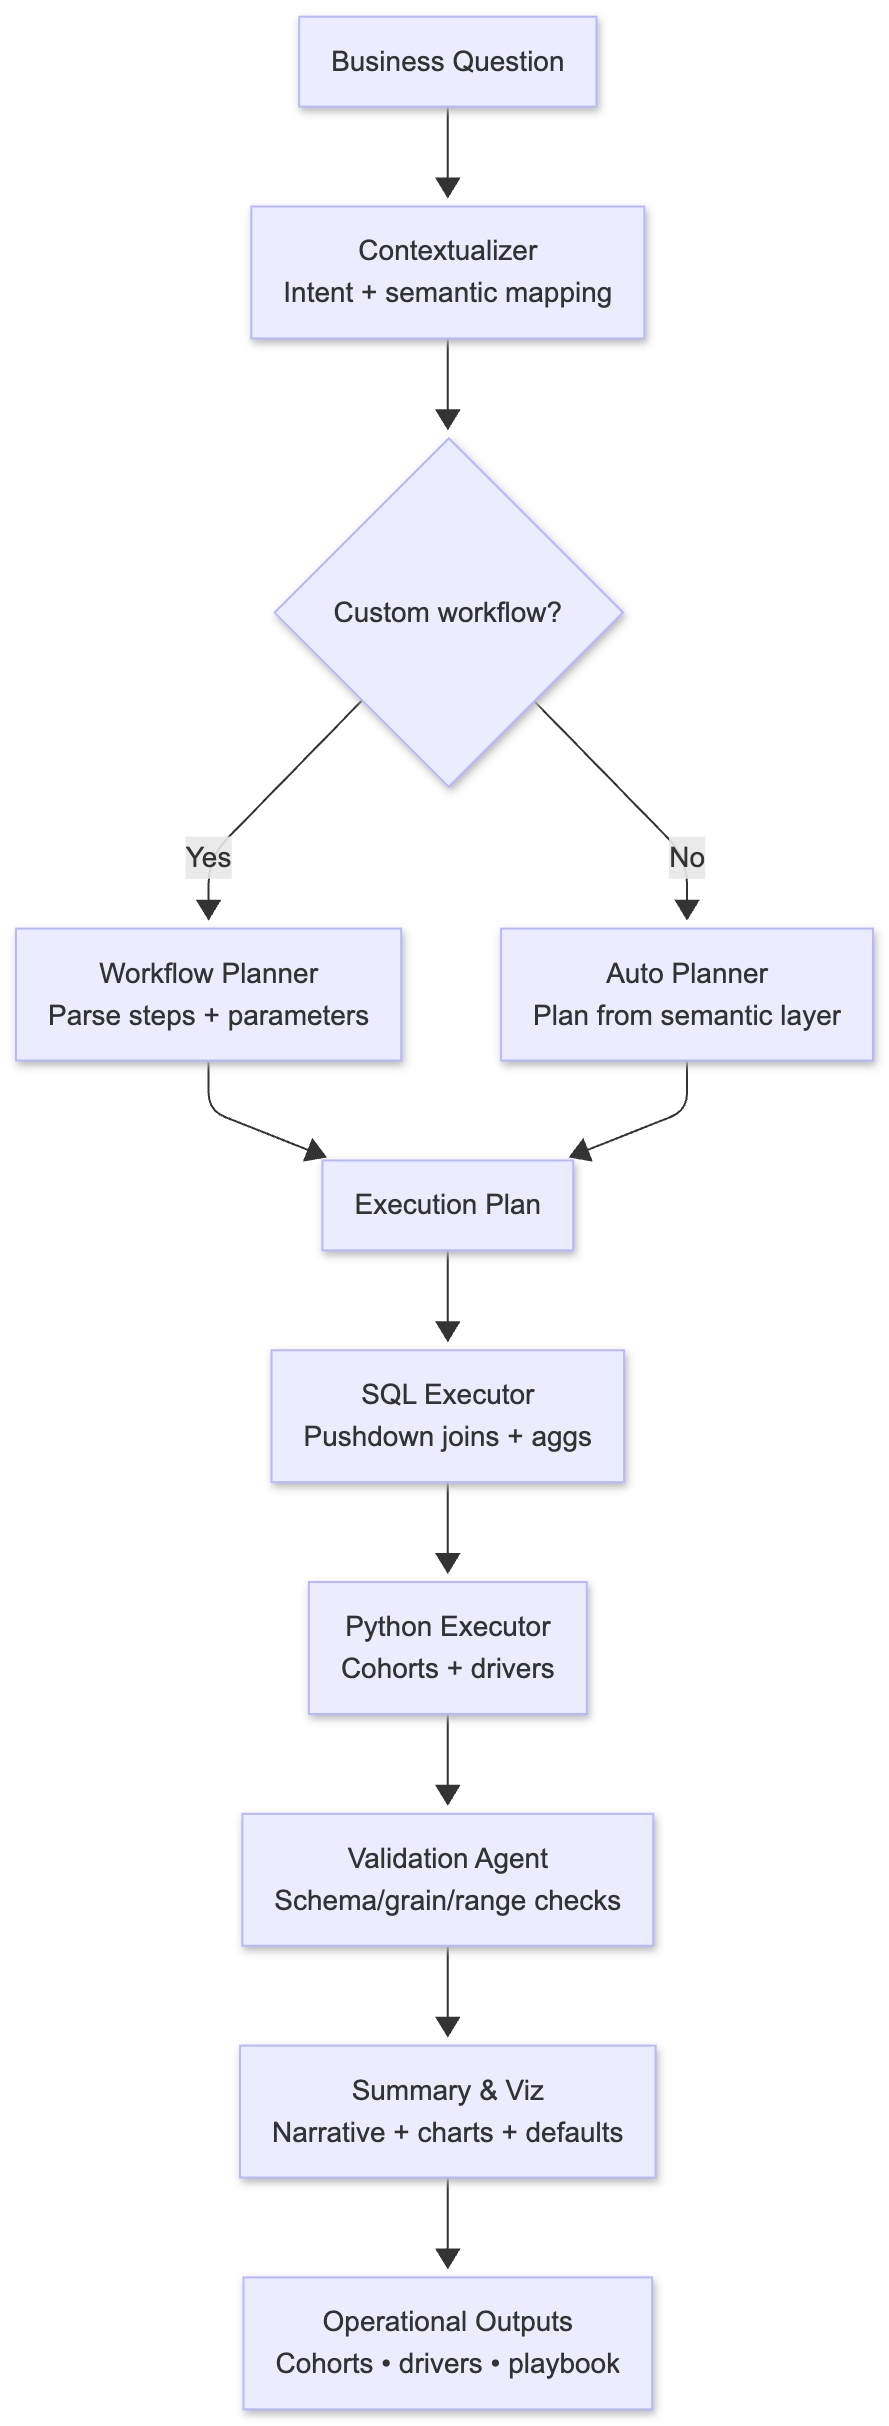
If the user then asks something genuinely novel (e.g., “What if we increase prices by 10% in our top three categories?”) the same architecture routes that follow-up to Deep Insight mode, which plans a fresh analytical path but still reuses the same semantic layer and validation guardrails.
1. Contextualizer (Mapping language to the workflow)
The Contextualizer:
- Recognizes “revenue performance across product mix” as the deep-dive workflow.
- Extracts parameters: time window, regions, collections/categories, customer segment filters.
- Applies defaults when missing (e.g., last 6 months, all regions, all segments) and prints them as part of the reasoning so there are no hidden assumptions.
2. Workflow Planner (Turning expertise into a plan)
The Planner takes your plain-English question and builds a deterministic execution graph before running any queries. Each step specifies inputs, expected grain (category x month x segment), and outputs. This plan is visible before execution, so you can see exactly what will run and catch mistakes early.
3. SQL Executor (Pushdown in the warehouse)
SQL Executor then generates SQL against your semantic model to:
- Aggregate revenue, units, sessions, spending by the required grains.
- Join orders ↔ products ↔ customers ↔ campaigns using semantic joins.
- Apply time windows, region filters, and row-level security policies.
It then pushes segmented aggregations (category x segment x month) and baseline vs. comparison period tables with the right keys.
It keeps data volume sane by aggregating at the right grain in-warehouse before shipping results into the Python layer. All generated SQL and plans are exposed. Analysts can see the exact joins, filters, and WHERE clauses that drove the answer.
4. Python Executor (Explaining what happened and modeling what-if scenarios)
SQL can aggregate numbers. Python explains why they changed.
Revenue decomposition: Splits total revenue change into volume (more/fewer units), price (higher/lower realized price), and mix (category shifts). This answers "Did we grow by selling more, charging more, or shifting to premium products?"
Driver analysis: Runs correlations between revenue/AOV/CVR and discount depth, traffic by channel, campaign spend, and inventory stockouts. This surfaces which levers actually move the needle vs. which are just noise.
Scenario modeling: When you ask "What if we increase prices 10% in our top 3 categories?" it estimates demand elasticity from historical price vs. volume patterns, then runs three scenarios:
- Constant volume, +10% price (optimistic)
- Elastic volume based on learned elasticity (realistic)
- Aggressive elasticity (stress test)
Each scenario outputs revenue and margin deltas by category. All of this runs in standard Python (pandas, numpy, scipy) in a controlled environment. The generated code is visible.
5. Validation Agent (Catching bad data before bad decisions)
The Validation Agent runs blocking checks before any results reach stakeholders:
Schema & grain checks verify expected columns exist and aggregates don't accidentally double-count from join explosions.
Range checks flag impossible values: negative units, AOV in the millions, zero orders but non-zero revenue, discounts or margins outside configured bounds.
Scenario sanity checks catch when inferred elasticities would imply absurd outcomes (like -95% volume drop for a 10% price increase).
If any check fails, the workflow stops and returns a clear error explaining what broke, where, and why. No more debugging screenshot disasters in board meetings.
6. Summary & Visualization (The final output with all the deets)
The Summary agent assembles:
Visuals: Revenue trend by category and segment. Waterfall of revenue change (volume vs price vs mix). Bar charts ranking top gaining/losing categories. Scenario results showing revenue and margin deltas for price changes.
Narrative in business language: "Total revenue grew 12% vs. the prior 6 months. 9 percentage points came from increased units in 'Athleisure' and 'Basics' collections, 3 percentage points from higher realized prices, while mix shifts reduced revenue by 2 points due to a move into lower-margin sale items."
"If prices increase 10% in 'Premium Outerwear' and 'Sneakers' categories, expected revenue rises 6–8% and margin by 9–11%, assuming historical elasticities hold."
Assumptions printed inline: Time windows used, inclusion/exclusion rules for returns and cancellations, elasticity priors applied in scenarios. No hidden black-box decisions.
Who uses this workflow and what decisions it drives
VP of E-commerce: Weekly revenue reviews. Instead of waiting for Monday's deck, gets analysis in 5 minutes on a Sunday night. Makes inventory and promotion decisions before competitors react.
Category Managers: Daily category performance. Sees which SKUs are underperforming, which have pricing power, where to adjust inventory.
Marketing Directors: Channel attribution with product mix overlay. Understands if paid search decline is universal or specific to certain categories. Adjusts bid strategies accordingly.
CFO: Builds board slides with actual drill-down paths. Board member asks about Q2 variance? Clicks through three levels to show exactly which region, category, and price band drove it.
Get release updates delivered straight to your inbox.
No spam—we hate it as much as you do!


Yes. The workflow is triggered from natural language questions. The technical complexity (SQL, Python, elasticities) stays behind the scenes, but your data team can still pop the hood and inspect everything when they want to.
Dashboards show just the current state. They hide the actual logic behind three layers of BI configs. Dashboards are great… Right up until someone asks a question they weren’t designed for. This workflow explains WHY it happened and lets you test what-if scenarios. Most importantly, it encodes your best analyst's thinking so the analysis runs the same way every time, not three different ways by three different people.
That’s exactly why this runs on a semantic layer. You encode your definitions once (including edge cases like cross-border orders and partial refunds) and the agents re-use them every time. Cleaning that up is a one-time investment.
Most teams can stand up a usable first version in 1–2 weeks by reverse-engineering an existing “hero” analysis (usually living in a spreadsheet or slide deck) and expressing its steps in plain English.
Scenarios are built on inspectable Python code using your historical data. Your data science team can also bring their own elasticity models or guardrails, and Tellius will execute them as part of the workflow. The executed steps will be displayed in the Reasoning section, where you can see the thought process of Tellius Kaiya to reach the decision.
Ready to turn your 3-day revenue scramble into a 5-minute workflow? Schedule a demo. We'll run a deep dive specific to your business in a live session and show you exactly how much time you'll save next quarter.
.png)
Agents vs. Workflows. Why not both?
AI agents and workflow automation are often treated as competing approaches, but the real power emerges when they work together. As agents evolve from simple chatbots to autonomous decision-makers and automation platforms become more intelligent and flexible, organizations can combine both to achieve higher reliability, faster execution, and deeper insights. This post breaks down the agent and automation spectrums, explains why Mode 1 (Execute) and Mode 2 (Explore) are both essential, and shows how their convergence enables smarter, safer, and more scalable AI-driven operations.
%20(37).webp)
Introducing Tellius Agent Mode: Agentic Analytics That Actually Does the Work
In today’s data-rich world, asking questions is no longer enough—what matters most is taking action. This blog introduces Tellius Agent Mode, a transformative leap into agentic analytics where AI agents don’t just answer queries—they plan, analyze, explain, and act. You’ll learn how Tellius marries a semantic layer, multi-agent orchestration, and business context to create an analytics ecosystem that moves beyond dashboards. With Agent Mode, you can automate multi-step workflows like root-cause detection, forecasting, and scenario planning—all through conversational goals. The result? Analysts elevate their focus to strategy while operational teams get trusted insights when they need them. Whether you're scaling analytics across sales, finance, or supply chain, this blog shows why Agent Mode is the architecture ready for enterprise intelligence at the speed of decision.
Introducing Tellius AI Agents
Tellius AI Agents and AgentComposer transform business analytics by automating complex multi-step analysis through specialized autonomous agents. Unlike generic chatbots or RPA tools, these agents leverage your enterprise data and business context to deliver deep insights across sales, marketing, finance, and manufacturing—turning questions into actions in minutes instead of days. With no-code agentic workflows, organizations can achieve 100X productivity gains and continuous, data-driven decision making.