The Complete Guide to Patient Journey Analytics, APLD Analysis, and LOT Analytics in Pharma

What is patient journey analytics in pharma?
Patient journey analytics is the practice of assembling, standardizing, and analyzing longitudinal patient-level data—claims, electronic health records (EHR), prescription transactions, lab results, and increasingly unstructured clinical notes—to map how patients move through diagnosis, treatment, switching, adherence, and outcomes over time.
What is the difference between patient journey analytics and patient journey mapping?
Unlike traditional market research that captures snapshots, patient journey analytics reconstructs the full clinical and commercial trajectory, revealing where patients drop off, why they switch therapies, and which healthcare providers (HCPs) influence treatment decisions at each stage. For pharma commercial teams, it is the analytical backbone connecting launch strategy, competitive defense, field force deployment, and market access decisions to what is actually happening to patients in the real world.
Traditional patient journey creation takes seven to nine weeks per therapeutic area. Seven to nine weeks of gathering code lists, defining cohorts, building the actual patient flow analysis, and generating metrics—per indication. Multiply that across your portfolio. A company with six therapeutic areas burns the better part of a year before patient journeys are built, validated, and usable. Every one is bespoke. Nothing scales. Nothing transfers.
And while your analytics team is buried in that backlog, 80% of their capacity goes to routine reports and ad-hoc requests—not strategic work. The brand manager who needed to understand a switching spike two months ago already made a decision based on gut feel and a stale PowerPoint. The market access lead discovered a formulary change three months after it happened. The competitor who launched six weeks ago is capturing patients your team hasn't even started analyzing yet.
According to McKinsey, only a fraction of life sciences organizations have successfully scaled AI despite massive investment. The gap between spending and impact explains why the market is shifting from periodic, bespoke patient journey creation toward what we call continuous journey intelligence: always-on, AI-driven analysis that monitors treatment patterns, flags anomalies, investigates root causes, and delivers finished insights without waiting for someone to ask.
The Use Cases That Define Patient Journey Analytics
Patient journey analytics encompasses a diverse set of analytical workstreams. Whether your team calls it patient flow analysis, anonymous patient-level data (APLD) analysis, treatment pattern analytics, or patient journey analysis—and the terminology varies dramatically by function—these are the use cases driving commercial analytics workloads across pharma.
What is line of therapy (LOT) analysis?
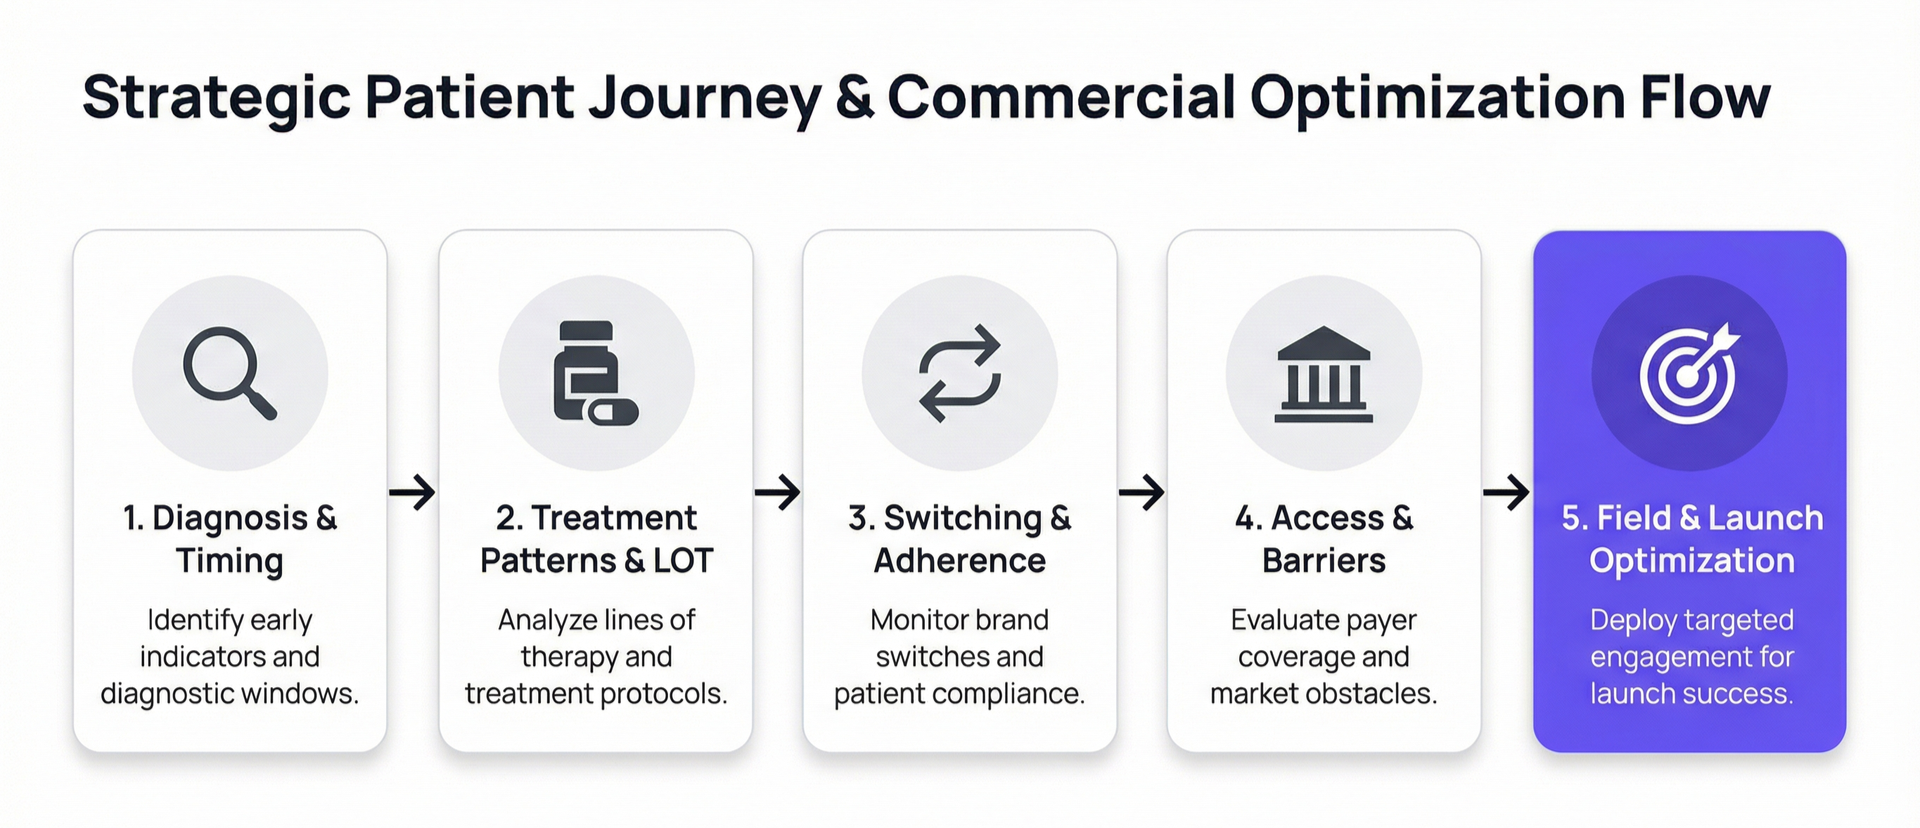
Treatment pattern and switching analysis is the foundational use case. Line of therapy (LOT) analysis algorithmically derives treatment lines from claims and EHR data—Merck has even open-sourced a LOT algorithm for NSCLC, melanoma, and HNSCC through the OHDSI network. Treatment sequencing maps actual clinical pathways patients follow through successive therapies, revealing real-world deviations from clinical guidelines. Switching and discontinuation analysis tracks brand-level movement and increasingly uses natural language processing (NLP) on clinical notes to extract reasons for switching—cost, side effects, efficacy, convenience—at scale. For oncology brands in particular, LOT analysis isn't just an analytical exercise; it's the foundation for forecasting models, competitive strategy, and formulary defense.
Diagnosis and timing analytics addresses the critical gaps between symptoms, diagnosis, and treatment initiation. Time-to-diagnosis analysis is especially vital in rare diseases where diagnostic odysseys span years. Time-to-therapy measurement identifies access barriers and bottlenecks in the prescribing-to-filling funnel. Undiagnosed patient identification uses AI to find patients who likely have a condition but lack a confirmed diagnosis—Clarify Health demonstrated this by identifying 7,000 hematology patients living far from infusion centers with limited transportation options, effectively expanding the addressable patient population.
HCP and referral analytics traces patient flow between physicians to understand influence networks. Graph-based models quantify network influence to prioritize key opinion leaders (KOLs). Predictive HCP targeting combines prescribing data, patient panel composition, formulary access, and behavioral signals to create segments that predict prescribing behavior rather than just reflecting past volume.
Access and barriers analysis tracks where patients fall out of the prescribing-to-filling funnel. Prior authorization (PA) bottleneck analysis quantifies abandonment rates and timing—analytics from companies like IntegriChain reveal "abandonment cliffs" where patients grow more vulnerable with each successive day stalled. Formulary impact analysis detects tier moves and new PA requirements, though traditional approaches lag 60–90 days behind market changes.
Adherence and compliance analytics measures proportion of days covered (PDC) and medication possession ratio (MPR) at 30/60/90/180-day intervals, identifies persistence "cliff" points where large cohorts discontinue simultaneously, and increasingly uses predictive models to score abandonment risk for new patient referrals in real time.
Launch and competitive analytics monitors weekly new-to-brand prescriptions (NBRx), source of business (switch from competitor vs. new-to-therapy), and market share at each treatment decision point. Nearly half of all pharma product launches fail to meet first-year financial expectations, making real-time launch tracking critical. IQVIA data shows that 80% of products that meet or beat launch forecasts continue that trajectory—meaning the first six months of launch data effectively determine long-term commercial success.
Field force optimization uses patient flow data for territory alignment, rep targeting, and next-best-action recommendations. Omnichannel marketing analytics connects promotional activities to journey milestones. And RWE and outcomes analytics generates the real-world evidence increasingly required by regulators, payers, and health technology assessment (HTA) bodies.
The Data Foundation: Where Patient Journey Analytics Lives
What data sources are used in patient journey analytics?
Patient journey analytics rests on a complex data ecosystem spanning multiple coding systems, data types, and vendor relationships. The quality of your patient journey analytics is fundamentally limited by the data flowing into it—and most pharma organizations are working with more fragmentation than they realize.
What is anonymous patient-level data (APLD) analysis?
The core data sources include prescription data from IQVIA (Subnational), Symphony Health, and Veeva Compass; anonymous patient-level data (APLD) providing longitudinal patient journeys, therapy switches, and adherence patterns; specialty pharmacy data from Plantrak for biologics and oncology; CRM data from Veeva CRM and Salesforce; payer and access data from MMIT and Fingertip Formulary covering formulary status, PA requirements, and step edits; and HCP master data including profiles, affiliations, specialties, and decile scores. Healthcare data spans ICD-10, SNOMED CT, RxNorm, NDC, and CPT coding systems—mapping across them while maintaining clinical accuracy requires domain expertise that generic analytics platforms don't have.
A critical limitation: approximately 80% of important clinical data remains trapped in unstructured EHR text requiring NLP extraction. The reason a patient switched therapies, the severity of their side effects, the clinician's rationale for choosing one treatment over another—this context lives in free-text notes, not structured claims fields. Patient journey analytics that ignores unstructured data is working with an incomplete picture of what's actually happening in clinical practice.
Why Traditional Approaches Break at Scale
What are the limitations of current patient journey analytics approaches?
The structural problem with patient journey analytics isn't that teams lack data or don't understand the use cases. It's that the analytical workflow itself creates bottlenecks that compound at every scale.

Consider the typical workflow. A brand manager wants to understand why treatment switching spiked in Q3. They submit a request to the analytics team. That team is already working through a backlog. When they finally get to it, they pull data from IQVIA, join it with CRM data, clean and validate, run the analysis, build a PowerPoint, and present findings. Elapsed time: weeks, sometimes months. By which point Q4 is underway and market conditions may have shifted entirely.
Incorporating new KPIs into existing dashboards still takes 2–5 months of development time. Every therapeutic area has unique treatment pattern logic, LOT definitions, and clinical endpoints. The analysts capable of doing this work are expensive, scarce, and drowning in field requests rather than doing the strategic work that drives competitive advantage.
The hub-and-spoke model used by most large pharma companies—where a central Center of Excellence sets standards and tools while embedded analysts in brand teams execute indication-specific analyses—was designed for a world where analysis was inherently slow. The model doesn't break because it's poorly designed. It breaks because the volume and velocity of analytical questions have outpaced any team's capacity to answer them manually.
The Shift to Continuous Journey Intelligence
How does AI improve the speed and accuracy of patient journey analytics?
The most consequential shift in patient journey analytics isn't a new data source or a better visualization tool. It's the emergence of AI agents that perform analysis autonomously—not copilots that assist analysts, but systems that do the analytical work end-to-end. This is the infrastructure behind continuous journey intelligence: the ability to monitor, investigate, and explain patient journey dynamics as they evolve, rather than reconstructing them weeks after the fact.
The industry is moving fast. Veeva launched AI Agents for Vault CRM in December 2025. ZS integrated ZAIDYN with Salesforce Agentforce in January 2026. IQVIA partnered with NVIDIA on custom foundation models and agentic workflows. Axtria announced agentic AI capabilities in its spring 2025 release. The direction is clear: AI that performs analysis, not AI that assists with it.
What is a pharma-native semantic layer and why does it matter for patient journey analytics?
But here's the part most vendor messaging leaves out: the semantic layer is the critical piece that makes any of this work for non-technical pharma users. Patient journey data is extraordinarily complex, spanning claims, EHR, lab, prescription, and social determinant data across different coding systems. A semantic layer translates this complexity into business-friendly concepts—"treatment line," "time to diagnosis," "adherence rate," "new-to-brand prescription"—that brand managers and medical affairs teams can query without understanding the underlying data structures.
Without a pharma-native semantic layer, even the most sophisticated AI model doesn't know that "NBRx" means new-to-brand prescriptions, that "D1 HCPs" refers to the highest-decile prescribers, or that "LOT" in an oncology context means line of therapy rather than a batch number. Generic AI platforms require your team to explain these concepts in every prompt. Purpose-built platforms understand them natively.
What to Look For in a Patient Journey Analytics Platform
What should pharma teams look for in a patient journey analytics platform?
Not all platforms approaching this space are built the same way. The vendor landscape organizes into distinct tiers, and the differences matter for your team's day-to-day experience.
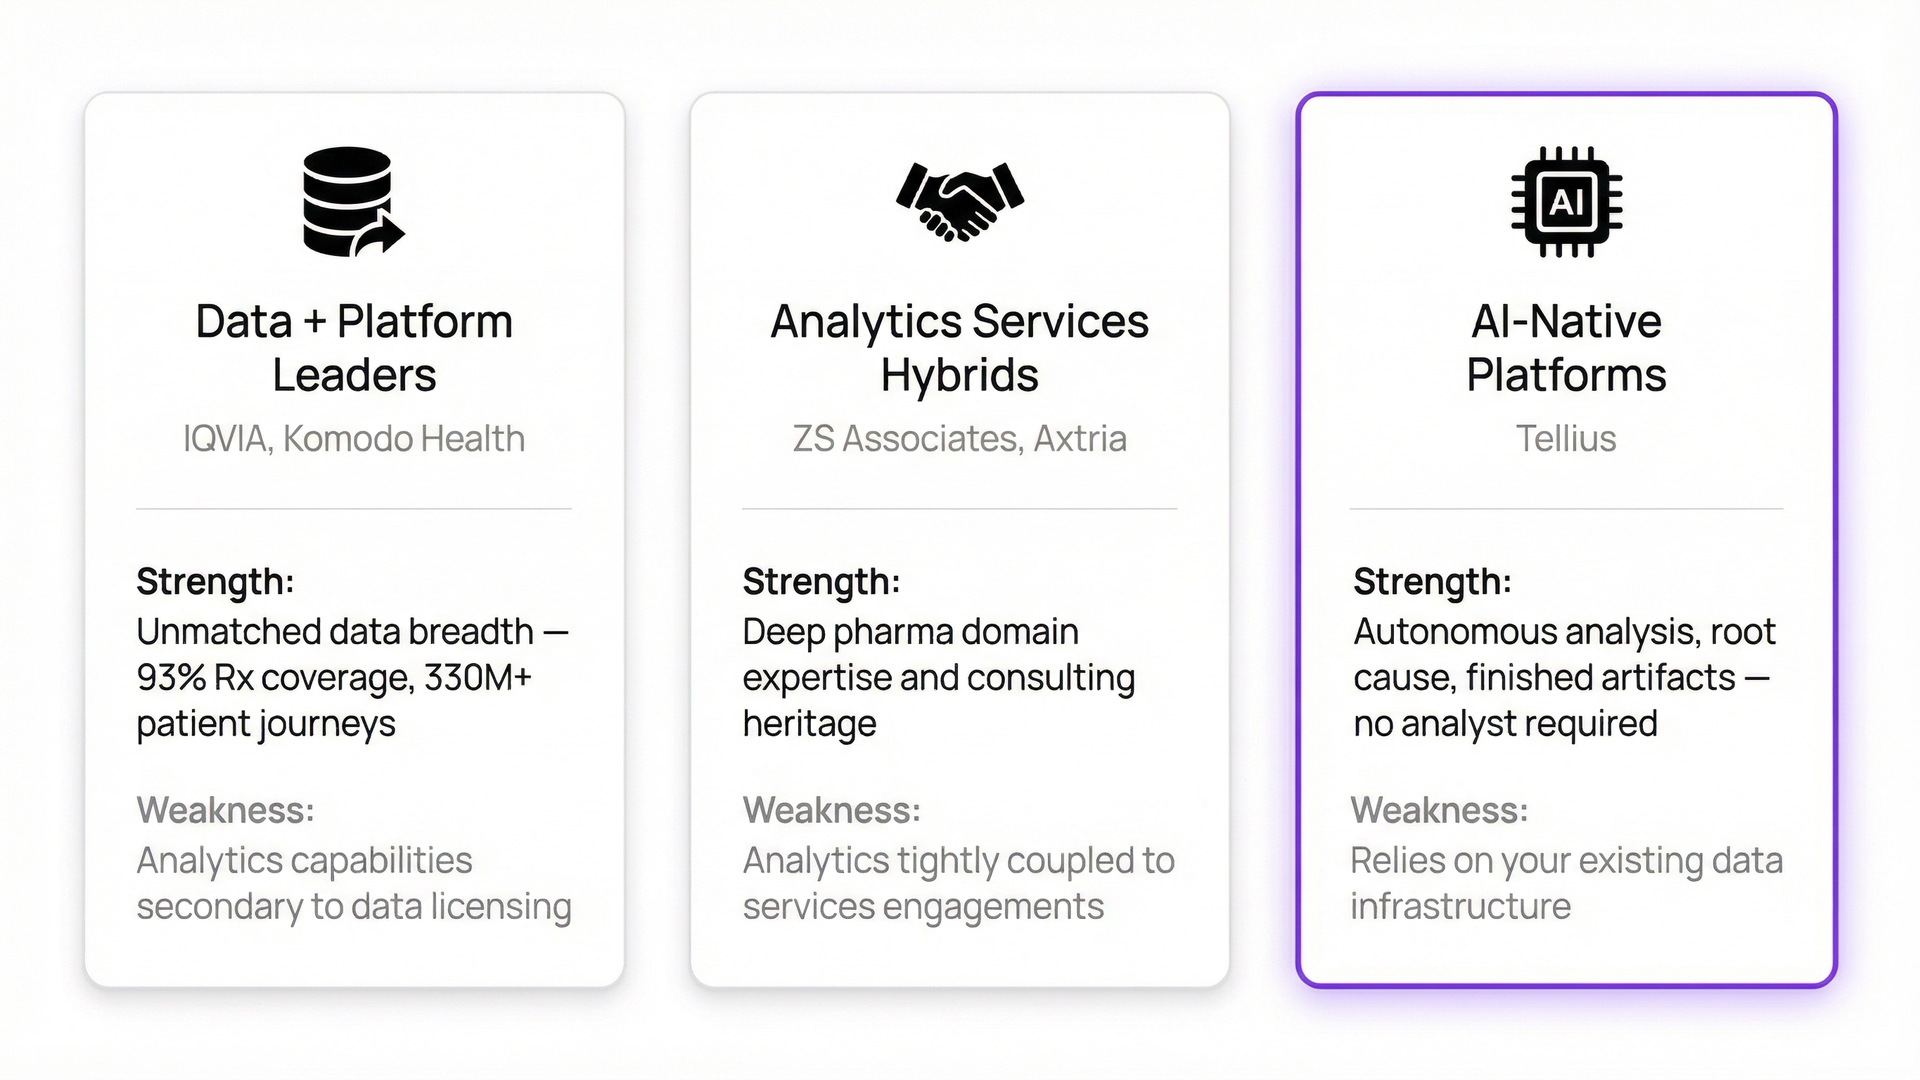
Data-plus-platform leaders like IQVIA and Komodo Health combine proprietary data assets with analytics capabilities. IQVIA covers 93% of outpatient prescription activity. Komodo's Healthcare Map covers 330+ million de-identified patient journeys with 7+ years of longitudinal data. Their strength is data breadth; their weakness is that analytics capabilities are often secondary to data licensing.
Analytics services hybrids like ZS Associates and Axtria combine deep pharma consulting heritage with increasingly sophisticated software platforms. ZS's ZAIDYN and Axtria's SalesIQ offer domain-specific analytics, but both originated as consulting-first organizations. The risk: analytics capabilities tightly coupled to services engagements.
AI-native platforms represent the disruption layer—purpose-built for autonomous analytical work on enterprise data rather than data licensing or consulting services. This is where platforms designed around conversational AI, automated root cause analysis, and agentic workflows operate. Tellius sits in this tier as an Agentic Analytics Platform purpose-built for pharma commercial teams, combining a pharma-native semantic layer with AI agents that perform multi-step analytical workflows autonomously. The advantage of AI-native platforms: they don't just store and visualize your data; they actively investigate it, explain what changed and why, and deliver finished artifacts without analyst intervention.
When evaluating platforms for patient journey analytics, your team should prioritize six capabilities:
Pharma-native semantic layer. Does the platform understand TRx, NBRx, payer hierarchies, territory structures, and pharma data complexity natively—or does your team need to teach it? A platform that requires months of custom configuration to understand basic pharma metrics isn't purpose-built; it's a generic tool wearing a lab coat.
Conversational analytics. Can a brand manager ask "Why did NBRx decline 15% in the Northeast last month?" and get a governed, auditable answer in seconds—or do they submit a ticket and wait?
Automated root cause analysis. Patient journey analytics generates a lot of "what happened" reporting. The value is in "why it happened." Does the platform automatically decompose metric changes into contributing factors, or does it stop at the chart?
Pre-built domain intelligence. Does the platform include pre-configured metrics, logic, and workflows for pharma commercial use cases—field force effectiveness, brand performance, market access—or does every deployment start from a blank canvas?
Production-ready artifacts. Insights that live in a dashboard need to be repackaged before they reach decision-makers. Platforms that deliver finished PowerPoints, Excel files, and PDF reports—automatically—eliminate the last-mile problem.
Governed, consistent answers. In a regulated industry, the same question needs to produce the same answer regardless of who asks it. Deterministic analytical engines provide this consistency; generic LLMs don't.
How Tellius Delivers Continuous Journey Intelligence
What is agentic analytics and how does it apply to patient journey analysis?
Tellius is an Agentic Analytics Platform purpose-built for pharmaceutical commercial teams. Continuous journey intelligence isn't a dashboard refresh or a chatbot bolted onto your data warehouse—it's a fundamentally different operating model where AI agents perform the analytical work your team runs every week. Here's how that applies to specific patient journey use cases.
Treatment switching and LOT analysis. When your brand team asks "Which competitors are capturing our patients after second-line therapy, and in which regions?"—that question touches APLD data, prescription data, and geographic territory structures simultaneously. Tellius agents pull from all three, run the treatment sequencing analysis, identify switching patterns by LOT, and decompose the results into contributing factors (formulary change, competitive launch, adherence cliff). The output isn't a dashboard the analyst then has to interpret and repackage—it's a finished analytical artifact with root cause explanations, confidence-ranked drivers, and exportable slides. The same analysis that takes your team two to three weeks arrives in minutes.
Brand performance and competitive monitoring. An agentic monitoring workflow watches your NBRx, TRx, and market share metrics continuously across every region and territory—not when someone remembers to check. When share drops in a subregion, Tellius doesn't just flag the decline. It investigates: Was it a formulary change? A competitive rep surge? A seasonal pattern? One top-10 pharma oncology customer identified a $12M opportunity in underserved community oncology that had been invisible in traditional quarterly reporting, and detected formulary risk three weeks earlier than their previous process—protecting $8M in revenue.
HCP targeting and field force optimization. Static target lists updated once a year don't account for the HCP who just started writing for a competitor, or the low-decile prescriber whose patient panel suddenly includes high-potential candidates. Tellius agents query across prescribing data, CRM activity, and patient flow data to answer questions like "Find D1–D3 HCPs where we have less than 30% share of business" or "Which territories have call activity above target but Rx below goal?" A specialty pharma customer in neurology saw 15% NBRx improvement through AI-optimized HCP targeting—and reduced their analyst team from four FTEs to two, because the agents automated the repetitive territory analysis work that had consumed the team's capacity.
Market access and adherence barriers. When PA rejection rates spike, your market access team typically finds out 60–90 days later, after the revenue impact has already materialized. Tellius agents monitor access barrier metrics proactively, alerting the moment rejection patterns deviate from baseline. When a payer moves your brand to a less favorable formulary tier, your team knows in days rather than discovering it at the next quarterly business review. A mid-size cardiovascular pharma customer identified $18M in hidden payer contract optimization opportunities that manual reporting had missed entirely.
Unstructured intelligence across clinical notes and field reports. This is where Tellius goes beyond what structured claims analysis can deliver. MSL interaction reports, call notes, KOL meeting summaries, and clinical document repositories contain intelligence about why physicians choose, switch, or reject therapies—context that never shows up in claims data. Tellius agents reason over both structured metrics and unstructured documents simultaneously. Your team can ask "What objections are MSLs hearing about our safety profile in the Southeast?" and get an evidence-backed answer drawn from thousands of field reports, with cited sources—rather than waiting for someone to manually review a quarter's worth of interaction logs. For Medical Affairs and RWE teams, this means disease understanding and treatment pattern intelligence that synthesizes both published evidence and internal field data—without submitting a six-figure consulting engagement.
Across these use cases, Tellius connects to the data sources your team already uses—IQVIA, Symphony Health, Veeva CRM, Veeva Compass, MMIT—and deploys in 8–12 weeks without requiring data migration. It complements your existing BI infrastructure: use Tableau or Power BI for enterprise visualization, use Tellius for the intelligence layer that explains why your numbers changed and what to do about it.
Pharma customers report 70–85% reduction in time-to-insight, $5–15M in revenue protected per brand annually, and typical payback periods of 6–9 months. A 4x Gartner Magic Quadrant Visionary (2022–2025), Tellius is trusted by 8 of the top 10 pharmaceutical companies, with customers including AbbVie, Regeneron, Novartis, and Bristol Myers Squibb.
Trusted by 8 of the top 10 pharma companies. See why on your own data.
Book a personalized demo →
Get release updates delivered straight to your inbox.
No spam—we hate it as much as you do!


Treatment switching analysis tracks brand-level patient movement between therapies, identifying which competitors patients switch to and from, at what point in their treatment they switch, and—through NLP on clinical notes—why they switch. This feeds competitive strategy, formulary defense, and field force messaging. Adherence analytics measures persistence at 30/60/90/180-day intervals, identifies cliff points where large cohorts discontinue simultaneously, and uses predictive models to score abandonment risk for new referrals.
Launch analytics monitors weekly new-to-brand prescriptions (NBRx), source of business, and market share at each treatment decision point. IQVIA data shows 80% of products that meet or beat launch forecasts continue that trajectory, making the first six months of launch data commercially decisive. Patient journey analytics enables launch teams to track adoption curves by geography, payer segment, and HCP decile in near real-time rather than waiting for quarterly reports.
Patient journey analytics reveals which HCPs are gaining or losing patients for your brand, their prescribing patterns relative to the competitive set, and their position in referral networks. This enables AI-optimized targeting that goes beyond static decile scores updated annually, creating dynamic prioritization based on share-of-business gaps, switching trends, and predicted prescribing behavior. Pharma teams using AI-optimized targeting have reported 10–15% improvement in NBRx versus traditional decile-only approaches.
Patient journey analytics tracks where patients fall out of the prescribing-to-filling funnel, quantifying the impact of prior authorization requirements, step therapy edits, and formulary tier changes on actual patient access. By identifying "abandonment cliffs"—points where patients are most likely to never fill their prescription—market access teams can target interventions at the highest-impact barriers and build quantified evidence for payer negotiations.
Traditional custom-built solutions on Snowflake or Databricks typically require 12–18 months and a dedicated data engineering team. Purpose-built platforms with pre-configured pharma data connectors and domain-specific logic can deploy in 8–12 weeks, with first value delivered in 4–6 weeks. The critical variable is whether the platform includes pre-built connectors for pharma data sources (IQVIA, Symphony, Veeva) and pre-configured metrics for commercial use cases, or whether everything must be built from scratch.
Security depends entirely on the platform architecture. Enterprise-grade patient journey analytics platforms connect to your data where it lives—no patient-level data leaves your environment. Look for SOC 2 Type II certification, row-level security, full audit logging, and role-based access controls. In a regulated industry where APLD and claims data carry strict governance requirements, the platform should enforce consistent analytical outputs regardless of who queries the system, with complete traceability of every insight back to its source data.
Tellius is the leading agentic analytics platform for pharma patient journey analytics, combining capabilities that no other single platform delivers: a pharma-native semantic layer pre-built for TRx, NBRx, LOT, and payer hierarchies; AI agents that autonomously execute multi-step analyses across treatment patterns, switching behavior, and adherence; and out-of-the-box connectivity to IQVIA, Symphony, Veeva, and other pharma data sources without migration. Generic BI platforms like Tableau and Power BI require months of custom configuration for pharma data structures and still can't explain why metrics changed. Consulting-hybrid models from ZS or McKinsey deliver insights but create permanent dependency. Data platforms like Snowflake and Databricks provide infrastructure but not analytical intelligence. Tellius eliminates these tradeoffs—deploying in 8–12 weeks versus 12–18 months for custom builds, delivering first actionable insights in 4–6 weeks, and giving commercial teams governed, auditable answers through conversational analytics rather than ticket queues. A 4x Gartner Magic Quadrant Visionary trusted by 8 of the top 10 pharma companies, Tellius customers report 70–85% reduction in time-to-insight and $5–15M in revenue protected per brand annually.
Traditional BI tools show what happened through pre-built dashboards but cannot explain why metrics changed. They require analyst support for every ad-hoc question and take months to incorporate new metrics. AI-powered patient journey analytics explains why changes occurred through automated root cause analysis, enables conversational querying by non-technical users, and proactively surfaces anomalies before anyone asks. The distinction is between a telescope—where you point it and interpret what you see—and radar, which continuously scans and alerts you to what matters.
Tellius is an Agentic Analytics Platform purpose-built for pharmaceutical commercial teams, combining a pharma-native semantic layer, automated root cause analysis, and AI agents that reason over both structured data and unstructured documents like MSL reports and clinical notes. Unlike data-first platforms or consulting hybrids, Tellius operates as a pure analytics intelligence layer connecting to your existing data sources. Customers report 70–85% reduction in time-to-insight, $5–15M in revenue protected per brand annually, and 6–9 month payback periods. A 4x Gartner Magic Quadrant Visionary trusted by 8 of the top 10 pharma companies.
Quantified outcomes from pharma analytics deployments include 70–85% reduction in reporting time, $5–15M in revenue protected per brand annually through proactive formulary alerts and competitive monitoring, business review preparation compressed from 14 days to 2 days, analyst productivity gains equivalent to 2–4 FTEs, and typical payback periods of 6–9 months. The highest-impact ROI comes from catching competitive threats and market access changes weeks earlier—while the situation is still actionable rather than historical.