From Metrics to Meaning: The Evolution of the Semantic Layer in the Age of Agentic AI
.png)
TL;DR
- Old, passive semantic layer must evolve into a contextual semantic layer: governed metrics + ontology + knowledge graph (KG) + memory + LLM orchestration.
- This evolution lets an agent plan the right workflow (“what/why/compare/recommend/forecast”), show its work, and keep answers within governance and security guardrails.
- Evidence matters: studies show LLMs struggle with long context unless we structure memory, and asking over a knowledge graph improved accuracy from 16% to 54% in an enterprise benchmark. (arXiv, ACM Digital Library)
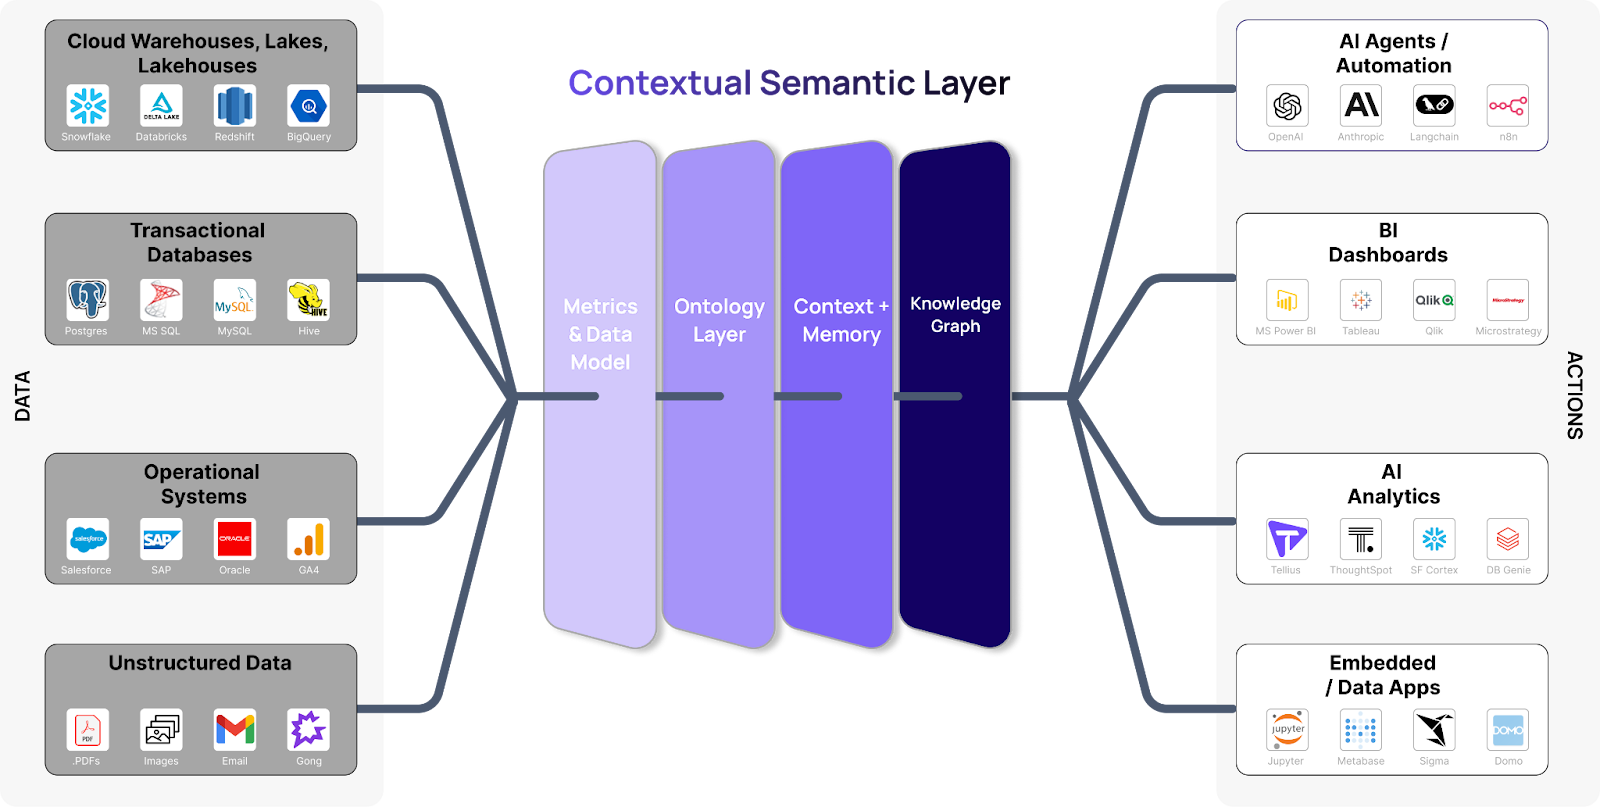
What it is: contextual semantic layer = governed metrics + ontology + knowledge graph + memory + LLM orchestration.
Why it matters: A contextual semantic layer is the connective tissue across BI, AI, LLMs, and agentic analytics—keeping reasoning precise, governed, and explainable at scale.
How it works: Intent → plan (RCA/compare/etc.) → governed SQL + KG traversal + targeted RAG → citations & lineage.
Proof: Long context alone is brittle; structuring memory + asking over KGs measurably improves correctness.
1) Semantic Layers in the Age of Agentic AI
Most companies rely on semantic layers built for dashboards and static reporting—not for the messy, unpredictable world of LLMs and agentic AI.
In practice, that means context gets lost as prompts get longer, metrics definitions drift across tools, and business rules never make it into the workflows where decisions are made. Ask an LLM a simple question and it may hallucinate an answer because the right fact was buried mid-context. Prompt an agentic system with a task and it may act confidently—but on incomplete or inconsistent data.
Semantic layers are only valuable when business meaning travels with the question, from intent → definitions → entities → evidence → governed output and carry session memory and structure alongside the model—so the conversation stays coherent and the answer stays anchored.
Now that we’ve set the stakes, let’s look at what the semantic layer got right—and where it ran out of runway.
2) Where Legacy Semantic Layers Fall Short
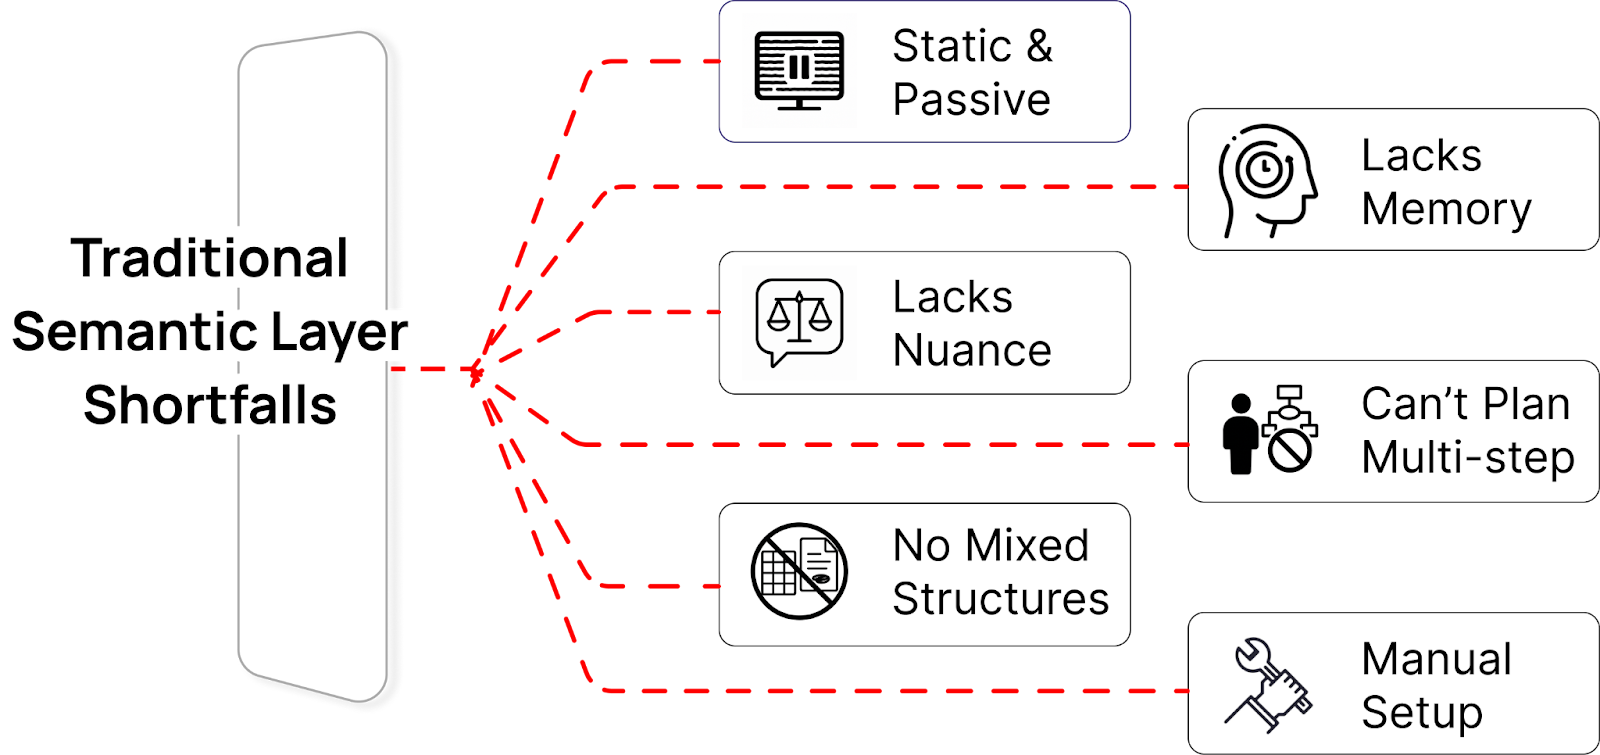
The classic semantic layer translated warehouse schemas into business terms—Revenue, Active Customer, YoY—so everyone used the same logic. Its superpower was consistency: a single, governed definition reused across dashboards, exports, and models.
Where it fell short: it was static and passive. It didn’t understand nuance (“top-performing region”), it couldn’t combine structured tables with unstructured evidence (tickets, policies), it lacked memory, and it didn’t plan multi-step analysis. For “why” questions, it left humans to guess which breakdown to try next.
So what does the layer look like when it’s built for conversation and reasoning?
3) Contextual Semantic Layers: Metrics, Ontology, Memory, KG, LLM Orchestration
An AI-ready semantic layer has cooperating layers that keep answers correct under pressure:
Data warehouse (unchanged)
Snowflake/BigQuery/Redshift remain the source of truth for structured data. Clean data still matters.
Physical data model
Tables, keys, partitions, and performance tuning are foundational. We build on decades of modeling practice.
Semantic stack (the new core)
The old semantic layer expands into cooperating layers:
- Metrics layer (governance)
Central, versioned definitions for KPIs (e.g., Sales, CAC) so every answer uses the same logic. - Ontology layer
Formal business entities and relationships (Customer, Product, Region; “Product belongs To Category,” “Doctor prescribes Drug”) that give structure beyond metrics. - Context & memory layer
Carries conversational state (role, prior filters, follow-ups, user feedback). Because LLMs don’t reliably use long raw context, explicit memory keeps multi-turn answers coherent. - Knowledge graph (KG)
Connects structured data with unstructured evidence (contracts, tickets, notes) via entity links and allowed edges. This grounds reasoning in business relationships.
LLM layer
Interprets natural language, drafts a plan, and composes the response—but stays grounded by the layers beneath (definitions, access rules, evidence). Without that grounding, outputs risk being fluent but unmoored.
User interface / agent
The chat or voice surface (e.g., an analytics assistant) routes your question through the stack, returns a governed answer with visuals/citations, and—where appropriate—can take simple actions (alerts, what-ifs). That’s the “agentic” part: it has the agency to orchestrate steps on your behalf while honoring governance and security.
4) Why metrics alone aren’t enough (a walkthrough)
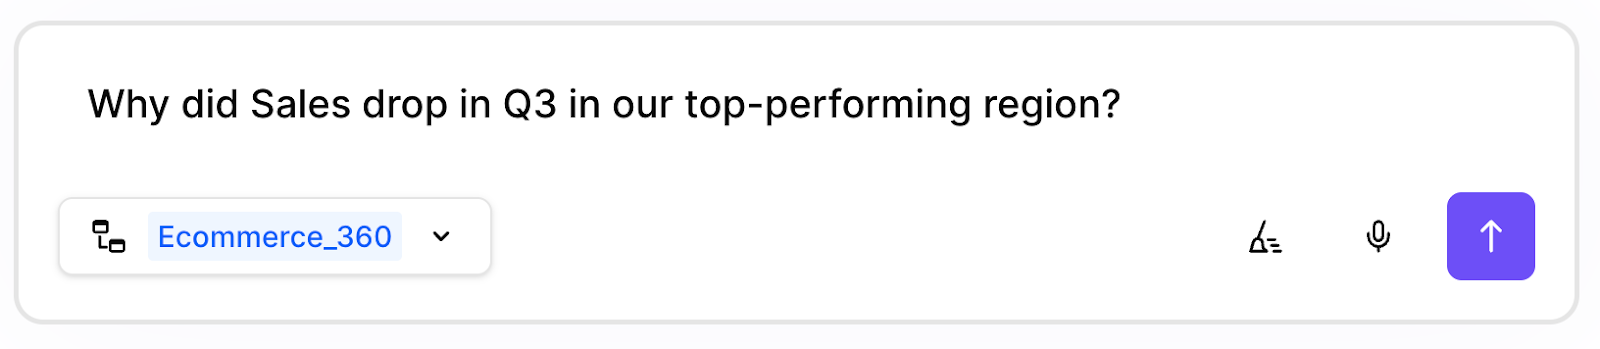
How an agentic analytics stack answers “Why did Sales drop in Q3 in our top-performing region?”
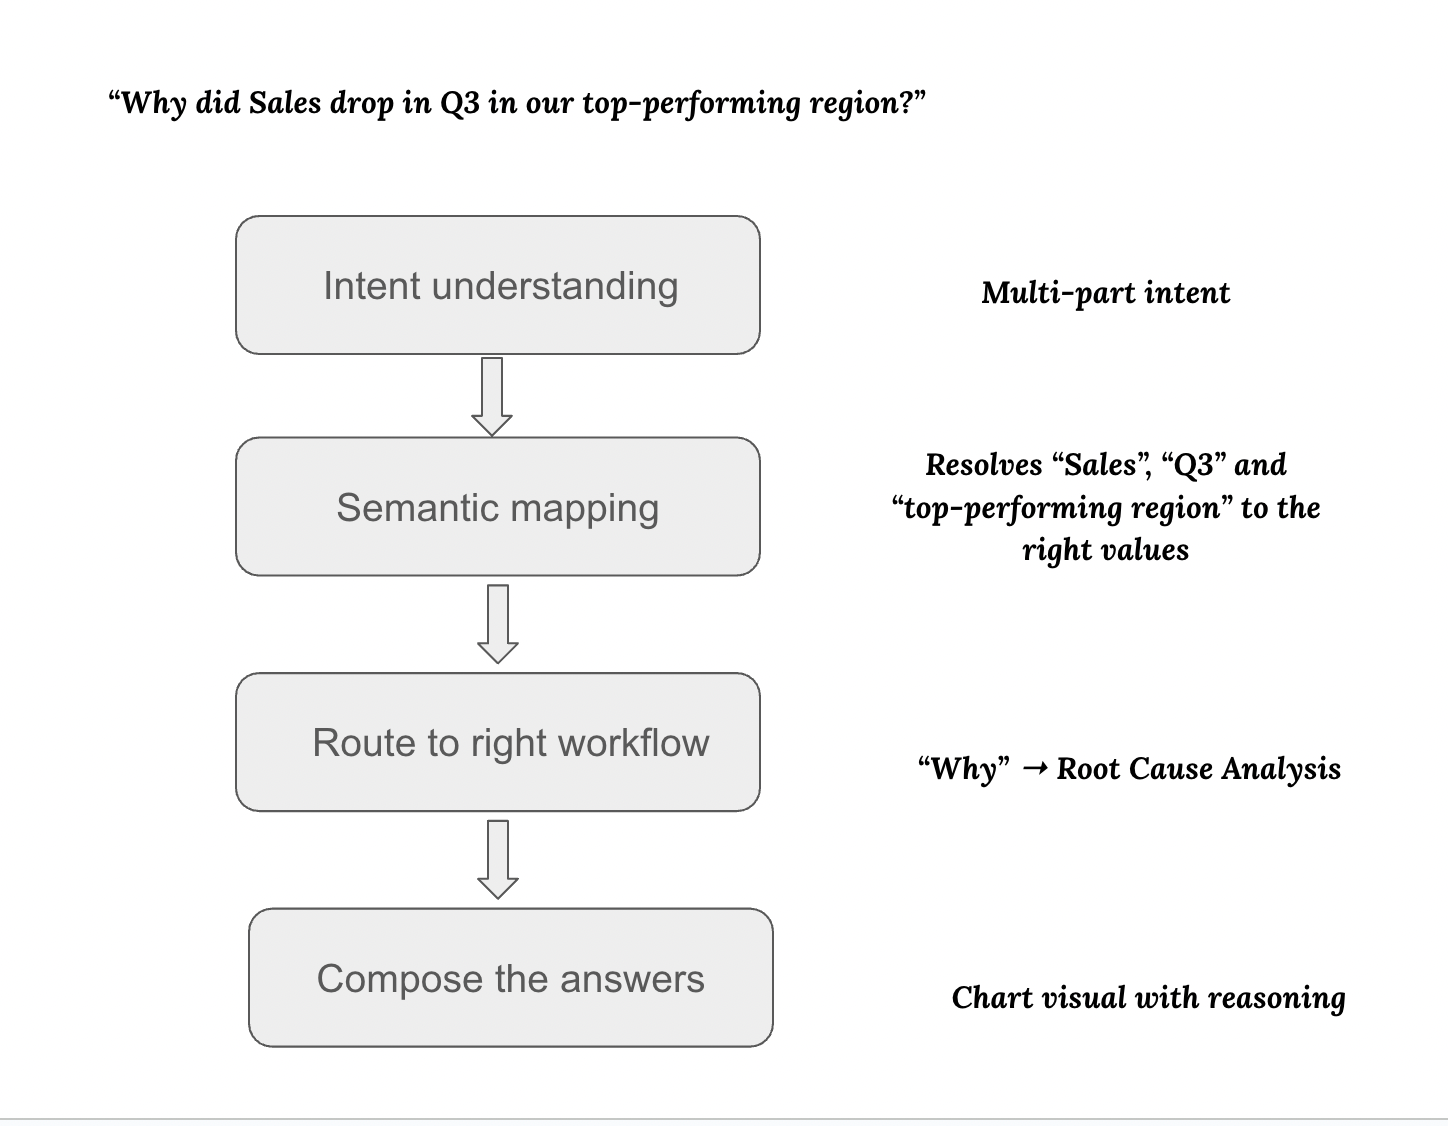
Intent understanding
The agent (via the LLM) parses a “why” question about a governed metric (Sales), a time period (Q3), and an implicit cohort (“top-performing region,” which must be resolved). It recognizes this is a multi-part intent, not a single SQL aggregation.
Semantic mapping
The metrics layer binds “Sales” to the approved formula and source. The ontology/KG resolves “Q3” and “Region” in your business hierarchies. The memory layer checks context to interpret “top-performing” (e.g., highest YTD or last quarter); if no prior context exists, it derives the region (e.g., rank by Q2/YTD). This disambiguation prevents low-value clarifications and keeps the answer grounded in your definitions.
Route to the right workflow
Because it’s a “why,” the agent runs a root-cause analysis plan: choose a baseline (Q2 or trend), compute diffs, and rank contributors (product, geo, segment, channel). It correlates signals linked in the KG (promotions, incidents, supply events) and may pull targeted documents/logs tied to those entities. The KG also flags structural relationships (e.g., Region X relies on Product Line Y that had supply issues), guiding the drill-down.
Compose the answer
The agent returns a short narrative with visuals and citations, e.g., “APAC Q3 Sales –15% driven by Electronics (Japan) after a Q2 promo ended; August supply delays constrained inventory.” A small contributor waterfall chart and links to both tables and documents show its work.
Why the old layer can’t do this.
A static metrics catalog can filter Q3/APAC, but it can’t resolve vague terms, carry context, or trace causation. The contextual semantic layer—governed metrics + ontology/KG + memory + planning—grounds the analysis so the agent moves from reporting what happened to explaining why it happened.
Next, we’ll apply the same pattern to other question types (compare, recommend, forecast).
5) Five Question Types, Five Plans
With a semantic intelligence layer, a single conversational surface can handle multiple analysis styles—each routed to the right plan under the hood. Where traditional BI split exploration, diagnostics, and forecasting across tools, an agent interprets complex queries and selects the workflow automatically.
Five common question types and how the agent answers:
- “What is X?” — Metric lookup
The agent maps terms (e.g., Sales, New Customers) to governed metrics, applies time/filters, and runs the query against the warehouse. You get a value (and tiny trend) without hunting dashboards. It echoes the time window/grain and links lineage so definitions stay trusted. - “Why did X happen?” — Root-cause analysis (RCA)
It chooses a baseline (prior period or trend), decomposes the change across governed dimensions (product/region/segment/channel), ranks contributors, and correlates with knowledge-graph–linked signals (promotions, incidents, supply). Targeted unstructured evidence (tickets, logs, notes) is pulled by entity linkage, not keyword guesses. - “How can we improve X?” — Recommendations
Starting from RCA drivers, the agent retrieves relevant playbooks/prior interventions, estimates impact with explicit assumptions, and offers options (e.g., reduce support backlog, reinstate a promo). It shows expected ranges, constraints, and evidence—augmenting judgment, not replacing it. - “Compare X and Y” — Cohorts/segments
Cohorts are resolved from the ontology (e.g., Tier-1 vs Tier-3), aligned on period and confounders, then compared on governed metrics with significance checks. You see side-by-side results plus a brief explanation of where behavior diverges.
- “Forecast or simulate X” — Predictive/what-if
The agent selects a suitable model, respects as-of data boundaries, and—where governed—adds exogenous context (holidays, contract milestones) from the KG. It discloses backtest error, model version, and scenario assumptions, returning a forecast band and what-if impacts (not just a single number).
What ties these together
The agent dynamically picks the right tool because it stands on semantics: governed metrics, an ontology, a knowledge graph, and memory. Whether it’s a one-line lookup or a multi-step RCA, the stack maps intent → plan → evidence → governed output. That’s a shift from static dashboards to on-demand, conversational analysis—users ask “What/Why/How/Compare/Forecast” and get meaningful, sourced answers.
A realistic caution
Delivering seamless Q&A across messy data is hard. You need all the semantic pieces—metrics, ontology, context, and KG—well integrated. Early “LLM on your database” trials that skipped this grounding produced brittle SQL and off-base summaries. Practitioners note that without embedded business logic, an LLM “has no hope in hell” of handling real joins, exclusions, or edge-cases.
Where we go next
To make this reliable, two ingredients matter most: knowledge graphs (to connect facts and enforce safe relationships) and blending structured with unstructured evidence. Let’s dig into those.
6) Where Facts Connect: Knowledge Graphs + Blended Evidence
Now that we’ve seen what kinds of questions the agent can answer, let’s look at how it stays right. The short answer: connect facts, not just fields.
Knowledge graph (KG) means your real entities and allowed relationships are explicit: Customer → buys → Product, Product → covered by → Contract, Region → affected by → Supply Event. Because those links are modeled (and not guessed at query time), the agent can safely traverse “what’s related” without inventing joins.
Why it matters in practice:
- Disambiguation. Vague phrases (“top-performing region”) resolve against governed definitions and graph relationships instead of fuzzy text matching.
- Grounding. When the agent claims “Q3 dipped after a promo ended,” it can point to the promo node, the dates, and the affected products.
- Evidence, not anecdotes. Unstructured sources—tickets, policy PDFs, rep notes—are retrieved via entities in the graph (not keyword luck), then summarized as supporting passages.
A published enterprise benchmark reported that asking over a KG, rather than raw schemas, increased correctness from 16% to 54%. Numbers will vary by dataset, but the direction is consistent: explicit relationships make answers more accurate.
7) The Path Every Question Follows Through the Contextual Semantic Layer
We’ve covered what the agent can do; now let’s make it reliable. Below is the single path every question follows, plus what each stage is responsible for. Keep this mental model in mind—one path in production, one place to tune speed and enforce safety.
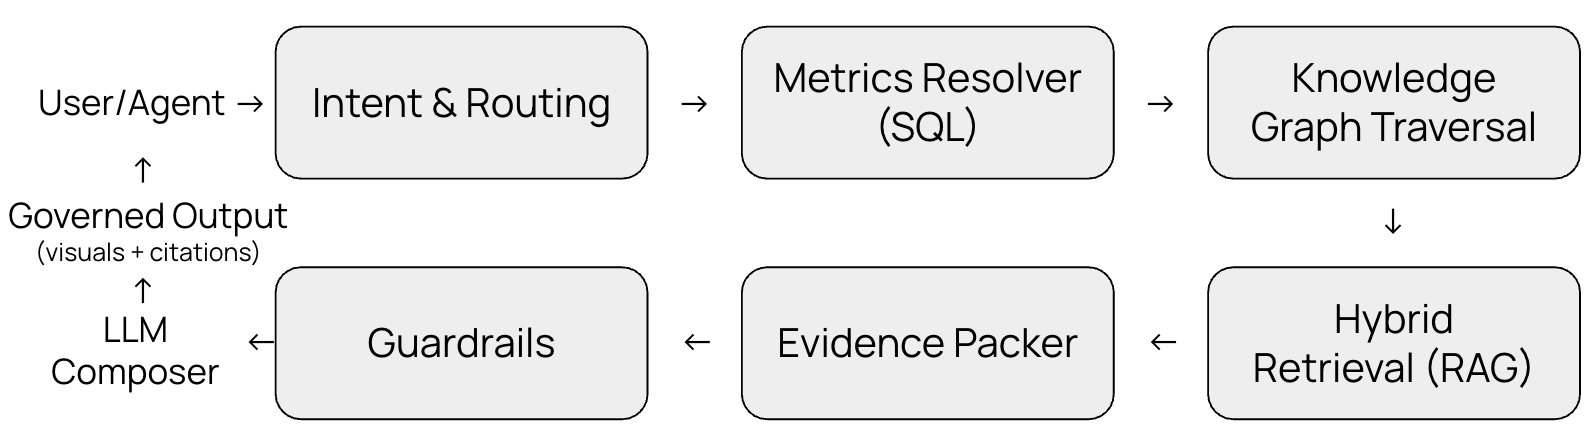
1) Intent & routing
First, the system classifies the question: is it a what, why, compare, recommend, or forecast? From that, it produces a concrete plan—e.g., “lookup metric,” “run root-cause,” or “compare cohorts.” This keeps the next steps deterministic instead of guessing at runtime.
2) Metrics resolver (SQL)
Here the stack binds business terms to governed definitions and generates safe, performant SQL. It applies the right joins, grains, and filters (e.g., “Q3” as your organization defines it) so numbers match your source of truth. If a metric isn’t defined, this stage fails fast and tells you what’s missing.
3) Knowledge-graph traversal (graph)
The system walks only allowed edges in the knowledge graph to find related entities and events (promotions, incidents, contracts). This is how it avoids explosive, unsafe joins: relationships are explicit and whitelisted. The graph provides context the warehouse alone can’t.
4) Hybrid retrieval (RAG)
For unstructured evidence, retrieval is entity-linked, not blind keyword search. The agent pulls passages from approved document stores (tickets, notes, policies) that are connected to the entities in play. This keeps evidence relevant and auditable.
5) Evidence packer
Now we assemble what we’ve learned. The packer normalizes units and currencies, removes duplicates, and ranks contributors by how much they explain the change. The result is a small, clean “evidence bundle” ready for synthesis.
6) Guardrails (built-in, twice)
Security and policy checks run before data retrieval and again before answer composition. That includes Row-Level Security (RLS) and role permissions, PII/secret scanning, and an allow-list for tools (the model never holds database credentials). If something violates policy, it’s redacted or blocked with a clear note.
7) LLM composer
Only after facts are governed and safe does the model draft the narrative. It turns the plan and evidence into a short explanation, adds citations to tables/graph edges/documents, and records the model version and data snapshot for lineage.
8) Governed output
Finally, the system returns the answer with a chart and clickable sources. It also logs end-to-end lineage—answer → queries/graph/doc calls → model/data versions—so anyone can trace how the result was produced.
This is the spine that keeps answers fast, grounded, and reviewable. Each step has a clear job; together they turn a natural-language question into a governed, evidence-backed response.
Governance, SLAs, and Guardrails (P95, access, PII, tooling)
Governance is what makes insights operationally trustworthy. SLAs ensure responses arrive within usable timeframes, access controls enforce who can see what, and PII checks prevent sensitive data from slipping through. Guardrails aren’t optional—they are the mechanisms that preserve accuracy, compliance, and safety as systems scale.
- Latency targets (P95): Lookups ≤ 3s; Root-cause/Compare ≤ 10s; Forecast/What-if ≤ 15s.
What is P95?
P95 means the 95th percentile of latency. If your P95 for lookups is 3 seconds, it means 95 out of 100 questions finish in 3 seconds or less.
The slowest 5% may take longer—that’s your “tail.” P95 is the “experience you keep”: the speed 95% of users actually feel, which is why we set our targets on P95—not the average.
Averages hide the frustrating experiences. If most answers are fast but a handful take 12 seconds, an average will still look great while users remember the slow ones.
- Graceful fallback: If targets can’t be hit (cold caches/heavy joins), return partial, verified results with citations and state what’s still loading.
- Access controls (two gates): Row-level security and role-based access control are enforced before data retrieval and again before answer composition.
- Sensitive data: Scan for personally identifiable information; redact or drop unsafe spans.
- Tool hygiene: The model never holds database credentials; only allow-listed tools can run.
Now that we’ve nailed the path and speed, let’s prove the answers are correct, grounded, and safe—and keep them that way as things change.
8) Evaluation: Exactness, Faithfulness, Coverage
Evaluation is where reliability is established. Exactness verifies that numbers align with governed metrics, faithfulness requires every claim to be evidence-backed, and coverage measures how fully explanations are supported. Without these benchmarks, it’s impossible to separate fluent output from dependable reasoning—or to know when a system is ready for broader adoption.
Offline QA (before you go wide)
Build a small test set from your real questions.
- Exactness: Do numbers match governed metrics (within a tight tolerance) for lookups?
- Faithfulness: Can every claim be traced to a table, graph edge, or document passage? (Binary pass/fail per claim.)
- Coverage: What share of the answer is supported by citations? (Aim for a meaningful majority when explaining why.)
- Graph hit-rate: How often do sessions use graph facts? (Proxy for grounding vs. guesswork.)
- Safety: Probe for prompt-injection and personal data leaks; run policy unit tests.
Re-run this harness whenever you change the metric model, ontology/graph, retrieval setup, or model version.
Online signals (once you’re live)
- Time to first useful answer (not just first token).
- Follow-up depth and correction rate (should trend down).
- Human feedback (thumbs + missing-evidence flags).
- Drift monitors: re-embedding cadence; ontology/graph schema changes; metric diffs after refresh.
Set clear thresholds before expansion:
- Lookups: exactness ≥ 99%, faithfulness 100%, ≤ 3s P95.
- RCA/Compare: coverage ≥ 60–80%, faithfulness 100%, ≤ 10s P95.
- Forecast/What-if: disclose backtest error; ≤ 15s P95; log assumptions.
- Safety: high-severity tests pass; no critical policy violations in canary traffic.
9) Pitfalls & Design Patterns (that you can design around)
Complex systems often fail in predictable ways: runaway joins, stale embeddings, unit mismatches, access leaks. These aren’t anomalies; they are recurring risks that surface under real-world usage. Addressing them proactively—through tested design patterns—is what turns a fragile proof of concept into a durable production system.
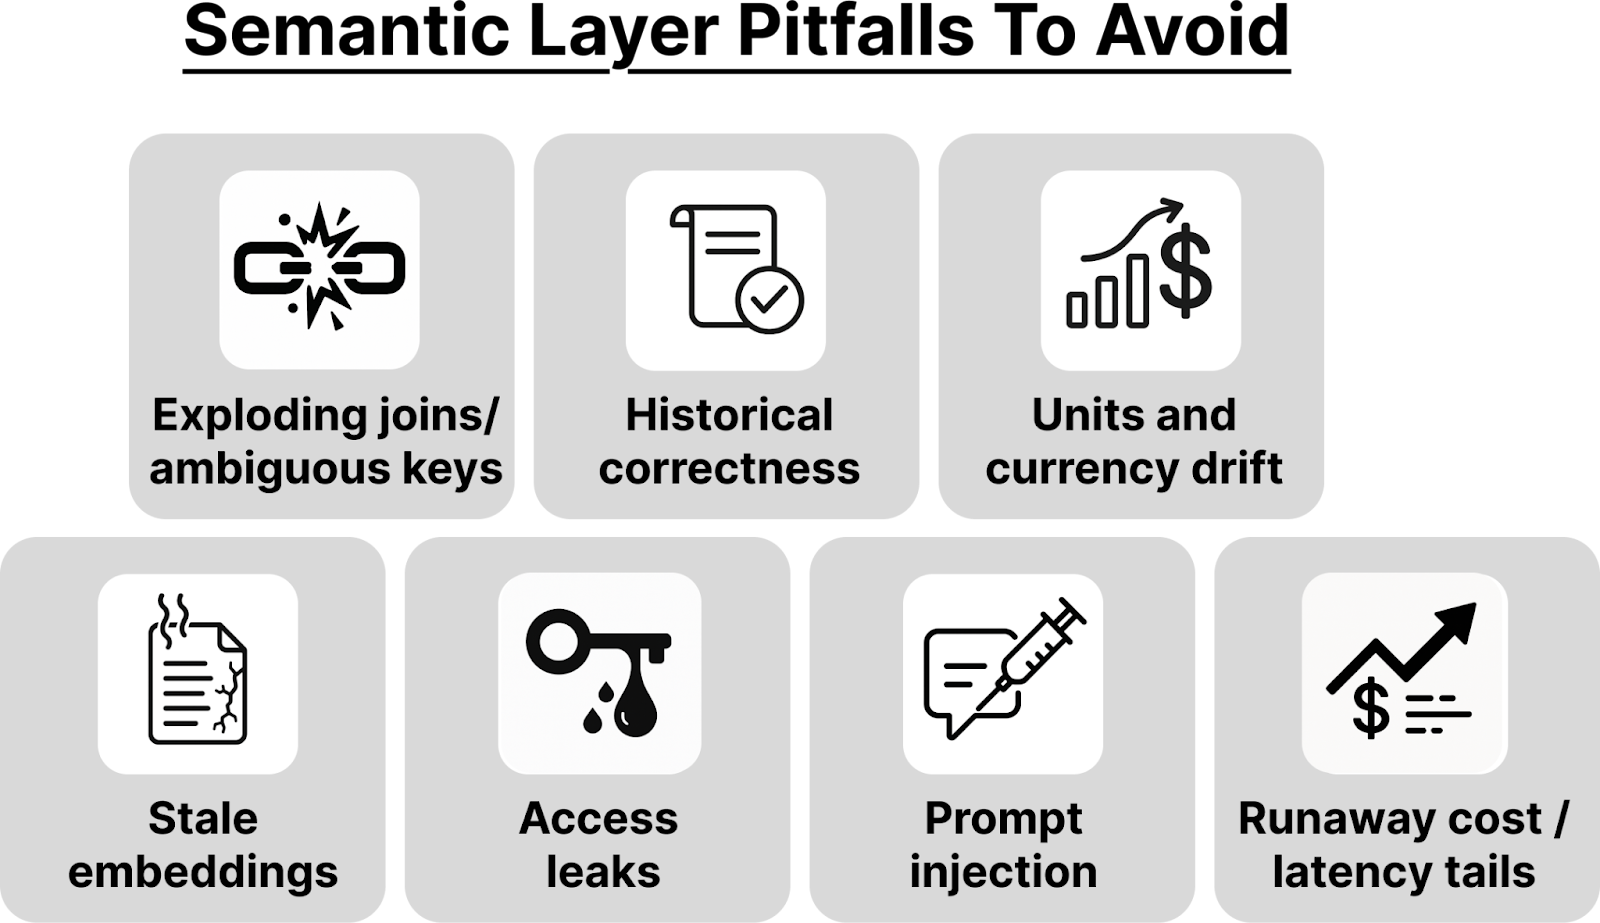
Exploding joins and ambiguous keys.
Problem: One innocent question spawns a massive join and stalls.
Design fix: Whitelist safe join paths in your ontology/graph; use pre-built semantic views for common paths; reject Cartesian expansions.
Cartesian expansion is when a join multiplies rows because each record on one side matches multiple records on the other side—sometimes because of a missing or sloppy join condition. Think of it as an accidental CROSS JOIN (Cartesian product) or an unintended fan-out.
Historical correctness (“as of” time).
Problem: You compare current product names to last-year sales and get mismatches.
Design fix: Teach “as-of date” semantics. When comparing periods, fetch dimension versions as they were at that time.
Units and currency drift.
Problem: A chart silently mixes USD and EUR, or cases and kilograms.
Design fix: Normalize in the metrics layer; if you must mix, label clearly and flag conversions in the evidence pack.
Stale embeddings and document rot.
Problem: Retrieval keeps surfacing old policies; answers reference outdated rules.
Design fix: Re-embed on a schedule; tag freshness; age out stale documents or demote them in ranking.
Access leaks in natural-language answers.
Problem: The agent cites a record the user shouldn’t see.
Design fix: Apply access checks before retrieval and before composition; never cite what you can’t legally show.
Prompt-injection and data exfiltration.
Problem: A pasted log tries to override instructions or extract sensitive data.
Design fix: Constrain tool use; sanitize retrieved content; separate model prompts from credentials; test routinely with adversarial prompts.
Runaway cost and latency tails.
Problem: The system is fast on day one, slow (and expensive) by week four.
Design fix: Cache graph traversals and hot aggregates; cap an “evidence budget” per answer; profile the slow tail and trim it first.
10) Choosing your building blocks
The foundation you pick—graph store, vector search, model integration—shapes everything that comes after. Different engines and deployments bring trade-offs in expressiveness, governance, speed, and compliance. What matters is not chasing the “perfect” stack, but choosing components that align with your use cases and keeping core semantics portable. If your metric logic and ontology can move with you, the system remains adaptable even as tools evolve.
- Graph store.
Choose a property-graph engine when you need expressive hop-by-hop traversals and operational graph patterns.
Choose an RDF triplestore when ontologies, inference, and formal vocabularies drive your use case.
Hybrid/multi-model works when teams bring both needs—just keep the schema and relationships exportable. - Vector search (for unstructured evidence).
Cloud-managed speeds you up; on-premises helps with residency/regulatory constraints. Both can coexist; the key is entity-level linkage back to your graph. - Model integration.
API-hosted models for flexibility and fast updates; self-hosted for data sovereignty and customization. A hybrid often wins: small models for routing, larger models for final composition.
- Principle:
Keep your metric logic and ontology portable. If you ever switch tools, you should be able to take your definitions and graph with you.
11) ROI you can defend (without hand-waving)
The value of AI analytics can’t rest on vague claims or inflated industry multipliers. ROI has to be measured with the same rigor as any governed metric—clear definitions, consistent formulas, and transparent assumptions. That means quantifying time saved, decisions accelerated, errors reduced, and new users empowered, then reviewing those numbers alongside quality signals on a regular cadence.
Treat value like a governed metric: one formula, used everywhere.
- Time saved: (analyst hours saved/week) × (fully-loaded hourly rate) × 52.
- Decision speed: (days reduced for a named decision) × (estimated value/day).
- Error reduction: (pre→post incorrect-answer rate) × (average cost per error).
- User expansion: (new decision-makers enabled) × (estimated value/user).
Review monthly alongside quality signals (resolution time, follow-up depth, correction rate). Use your numbers; avoid generic industry multipliers.
12) Implementation framework: a five-phase program
Now that we’ve seen what the agent does and why the contextual semantic stack matters, let’s flip the lens: how do you get this in production without assembling parts, frameworks, and guardrails yourself? This is where Tellius earns its keep: it bundles the layers (metrics, ontology-ish business views, retrieval, reasoning, governance, and UX) into one product—so teams adopt, not assemble. Your team focuses on business questions; Tellius ships the stack.
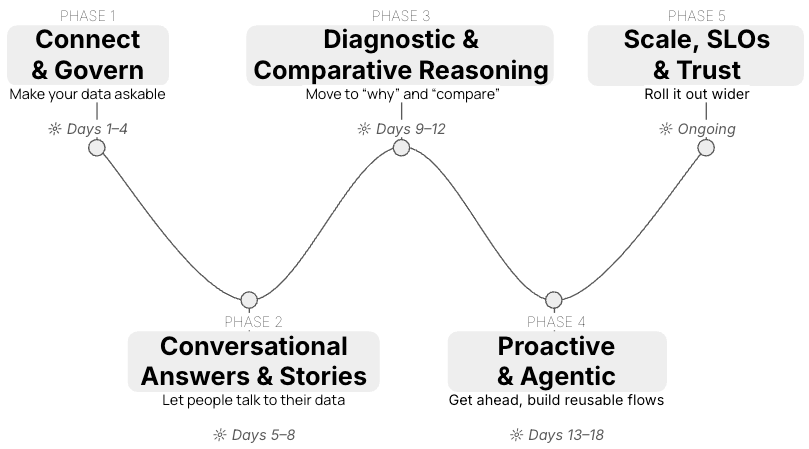
Phase 1 — Connect & Govern (Days 1–4)
Now that the strategy is clear, start by making your data askable.
- Use Tellius to connect new data sources:
Snowflake/BigQuery/Redshift/MySQL/Postgres etc. and unstructured feeds (Google Drive PDFs, Gong, Salesforce streams). - Model the Business Views (your governed semantic layer).
In Prepare → Metadata / Scripting / Data Fusion, define KPI formulas, fiscal calendars, safe joins, synonyms & display names, and cache hot datasets. Schedule refreshes in Refresh Pipeline. - Access controls from day one.
Turn on row-level/role-based rules so NL answers respect permissions. Executives can ask “What were Q3 APAC sales?” and get a governed number, tiny trend, and lineage.
Phase 2 — Conversational Answers & Stories (Days 5–8)
With the foundation set, let people talk to the data.
- Let stakeholders ask messy, typo-filled, multi-part questions;
Kaiya resolves intent, keeps context (and can “forget” it, if requested), and shows reasoning preambles with citations to verify how an answer was produced. - Role-aware starting points.
Use Kaiya’s recommended queries by role to seed adoption; capture follow-ups as reusable prompts. - From answer to story.
Push results into Vizpads (KPI, Waterfall, YOY, Cohort, Explainable AI) and use Generate Summary with Kaiya to narrate trends and drivers right on the page. The outcome is governed NL lookups and narrated insights people can share in minutes.
Phase 3 — Diagnostic & Comparative Reasoning (Days 9–12)
Now that “what” is solid, move to “why” and “compare.”
- Root-cause analysis (RCA).
Configure baselines (prior period/trend); Kaiya runs contributor breakdowns across product/region/segment/channel and cites the factors. - Cohort/segment compares.
Define tiers/segments in Business Views; Kaiya returns side-by-side metrics and highlights divergence. - Blend evidence.
Bring in high-signal docs (policy PDFs, rep notes) and link them to entities via Data Fusion so explanations include structured + unstructured proof.
Outcome: “why” answers with a contributor waterfall and linked passages—grounded, not guessed.
Phase 4 — Proactive & Agentic (Days 13–18)
We’ve explained the past; let’s get ahead of it.
- Tellius Feed (alerts with drivers).
Monitor KPIs; when metric shift, owners get an alert with top drivers attached. - Agentic workflows.
Build reusable flows (e.g., “if market share drops in Tier-1, run RCA → compare cohorts → propose actions”). Trigger them from thresholds or schedules; Kaiya records assumptions and evidence. - Teach the language.
Do short sessions with sales/ops/finance; encode their terms (tiers, segments, regional rollups) as ontology-like definitions in your Business Views and Learnings so Kaiya speaks your business. Centralize KPI logic in Business Views so terms like “active account” mean one thing everywhere; version changes and announce them.
Phase 5 — Scale, SLOs & Trust (Ongoing)
You’ve proved value; now make it predictable and auditable.
- Watch a small scoreboard:
Lookup P95 ≤ 3s, RCA/compare ≤ 10s, Forecast/What-if ≤ 15s. Fewer corrective follow-ups week over week, alert “precision” improving. - Keep citations on by default,
Enforce row-level security before retrieval and before final composition, and log lineage (answer → SQL/doc calls → model/data versions). - Train teams on human-AI co-analysis, and review a small scoreboard (latency, correction rate, alert precision) alongside a simple ROI roll-up (time saved, decision speed, error reduction).
Conclusion
If your semantic layer is still a static catalog, you can evolve it into a contextual semantic layer without losing what made BI useful. Start with a few high-value questions, encode the metrics and entities, stand up a thin graph, and let the agent prove itself—one grounded answer at a time.
Learn more about Tellius AI Agents.
Get release updates delivered straight to your inbox.
No spam—we hate it as much as you do!


A governed modern semantic layer that fuses metrics definitions, an ontology, a knowledge graph, session memory, and LLM orchestration. It turns a natural-language question into a plan, runs the right queries, pulls linked docs, and returns answers with clickable sources and a trace of how it got there.
Old layers were static and BI-only (fixed metrics over structured tables, no memory, no reasoning). The new layer adds business relationships (ontology + knowledge graph), memory, and retrieval—so it can explain why something changed and what to do next.
Long prompts get ignored; models lose track, ignoring mid-context facts. Memory carries your role, filters, and prior turns. A knowledge graph disambiguates entities, nails “who is who” and “how things connect,” and points to the right documents, thereby boosting accuracy.
“What” → A governed metric lookup with the exact time window and a relevant chart (plus the metric’s definition/lineage).
“Why” → A root-cause plan: compare baseline vs. now, rank top contributors, and pull linked signals from the knowledge graph—with citations.
“Compare” → A cohort/segment comparison, adjusting for differences like size, mix, and seasonality; highlights real gaps with confidence indicators.
“Forecast” → Model-backed projections and what-ifs, with clear error bands and stated assumptions.
“How to” → A recommendation plan: turn the drivers into concrete actions (playbooks, past wins), estimate impact ranges, and note trade-offs/prerequisites.
The stack never gives the LLM raw database access. Access is checked twice—before data is fetched and before the answer is composed. Row-level security (only rows you’re allowed to see) and role-based permissions apply everywhere (SQL, graph and RAG); personal/secret data is auto-redacted.
Targets where 95% of answers finish within: lookups ≤ 3s, root-cause/compare ≤ 10s, forecast/what-if ≤ 15s. If something runs long, return a partial, verified answer with citations and finish the rest in the background (displaying what’s being processed).
Check that numbers match the agreed metric (exactness) and that every claim points to a table, graph link, or document (faithfulness). Track what share of the answer is cited, plus live signals like time to first useful answer, fewer corrections over time, follow-up depth, and drift alerts (changes in database, definitions of KPI, embeddings).
LLMs don’t know your business rules, metric definitions, or security boundaries. Without a semantic layer and governance, you’ll get inconsistent answers and possible data leaks. A contextual semantic layer ensures that every step (metrics resolver, graph traversal, document retrieval, guardrails) binds answers to governed definitions, applies security, and shows lineage. This prevents hallucinations and ensures the output matches your source of truth.
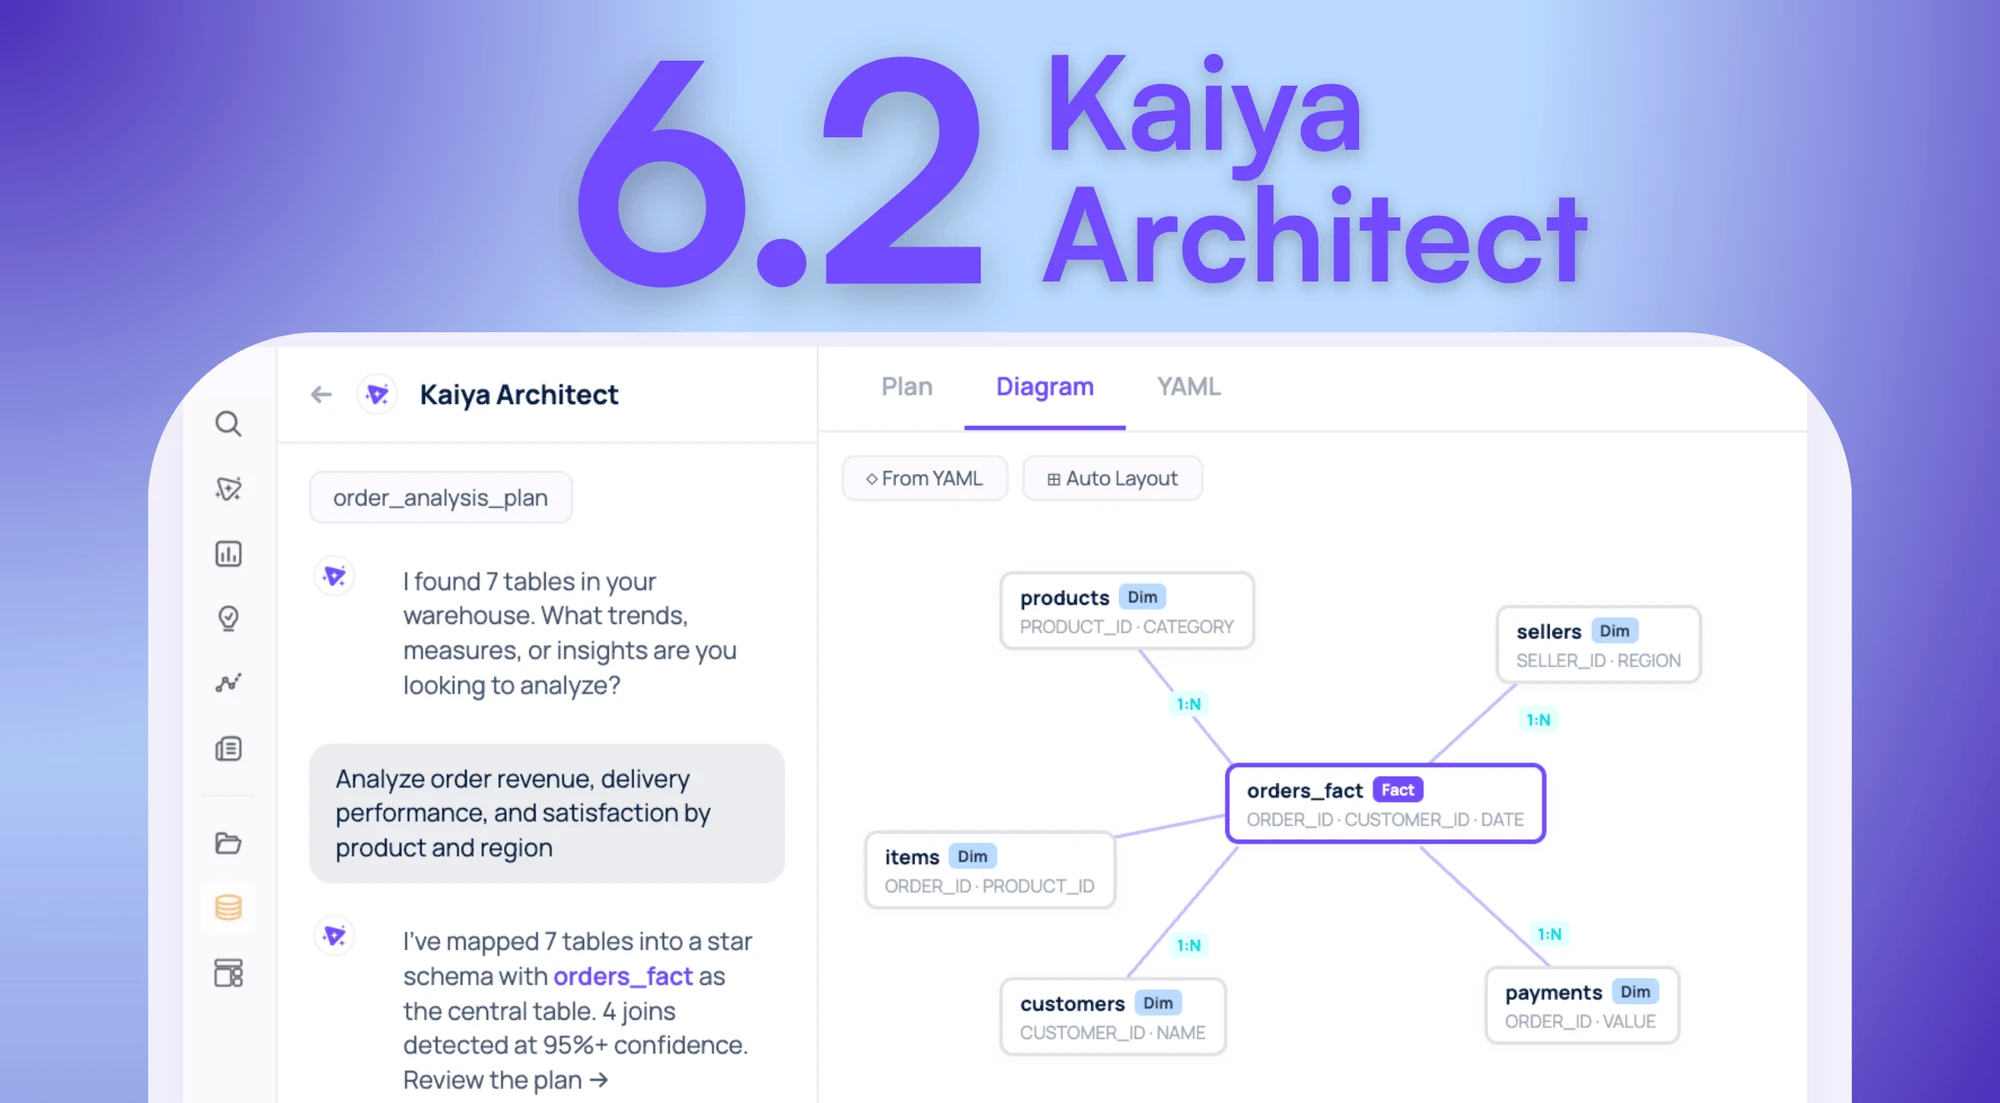
Your Data Is In The Warehouse. The Model That Makes It Useful Isn’t. Introducing Kaiya Architect.
Tellius introduces Kaiya Architect, an AI data modeling agent that builds governed semantic layers from raw warehouse data through a single conversation — eliminating the multi-week engineering bottleneck between business need and analysis.