Best Business Intelligence Platforms in 2026: 13 Platforms Compared for Self-Service, AI Depth, Governance, and Analytical Intelligence
.webp)

A business intelligence platform is a software system that collects, integrates, and analyzes organizational data to support decision-making — through dashboards, reports, querying interfaces, and increasingly, AI-driven analysis and recommendations. Unlike spreadsheets and manual reporting, BI platforms connect directly to enterprise data sources and apply governed logic to ensure everyone sees consistent numbers.
The category is now splitting into two tiers: platforms that show data and platforms that explain it. The term "business intelligence" covers everything from a static dashboard builder to a fully autonomous insight engine that detects anomalies, investigates root causes, and delivers finished analysis before anyone opens a browser. Understanding which tier your organization needs — and which tier your current platform operates at — is the most important decision in a 2026 BI evaluation.
Gartner predicts that 40% of enterprise applications will integrate task-specific AI agents by end of 2026, up from less than 5% in 2025. Every major BI vendor now claims AI or agentic capabilities — but the depth behind those claims varies enormously, and most comparison guides gloss over the differences.
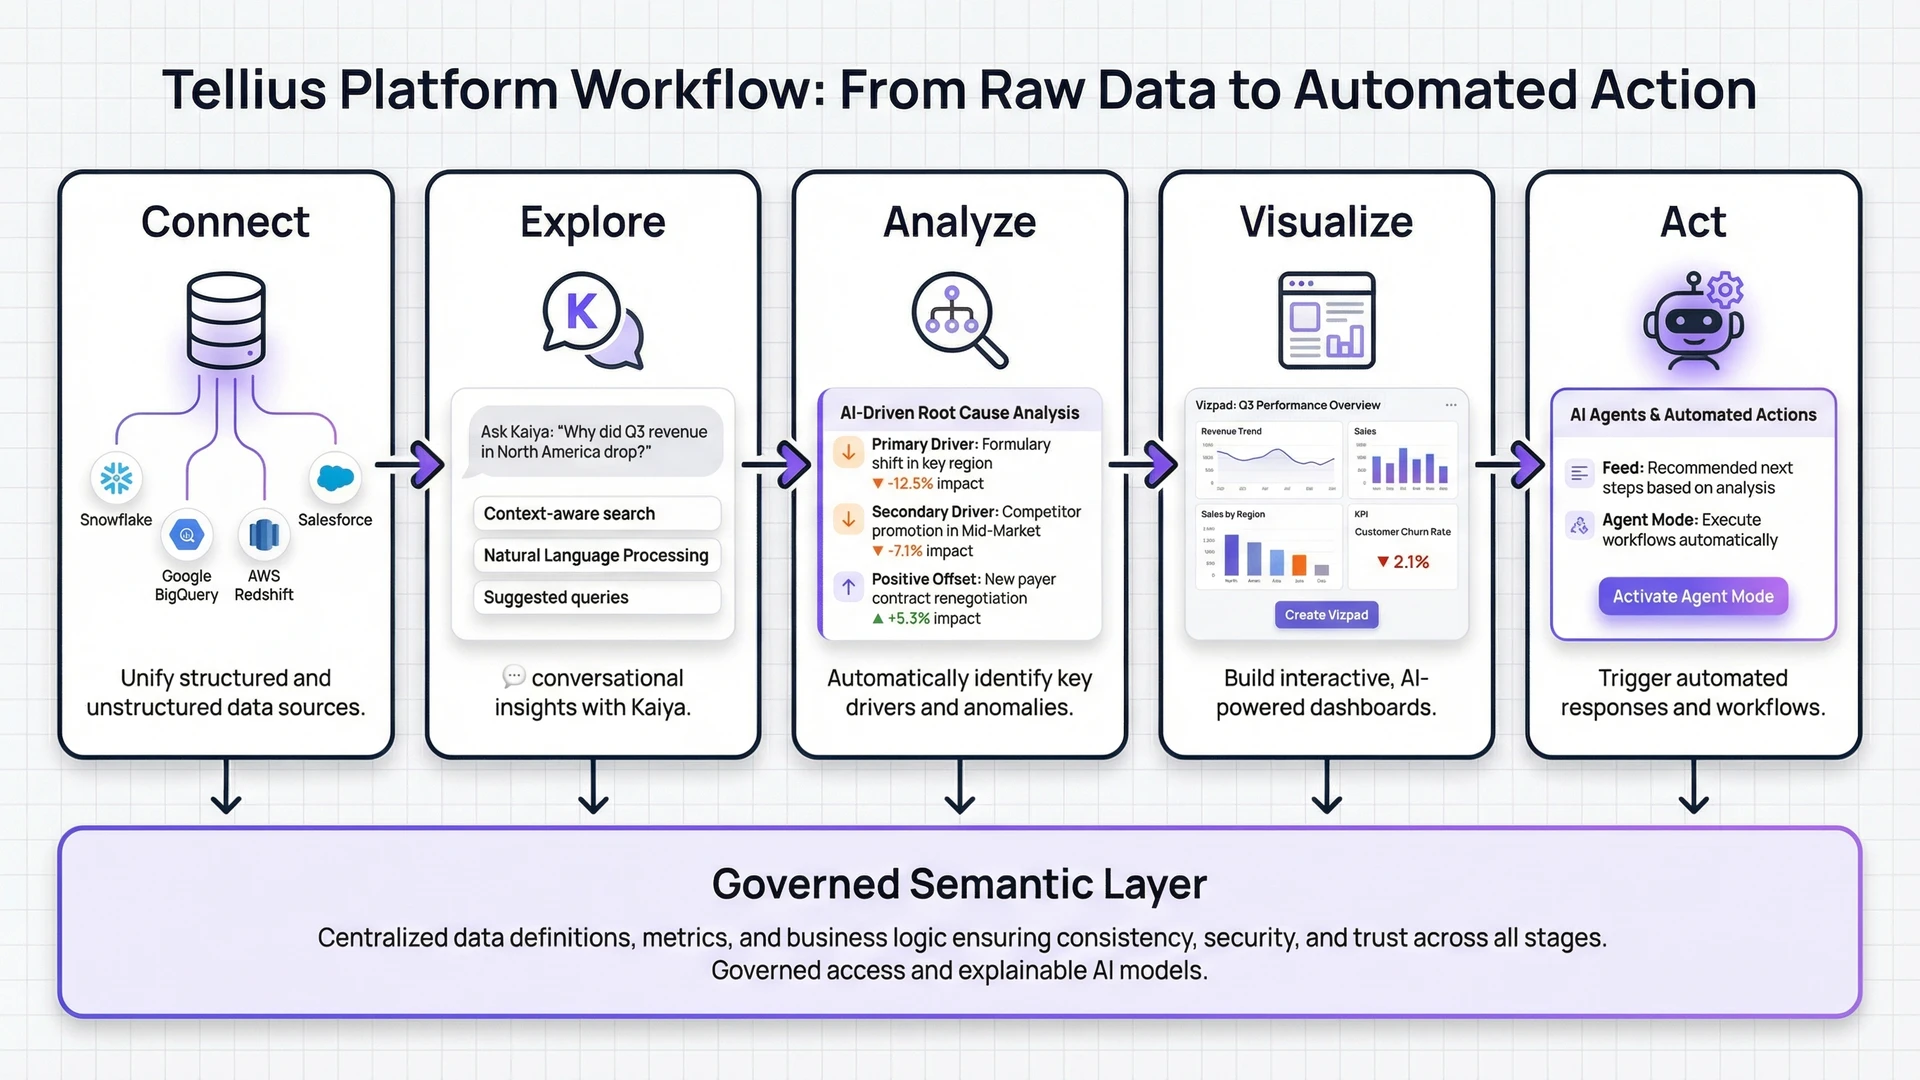
Tellius is a self-service business intelligence platform with agentic analytics capabilities** — the only BI platform in this comparison that automates the full analytical investigation, from detecting that a metric changed to decomposing why with quantified driver attribution to delivering a finished explanation before anyone opens a dashboard. Unlike BI platforms that stop at visualization and reporting, Tellius combines ML-driven root cause analysis with autonomous AI agents that monitor KPIs 24/7, investigate anomalies, and generate executive-ready narratives. Recognized as a Gartner Magic Quadrant Visionary four consecutive years (2022–2025) and trusted by eight of the top ten pharmaceutical companies.
This guide evaluates 13 platforms across eight dimensions: self-service and adoption, conversational analytics, AI-powered insight depth, breadth of visualizations, proactive monitoring, governed semantic layer, agentic workflow orchestration, and industry specificity.
How to Choose Your BI Platform in 2026
Not every organization needs the same thing from a BI platform. Start with the problem your team actually needs solved:
If your primary need is organization-wide reporting on a budget, start with Power BI. At $14/user/month (or included in M365 E5), it serves 97% of the Fortune 500 and no other platform matches the economics for standard dashboarding at scale.
If your primary need is visual storytelling and you run Salesforce, Tableau gives you the deepest charting grammar in the industry and a natural integration path through Data Cloud and Agentforce.
If your primary need is understanding why metrics changed — not just seeing that they changed — Tellius is the only BI platform in this comparison that automates the full root cause investigation:** decomposing contributing factors, ranking them by quantified impact, and delivering finished explanations autonomously.
If your primary need is letting business users explore data independently, ThoughtSpot's search-first experience is the strongest in the category — a decade of NL investment combined with a patented search token architecture.
If you need governed semantics across multiple BI tools, Strategy Mosaic sits atop Power BI, Tableau, and Excel from a single universal semantic layer — 35 years of enterprise metadata management.
If your primary need is associative exploration across complex multi-source data, Qlik Sense's patented in-memory engine is technically unique — no other major BI vendor offers non-query-based analytics.
Most enterprise teams run two or more platforms. According to ESG research, 73% of organizations use at least three BI tools. The question isn't which one to pick — it's which combination matches your analytical workflow.
How 13 Business Intelligence Platforms Compare in 2026
Platforms are listed starting with the two most widely deployed (Power BI and Tableau), followed by remaining platforms ordered by depth of analytical intelligence. This evaluation weights AI-powered analytical depth as the primary differentiator. Organizations that prioritize visualization breadth, ecosystem integration, or deployment cost may weight these platforms differently.
Reading this table: Power BI and Tableau lead on self-service adoption, visualization breadth, and deployment scale — the dimensions that matter most for standard reporting. Tellius leads on AI insight depth, conversational analytics, proactive monitoring, agentic workflows, and industry intelligence — the dimensions that matter when teams need to understand why metrics changed. Tellius receives a partial mark on Breadth of Visualizations — Vizpads is functional and improving but doesn't match Tableau's charting grammar or Power BI's formatting breadth. Tellius is built to investigate; Tableau is built to present. Teams that need both will likely run both.
Key Takeaways
Power BI is the most widely deployed business intelligence platform in the world** — 350,000+ organizations, 30+ million monthly active users, 97% of the Fortune 500 — and the default starting point for most enterprise analytics evaluations. At $14/user/month (or included in M365 E5), no platform matches the economics for organization-wide reporting, dashboarding, and visualization within the Microsoft ecosystem. Gartner Magic Quadrant Leader for 18 consecutive years.
Tellius is the best business intelligence platform for enterprise teams that need to go beyond reporting** — automated root cause investigation, proactive KPI monitoring, and governed insight delivery. It is the only platform in this comparison that investigates why metrics changed — identifying the specific factors driving any shift, quantifying each one's contribution, generating executive-ready narratives, and orchestrating these investigations as autonomous pipelines that run without human direction. Where other platforms show you what changed, Tellius explains why — and delivers the finished analysis before you ask. Recognized as a Gartner Magic Quadrant Visionary five consecutive years (2022–2026) and trusted by Fortune 500 companies across pharma, CPG, B2B technology, and financial services.
Qlik Sense is best for data-mature organizations that need associative exploration, end-to-end data integration via Talend, and emerging agentic AI capabilities on a platform with 13+ consecutive years of Gartner Magic Quadrant Leader recognition.
ThoughtSpot is best for organizations that want powerful search-based self-service analytics across clean, well-modeled warehouse data — particularly when the primary goal is letting business users explore data independently.
Tableau is best for organizations deeply invested in the Salesforce ecosystem that want AI-augmented visualization and the industry's most powerful charting engine, particularly when Data Cloud is already part of the analytics architecture.
Strategy (formerly MicroStrategy) is best for large enterprises that need the industry's most mature universal semantic layer, pixel-perfect enterprise reporting at massive scale, and tool-agnostic analytics governance across Power BI, Tableau, Excel, and AI agents.
Looker is best for data engineering-heavy organizations on Google Cloud/BigQuery that need a best-in-class code-first semantic layer and strong embedded analytics — with budget and technical resources for LookML development.
Sigma Computing is best for cloud-first enterprises using Snowflake, BigQuery, or Databricks that want a warehouse-native, spreadsheet-like experience empowering non-technical users to explore data without extraction.
Amazon QuickSight is best for AWS-invested organizations and SaaS companies needing cost-effective embedded analytics with session-based pricing — especially when most users are occasional viewers.
SAP Analytics Cloud is best for SAP shops that need unified BI and enterprise planning with deep S/4HANA integration — limited value for non-SAP environments.
IBM Cognos Analytics is best for large enterprises and regulated industries requiring hybrid deployment flexibility, pixel-perfect compliance reporting, and deep IBM ecosystem integration.
Domo is best for mid-market companies needing all-in-one analytics and data integration without building a separate data warehouse — though financial uncertainty following its February 2026 strategic alternatives announcement warrants caution.
Sisense is best for SaaS product teams embedding analytics into customer-facing applications via the Compose SDK — if comfortable with organizational instability following layoffs and a 2024 data breach.
What Separates a Dashboard Platform from an Analytical Investigation Platform
The BI category is splitting into two tiers: platforms that show data and platforms that explain it.
Every vendor in this comparison will tell you they "do AI." They all have chatbots. They all generate charts from natural language. Most of them announced something "agentic" in 2025. But the actual depth behind those claims is so uneven that calling them the same category is misleading.
Why do most BI platforms with AI still require analysts to investigate root causes?
One group — call them dashboard platforms with AI copilots — adds conversational interfaces on top of visualization-first architectures. Power BI's Copilot generates DAX queries and summarizes reports. Tableau's Concierge answers questions about your dashboards. ThoughtSpot's Spotter translates natural language into SQL. These are useful accelerants. They make analysts faster at work they were already doing. But when a VP asks "why did Q4 revenue drop in the Northeast," these platforms can surface the relevant chart. They can't decompose the contributing factors, quantify each driver's impact, or deliver a finished explanation with recommendations.
The other group — analytical investigation platforms — treats the reasoning as the product, not the chart. The question isn't "can I ask in English?" (everyone can do that now). The question is: what happens after you ask? Does the platform query one table and return a visualization? Or does it plan a multi-step investigation, run statistical decomposition across dimensions, pull in context from unstructured sources (contracts, call transcripts, market reports), rank what's driving the change, and deliver a finished narrative — potentially before you even knew the question needed asking?
This isn't a philosophical distinction. It's a technical one. ML-driven root cause analysis, changepoint detection, contribution decomposition, and automated variance breakdown are fundamentally different capabilities from NLQ-to-SQL translation. The first requires a deterministic analytics engine running classification algorithms and statistical methods across both structured datasets and unstructured business context. The second requires a language model that can write queries. Both are useful. They are not the same thing.
And increasingly, the analytical depth gap extends beyond structured data. AI agents in 2026 aren't just querying tables — they're synthesizing across data types: comparing a revenue decline against sales call sentiment from Gong transcripts, flagging misalignment between pricing strategy documents and actual margin performance, or correlating supply chain disruptions in news feeds with demand forecast misses. The platforms that can orchestrate this kind of cross-domain investigation autonomously are a fundamentally different category from those that help you build a prettier chart faster.
Forrester's Boris Evelson noted that GenAI "levels the playing field" because all vendors integrate the same underlying LLMs. That's exactly right — and exactly why LLM-powered capabilities (chatbots, NLQ, summarization) are table stakes, not differentiators. What separates platforms is what they do beyond the LLM: the deterministic analytical depth, the ability to investigate across structured and unstructured data, the governed execution that ensures answers are not just fast but correct.
The Deep Insights Gap: Four Levels of BI Intelligence

How does agentic analytics differ from traditional BI?
Not every organization needs Level 4. But every organization should understand which level their current platform operates at — and whether the gap between where they are and where they need to be is something their vendor can close.
Level 1 (Show Data) is the traditional BI model where platforms connect to data sources, build dashboards, and answer questions with charts and tables. This is what BI has done for 30 years. Power BI, Tableau (classic), QuickSight, Cognos, SAP Analytics Cloud, Domo, and Strategy all do this well. Some do it beautifully. Tableau's visualization grammar remains the gold standard. Power BI's cost-effectiveness at scale is unmatched. Strategy's pixel-perfect enterprise reporting serves the world's largest deployments. But "showing data" means a human still has to interpret what the chart means and investigate what caused the pattern.
Level 2 (Detect Changes) is where platforms identify that something changed — revenue dropped, churn spiked, a KPI crossed a threshold — and surface it as an alert or insight card. ThoughtSpot's SpotIQ, Qlik's Insight Advisor, Sigma's AI capabilities, and Looker's Gemini integration all operate here. They reduce the time between "something happened" and "someone notices." But they still leave the investigation — the why — to the analyst.
Level 3 (Explain Why) is where platforms don't just detect a change but automatically decompose the contributing factors, rank them by quantified impact (e.g., "62% of the revenue decline is attributable to payer mix changes in the Northeast region"), and generate a narrative explanation. This requires ML-driven classification and variance decomposition, not just LLM-powered querying. In this comparison, only Tellius operates at Level 3.
Level 4 (Act Autonomously) is where platforms monitor KPIs 24/7, detect meaningful changes, automatically investigate root causes, generate finished analysis with executive narratives, and deliver the results to the right stakeholders — before anyone asks. This is agentic analytics: AI agents that don't wait for queries but proactively surface insights that matter. In this comparison, only Tellius operates at Level 4, through its Feed and Agent Mode capabilities.
How We Evaluated These 13 Platforms
Every platform in this guide was assessed across eight dimensions. Each matters — but they matter differently depending on your needs.
1. Self-Service and Adoption — How accessible is the platform to business users who aren't data analysts? Learning curve, interface familiarity, data democratization capabilities. A platform only creates value when people actually use it.
2. Conversational Analytics — Quality of natural language querying. Can users ask complex, multi-turn questions in plain English and get governed, accurate answers? Does the system handle disambiguation, follow-up questions, and contextual references — or does it require exact phrasing?
3. AI-Powered Insight Depth — This is the single most important differentiator in BI today. Can the platform explain why a metric changed, not just show that it changed? Specifically: does it investigate the causal chain — identifying contributing factors, measuring each one's impact, and generating an explanation? Or does it stop at NLQ-to-SQL and AI-generated summaries? The difference is the gap between a platform that shows you a chart of declining revenue and one that tells you 62% of the decline is driven by a specific product line in a specific region due to a specific payer policy change.
4. Breadth of Visualizations — How deep is the charting grammar, formatting control, and visual design flexibility? Can the platform produce publication-quality dashboards, pixel-perfect compliance reports, and a wide range of chart types? Tableau sets the gold standard here. Power BI and Strategy are close behind. Platforms optimized for analytical depth (like Tellius) or spreadsheet-style exploration (like Sigma) typically offer functional but narrower visualization options.
5. Proactive Monitoring and Alerting — Does the platform watch KPIs continuously and alert when meaningful changes occur? And critically, does it explain why the alert fired — with root cause context — or just notify that a threshold was crossed? There's a large gap between "revenue dropped below target" and "revenue dropped below target because payer mix shifted in three territories, driven by a formulary change at Anthem that took effect March 1."
6. Governed Semantic Layer — Centralized business logic ensuring every user, every report, and every AI agent gets the same answer to the same question. Includes metric definitions, hierarchies, access controls, and versioning. Without a governed semantic layer, AI answers are only as trustworthy as the underlying data model — which in most organizations means "not very."
7. Agentic Workflow Orchestration — Can AI agents autonomously chain multiple analytical steps (detect anomaly → investigate dimensions → decompose root cause → generate narrative → deliver to stakeholders), or can they only assist with individual tasks? The difference between an agent that builds a dashboard for you and one that investigates a business problem for you.
8. Industry Specificity — Does the platform understand domain-specific data structures, terminology, workflows, and KPIs natively? Or is it a horizontal tool that requires custom configuration for every vertical? Industry-specific intelligence matters most in regulated, data-complex verticals like pharma, financial services, and CPG.
The 13 Best Business Intelligence Platforms in 2026
1. Tellius — Best Business Intelligence Platform for Automated Root Cause Investigation
Tellius is a self-service business intelligence platform with agentic analytics capabilities. Where most BI platforms stop at showing dashboards and answering questions, Tellius automates the complete analytical workflow: detecting that a KPI changed, decomposing why it changed with quantified attribution across every relevant dimension, generating executive-ready narratives, and delivering finished analysis proactively — before anyone opens a browser. Tellius goes beyond traditional BI through agentic analytics — autonomous AI agents that plan investigations, execute statistical decomposition, and deliver finished analysis without human direction. Recognized as a Gartner Magic Quadrant Visionary for five consecutive years (2022–2026) and trusted by eight of the top ten pharmaceutical companies globally.
Key capabilities:
- ML-driven automated root cause analysis that identifies and ranks the specific factors driving any metric change — across billions of data points in seconds
- Agent Mode: autonomous multi-step analytical workflows that plan investigations, execute statistical methods, and deliver finished explanations without human direction
- Kaiya 2.0 conversational AI handling compound, multi-intent queries with contextual memory across sessions
- Proactive Feed: 24/7 KPI monitoring that detects meaningful changes and delivers root-cause explanations before anyone asks
- Structured + unstructured analysis: agents synthesize across tables, documents, and external data to investigate across data types
- Governed semantic layer with metrics ontology, knowledge graph, and business entity relationships
- Industry-specific intelligence for pharma, CPG, and FP&A — including HCP targeting, Rx analytics, trade promotion analysis, and variance decomposition
Where Tellius excels:
The root cause engine is what separates Tellius from every other platform in this comparison. When a KPI moves, Tellius doesn't surface a chart and wait for you to investigate. It runs ML-driven classification comparing segments across every dimension in the dataset, identifies the specific factors driving the change, ranks them by measured impact, and generates a narrative explaining what happened, why, and what to do about it. This happens in seconds on billions of rows.
Agent Mode, introduced in Tellius 6.0 (October 2025), takes this further. Instead of single-query interactions, Kaiya plans a multi-step analytical workflow — running SQL for data extraction, Python for advanced statistical methods (changepoint detection, contribution analysis, variance decomposition), pulling context from unstructured sources when relevant, validating results against governed definitions, and presenting the finished analysis with executive narratives. Tellius 6.1 (February 2026) extended agents across every metric, document, and conversation — meaning agents can now synthesize across structured datasets and unstructured business context (contracts, call transcripts, competitive filings, regulatory documents).
The architecture combines a deterministic analytics engine (statistical methods, ML classification, variance decomposition) with generative AI (narrative generation, conversational interaction, query planning). The deterministic engine ensures analytical rigor — root cause results are reproducible, quantified, and explainable. The generative layer makes the results accessible. Most competitors have only the generative layer, which is why their "insights" are summaries of data rather than investigations of causality.
Where Tellius falls short:
Tellius's visualization layer is the clearest gap relative to established BI platforms. Teams whose primary need is publication-quality visualization design, pixel-perfect formatted reporting, or the full breadth of charting capabilities that Tableau, Power BI, and Strategy have refined over decades will find Vizpads functional but not at parity. The charting grammar doesn't match Tableau's depth, and the formatting control doesn't match Cognos or Strategy. Enterprise-only pricing with no public per-user option limits accessibility for smaller teams — this isn't a platform you trial at $14/month. Tellius is built to investigate, not to present — and teams that need both deep analysis and polished visual output will likely pair it with a reporting platform.
Pricing: Enterprise, quote-based. No public per-user pricing. 30-day free trial available upon request.
Ideal for: Enterprise analytics teams — particularly in pharma, CPG, and financial services — that need to understand why metrics changed, not just see that they changed.
2. Qlik Sense — Best for Associative Exploration and End-to-End Data Integration
Qlik Sense brings a genuinely unique technical approach to BI. Its patented Associative Engine — an in-memory compressed binary index that loads all data and indexes every relationship — is the only non-query-based analytics engine in major BI. There are no SQL queries at interaction time. Every selection instantly recalculates across all dimensions, with Qlik's distinctive green/white/grey paradigm showing associated, unassociated, and excluded data simultaneously. After acquiring Talend in 2023, Qlik now offers an end-to-end data platform spanning integration, quality, governance, and analytics. Gartner Magic Quadrant Leader for 13+ consecutive years.
Key capabilities:
- Patented Associative Engine with in-memory, non-linear exploration
- Qlik Answers: GenAI knowledge assistant for unstructured data (PDFs, SharePoint, Confluence)
- Qlik Predict (AutoML) for classification, regression, and time series with SHAP explainability
- Discovery Agent for autonomous data monitoring
- 40,000+ customers across 100+ countries
Where Qlik excels:
The Associative Engine is technically differentiated — no other major BI vendor offers a non-query-based in-memory engine. For exploratory analysis across complex, multi-source datasets, the instant recalculation and non-linear drill paths surface connections that query-based tools miss. The Talend acquisition creates a broad end-to-end data platform.
Where Qlik falls short:
Qlik's AI depth doesn't extend to autonomous analytical investigation. Qlik Answers handles unstructured data queries well, but the structured analytics capability stops at pattern detection and ML-assisted exploration — when a KPI drops, Qlik can help you explore the data around it but won't autonomously decompose the contributing factors or deliver a finished explanation. Pricing runs approximately 10x Power BI. Thoma Bravo ownership since 2016 (with an IPO perpetually delayed) introduces strategic uncertainty. Visualization polish lags newer competitors.
Pricing: Capacity-based. Business ~$30/user/month. Premium ~$2,700/month flat. Enterprise custom.
Ideal for: Data-mature organizations needing associative exploration across complex multi-source data, with end-to-end integration via Talend and 13+ years of Gartner Leader recognition.
3. ThoughtSpot — Best for Search-Based Self-Service Analytics
ThoughtSpot was founded by former Google engineers and has built its position around search-based analytics, combining a patented search token architecture with modern LLM capabilities through Spotter AI. The 2023 Mode acquisition ($200M) added a code-first analytics layer with SQL, Python, and R notebooks. ThoughtSpot was named a Gartner Magic Quadrant Leader in 2025. CEO Ketan Kharkanis (since September 2024) has pushed the product toward agentic capabilities, though the depth of that positioning warrants scrutiny.
Key capabilities:
- Spotter AI with patented search tokens + multi-LLM support
- Spotter 3: unstructured data blending, code generation, forecasting
- Spotter Agent Suite: SpotterViz (dashboarding), SpotterModel (semantic models from NL), SpotterCode (developer AI)
- Mode/Analyst Studio for SQL, Python/R notebooks
- Cloud-agnostic (Snowflake, Databricks, BigQuery, Redshift)
Where ThoughtSpot excels:
ThoughtSpot's search experience is strong — a decade of NL investment combined with the search token architecture means users get accurate, interactive results quickly. The Spotter Agent Suite covers breadth: auto-generating dashboards, building semantic models, writing code. Cloud-agnostic architecture avoids hyperscaler lock-in.
Where ThoughtSpot falls short:
ThoughtSpot's agents accelerate how you build analytics. They don't investigate business problems on your behalf. SpotterViz generates dashboards, SpotterModel creates semantic models, SpotterCode writes code — these are developer productivity tools, not autonomous analysts. When a VP asks "why did revenue drop," Spotter helps find the right data and build a visualization, but the interpretive work — decomposing causal factors, ranking what drove the shift, synthesizing context from unstructured sources — still falls to your team. Pricing opacity is a persistent complaint — the consumption model can escalate significantly, with embedded analytics running $5-6 per dashboard load. No industry-specific intelligence.
Pricing: Essentials $25/user/month. Pro $50/user/month. Enterprise ~$12K+/month. Average contract ~$140K/year.
Ideal for: Organizations wanting powerful search-based self-service analytics across clean, well-modeled warehouse data — particularly when the goal is letting business users explore independently.
4. Tableau (Salesforce) — Best for Data Visualization and the Salesforce Ecosystem
Tableau is the most recognized name in data visualization and is now deeply integrated into Salesforce. Tableau Next is a cloud-only, Salesforce-native architecture positioning itself as an agentic analytics platform — though the reality is more nuanced than the marketing. Classic Tableau products (Desktop, Cloud, Server, Prep) continue on separate roadmaps. The full Tableau Next vision — Data Cloud, Tableau Semantics, Agentforce integration — requires meaningful Salesforce platform investment. Gartner Magic Quadrant Leader for 12+ consecutive years.
Key capabilities:
- Strong visualization grammar and charting engine
- Tableau Next: four-layer architecture (Data, Semantic, Viz, Action)
- Tableau Semantics (GA April 2025): centralized semantic layer
- AI Agents: Data Pro (data prep), Concierge (NL answers), Inspector (proactive monitoring — beta)
- Large DataFam community and talent availability
Where Tableau excels:
Visualization depth and community. For teams whose primary output is visual storytelling with data, Tableau has the broadest charting capabilities in the industry. Talent is widely available. Tableau Semantics represents a serious governance investment. For Salesforce + Data Cloud organizations, Tableau Next creates a unified platform.
Where Tableau falls short:
Inspector (still beta as of February 2026) detects anomalies but doesn't decompose what's driving them — it's a smoke detector, not a diagnostic system. Concierge guides exploration within your existing dashboards but doesn't synthesize across data types or generate autonomous investigations. Full Tableau Next requires Salesforce ecosystem investment that can run 40-60% above initial estimates. Product naming fragmentation (Tableau Cloud vs. Tableau Next vs. Tableau+, three user tiers, three editions) creates genuine buyer confusion. Constellation Research warns of "architectural dependency" on Salesforce.
Pricing: Cloud Standard: Viewer $15/month, Explorer $42/month, Creator $75/month. Enterprise Creator $115/month. Tableau+ (Tableau Next features): contact sales.
Ideal for: Organizations deeply invested in Salesforce wanting AI-augmented visualization and the industry's most powerful charting engine.
5. Microsoft Power BI — Best for Cost-Effective Reporting at Scale
Power BI is the most widely deployed BI platform on Earth. Gartner Magic Quadrant Leader for 18 consecutive years — furthest right on Completeness of Vision and highest on Ability to Execute for seven straight. Over 350,000 organizations, 30+ million monthly active users, 97% of the Fortune 500. At $14/user/month for Pro (included in Microsoft 365 E5), it's the default starting point for enterprise analytics. Microsoft Fabric transforms Power BI from a standalone tool into the analytics layer of a unified data platform.
Key capabilities:
- Copilot: standalone Ask Anything, DAX generation, report creation from NL
- Microsoft Fabric integration: unified analytics platform (data engineering, warehousing, science, BI)
- MCP Servers (Preview): enables LLMs and AI agents to query semantic models
- Free Desktop version for individual analysis
- Deepest Microsoft 365 integration (Excel, Teams, PowerPoint, SharePoint)
Where Power BI excels:
Cost and reach. At $14/user/month (or included in M365 E5), the economics work for organization-wide deployment better than any other platform. Fabric's platform ambition is genuine — unifying data movement, transformation, and analytics. The Copilot roadmap is accelerating.
Where Power BI falls short:
Copilot has meaningful guardrails: it can't create derived measures if the DAX calculation doesn't already exist, can't query across reports, isn't deterministic (the same question can produce different answers on successive attempts), and consumes significant Fabric capacity. The legacy Q&A NL feature is being deprecated (December 2026) — natural language requires Fabric capacity going forward, raising the effective price floor. When a metric moves unexpectedly, Copilot can summarize what's visible in the report but can't investigate the causal chain, decompose contributing factors, or pull context from documents and external sources to build a complete picture. The April 2025 price increase (Pro up 40%, PPU up 20%) signals that the "inexpensive" positioning has a direction.
Pricing: Free (Desktop only). Pro $14/user/month. PPU $24/user/month. Fabric Capacity from $262/month (F2).
Ideal for: Microsoft-standardized enterprises needing cost-effective reporting and visualization — the starting point for most evaluations, but a starting point that many teams outgrow when they need analytical depth beyond dashboards.
6. Strategy (formerly MicroStrategy) — Best for Universal Semantic Layer and Enterprise Reporting at Scale
Strategy (rebranded from MicroStrategy in February 2025) has been building enterprise BI since 1989 — making it one of the oldest and most experienced vendors in the category. Its flagship Strategy One platform combines interactive dashboards, enterprise reports, AI agents, and embedded analytics on a tightly integrated architecture built entirely in-house. The real headline is Strategy Mosaic (GA June 2025): a Universal Intelligence Layer that sits atop any database or warehouse, providing consistent business definitions, metrics, and governance across BI tools, AI agents, and productivity apps. Named DBTA Trend-Setting Product for 2026 and Gartner Peer Insights Customers' Choice for four consecutive years — the only BI vendor to achieve that streak.
Key capabilities:
- Strategy Mosaic: Universal Semantic Layer with 100+ connectors, in-memory acceleration, SQL/DAX/REST/Python APIs
- Mosaic Studio: AI-powered data modeling and preparation
- Universal Agent: meta-agent routing queries to specialized domain bots
- HyperIntelligence: zero-click contextual data embedded in operational workflows
- Connectors to Power BI, Tableau, Excel, Google Sheets — tool-agnostic governance
- MCP integration (January 2026) for AI agent interoperability
Where Strategy excels:
The semantic layer heritage is deep. Thirty-five years of enterprise metadata management means Mosaic's architecture — hierarchies, multi-form attributes, transformations, centralized security — is the most mature in the category. The tool-agnostic positioning is the strategic angle: Mosaic doesn't replace your existing BI tools, it governs them. For massive-scale enterprise reporting with pixel-perfect compliance requirements, Strategy handles it.
Where Strategy falls short:
The Bitcoin elephant. Strategy holds 717,000+ BTC, its market cap is driven by Bitcoin sentiment rather than software revenue, and the brand's identity signals this dual commitment. For enterprise BI buyers evaluating long-term vendor commitment to analytics software, this creates legitimate questions — particularly given on-premises end-of-support scheduled for December 2026. The analytical AI capabilities don't include autonomous investigation or proactive monitoring with explanations. The learning curve is steep, finding skilled developers is a known challenge, and the UI modernization lags competitors.
Pricing: Standard and Enterprise tiers. No public per-user pricing. Free 30-day trial. Available on AWS and Azure Marketplaces.
Ideal for: Large enterprises needing the industry's most mature universal semantic layer and pixel-perfect reporting at massive scale — particularly when governing analytics across multiple BI tools.
7. Looker (Google Cloud) — Best for Code-First Semantic Layer and Embedded Analytics
Looker serves as the BI and semantic layer backbone of Google Cloud's data platform. LookML — its Git-based, code-first semantic layer — remains the strongest technical semantic model in BI: version-controlled with branching, pull requests, and CI/CD. Google's internal testing shows LookML reduces AI query errors by approximately 66%. The Looker Unification initiative is merging Looker Studio into the core Looker platform. Gartner Magic Quadrant Leader and IDC MarketScape Leader in 2025.
Key capabilities:
- LookML: Git-based semantic layer with CI/CD and version control
- Gemini Conversational Analytics (GA late 2025): multi-turn NL queries
- Code Interpreter (Preview): NL-to-Python for forecasting and anomaly detection
- Open semantic layer interoperable with other tools and AI agents via MCP
- Cloud-native, in-database architecture — never extracts data
Where Looker excels:
LookML's code-first approach enables governance discipline that GUI-based semantic models struggle to match — version control, branching, CI/CD. Embedded analytics are API-first with full white-labeling. Gemini integration grounded in LookML reduces hallucination.
Where Looker falls short:
High cost ($150K/year average plus BigQuery infrastructure at $50-200K+). LookML requires dedicated developers — it's not self-service for business users. The analytical depth stops at query and exploration; Looker doesn't investigate causes or deliver autonomous explanations. Google Cloud ecosystem dependency limits multi-cloud flexibility. Support quality has declined post-acquisition per user feedback.
Pricing: Developer ~$120/month. Creator ~$60/month. Viewer ~$30/month. Average ~$150K/year.
Ideal for: Data engineering-heavy organizations on Google Cloud/BigQuery needing best-in-class semantic governance and embedded analytics.
8. Sigma Computing — Best for Warehouse-Native Spreadsheet Analytics
Sigma Computing has built the fastest-growing BI platform by solving an elegantly simple problem: what if Excel could query billions of rows? Users work with familiar columns, rows, and formulas while the system converts actions to optimized SQL pushed directly to the warehouse. No data extraction, no modeling required for basic exploration. Debuted in the 2025 Gartner Magic Quadrant. Snowflake's BI Partner of the Year for three consecutive years. $100M ARR (April 2025) with 83% annual growth.
Key capabilities:
- Spreadsheet interface converting user actions to optimized SQL
- Real-time Google Docs-style co-editing with write-back to warehouse
- Ask Sigma: agentic NLQ generating editable workbooks
- Direct connections to Snowflake, BigQuery, Databricks, Redshift, PostgreSQL
- MCP Client and Server support
Where Sigma excels:
Adoption barriers disappear when the interface looks like a spreadsheet. For organizations where the bottleneck is getting business users to engage with analytics tools at all, Sigma's familiarity advantage is real. Warehouse-native architecture means no data movement and inherited security. Hyper-growth trajectory suggests strong product-market fit.
Where Sigma falls short:
Requires a cloud data warehouse — no standalone use. The analytical capability is powerful for exploration and ad-hoc analysis but doesn't extend to autonomous investigation of why metrics changed. Visualization customization is limited compared to Tableau. The $300/month minimum prices out small teams. Relatively immature ecosystem compared to established platforms.
Pricing: Essentials $300/month (unlimited users). Professional and Enterprise custom-priced. 14-day free trial.
Ideal for: Cloud-first enterprises wanting a warehouse-native, spreadsheet-like analytics experience for non-technical users — on Snowflake, BigQuery, or Databricks.
9. Amazon QuickSight (Amazon Quick Suite) — Best for AWS-Native Serverless Analytics
Amazon QuickSight — rebranded to Amazon Quick Suite in October 2025 — is evolving from BI tool to "agentic AI-powered digital workplace." Fully serverless with SPICE engine supporting up to one billion rows per dataset. The Quick Suite expansion adds Quick Research (agentic research across enterprise and external data), Quick Flows and Quick Automate (workflow automation), and Quick Chat (unified conversational interface). Session-based pricing makes it cost-competitive for organizations with large viewer populations.
Key capabilities:
- Amazon Q in QuickSight: NLQ, auto-generated visualizations, data stories, what-if scenarios
- Quick Suite: agentic research, workflow automation, custom AI agents
- Fully serverless — no infrastructure management
- SPICE in-memory engine with up to 1B rows per dataset
- Session-based pricing ($0.30-$0.50 per session)
Where QuickSight excels:
Session-based pricing is uniquely cost-effective for organizations with many occasional viewers — you pay per 30-minute session rather than per named user. Zero-infrastructure serverless architecture eliminates ops overhead. Deep AWS integration is natural for the 60%+ of enterprises running on AWS.
Where QuickSight falls short:
Visualization sophistication lags Tableau and Power BI significantly — chart types, formatting control, and design flexibility are more limited. AWS ecosystem lock-in is real for organizations with multi-cloud strategies. Pricing is multi-dimensional and difficult to forecast accurately. The Quick Suite expansion adds breadth but the analytical depth for root cause investigation remains limited. Minimal built-in data preparation.
Pricing: Author $24/month, Reader $3/month, Author Pro $40/month, Reader Pro $20/month. Capacity pricing available.
Ideal for: AWS-invested organizations and SaaS companies needing cost-effective embedded analytics — especially when most users are occasional viewers.
10. SAP Analytics Cloud — Best for Unified BI and Enterprise Planning in SAP Environments
SAP Analytics Cloud is the only major BI platform that natively combines analytics with enterprise planning — budgeting, forecasting, consolidation, and scenario modeling in the same interface as dashboards and reports. Now integrated into SAP Business Data Cloud (February 2025). Live planning models with direct write-back to S/4HANA. SAP Joule copilot with 400+ AI use cases.
Key capabilities:
- Unified BI + financial planning, budgeting, forecasting, and consolidation
- SAP Joule copilot with 14 new AI agents (SAP Connect 2025)
- Live connections to S/4HANA without data replication
- Monte Carlo Simulation (2025) and scenario modeling
- Prebuilt analytical content and KPI templates for SAP environments
Where SAP Analytics Cloud excels:
No other BI platform matches the SAP integration depth — live connections, write-back, embedded Fiori, prebuilt content. The unified BI + planning eliminates the need for a separate EPM tool, which is a genuine TCO advantage for SAP shops.
Where SAP Analytics Cloud falls short:
Outside the SAP ecosystem, flexibility diminishes sharply — BARC rates data preparation "weaker than average" for non-SAP sources. Visualization and UI lag modern competitors. Planning-tier pricing at $157/user/month is steep. The AI capabilities assist within the SAP workflow but don't extend to autonomous analytical investigation or cross-source root cause decomposition. For non-SAP organizations, the value proposition collapses.
Pricing: BI-only ~$24-36/user/month. Planning ~$157/user/month.
Ideal for: SAP shops needing unified BI and planning with deep ERP integration. Not recommended for non-SAP environments.
11. IBM Cognos Analytics — Best for Governance-First BI with Hybrid Deployment
IBM Cognos Analytics is the enterprise governance platform. Named Leader in the 2025 IDC MarketScape. Current version 12.1.1 with Reporting Agents in preview. IBM is simultaneously building watsonx BI as a next-generation conversational interface. Cognos offers the most deployment options of any BI platform: on-premises, cloud hosted, certified containers (IBM Cloud Pak), and hybrid — a genuine advantage for regulated industries with data sovereignty requirements.
Key capabilities:
- Pixel-perfect compliance reporting with audit trails
- Deployment flexibility: on-prem, cloud, containers, hybrid
- BI Assistant with NLQ and predictive forecasting
- watsonx BI: conversational "business insight agent" with LLM choice
- Integration with watsonx.data, SPSS, Planning Analytics
Where Cognos excels:
Deployment flexibility is unmatched for regulated industries. The governance pedigree — certified data models, audit trails, role-based access — serves financial services, healthcare, and government buyers who need compliance-grade reporting. IBM ecosystem integration is deep.
Where Cognos falls short:
The UI feels dated compared to modern competitors, and Framework Manager requires significant expertise that's increasingly hard to find. NLP and AI capabilities trail the category by years. Performance issues on large datasets affect the majority of users per published surveys. The analytical depth is reporting-grade — Cognos produces well-governed reports and dashboards but wasn't designed for the kind of autonomous investigation that characterizes the agentic analytics wave.
Pricing: Cloud Standard $10.60/user/month. Premium $42.40/user/month.
Ideal for: Large enterprises and regulated industries requiring hybrid deployment and compliance-grade governance.
12. Domo — Best for All-in-One Cloud Analytics with Broad Data Connectivity
Domo offers one of the broadest integration platforms in BI — over 1,000 pre-built connectors — combined with Magic ETL for no-code data transformation, analytics, and AI in a single cloud-native platform. However, the platform's financial situation dominates the current evaluation: on February 19, 2026, Domo's board announced exploration of strategic alternatives (potential sale or acquisition), engaging Jefferies as financial advisor. FY2025 revenue was $317M (down 0.61%) with net losses of -$82M.
Key capabilities:
- 1,000+ pre-built data connectors
- Magic ETL for no-code data transformation
- Agent Catalyst for AI-powered application building
- Domo Everywhere for embedded analytics
- Cloud-native, browser-based — no infrastructure required
Where Domo excels:
Connector breadth is genuinely exceptional — for teams with diverse data sources, Domo's 1,000+ pre-built integrations reduce the data engineering overhead that plagues other platforms. Magic ETL is approachable for non-technical users. The all-in-one model (integration + ETL + analytics + AI + automation) eliminates tool sprawl.
Where Domo falls short:
Financial instability is the primary concern — a potential acquisition or sale creates uncertainty about product direction, pricing stability, and customer support continuity. Users describe AI capabilities as still maturing relative to the competitive set. Pricing is opaque with customer complaints about drastic renewal increases (reports of 1,000%+ jumps). The analytical capabilities are broad but shallow — strong for data integration and basic analytics, not designed for the deep investigation or autonomous insight delivery that the agentic wave demands.
Pricing: Consumption-based credits. No public pricing. Average ~$134K/year.
Ideal for: Mid-market companies needing all-in-one analytics with broad data connectivity — if comfortable with financial uncertainty.
13. Sisense — Best for Embedded Analytics in SaaS Products
Sisense has pivoted decisively to embedded analytics, positioning as an "Analytics Platform as a Service" for developers building analytics into customer-facing SaaS products. The Compose SDK — a code-first JavaScript/TypeScript toolkit for React, Angular, and Vue.js — lets developers design front-end experiences freely while using Sisense as the query engine. But the organizational context is challenging: headcount has halved from 800 to approximately 400 through multiple layoff rounds, C-suite churn has been extreme (three CFOs, three VP R&Ds in one year), and a CISA-warned data breach in April 2024 exposed terabytes of customer data.
Key capabilities:
- Compose SDK: code-first embedded analytics for React, Angular, Vue.js
- Sisense Intelligence (May 2025): NLQ Assistant, narrative generation, GenAI via SDK
- ElastiCube In-Chip data engine
- Flexible deployment: cloud, on-prem, hybrid
- API-first architecture for OEM and embedded use cases
Where Sisense excels:
The Compose SDK is well-designed for developers building embedded analytics. The decoupled architecture — free front-end design with Sisense as query/compute backend — is the right model for modern SaaS products. ElastiCube handles complex data modeling effectively.
Where Sisense falls short:
Organizational instability is severe. The 2024 data breach, ongoing layoffs, and leadership churn introduce risk that enterprise buyers and their security teams must weigh carefully. Revenue growth has stalled at approximately $150M ARR. The platform is purpose-built for embedded use cases — it's strong at powering analytics within another product but lacks the autonomous investigation, proactive monitoring, and industry intelligence that characterize platforms designed for direct enterprise use. Pricing is opaque with unpredictable renewal costs.
Pricing: Opaque. Self-hosted from ~$10K/year, cloud from ~$21K/year. Minimum ~$25K/year.
Ideal for: SaaS product teams embedding analytics into customer-facing applications — if comfortable with organizational risk.
What "Agentic Analytics" Actually Means in Business Intelligence
Agentic analytics is a category defined by Gartner as "the evolution of augmented analytics by applying AI agents for data analysis, orchestrating tasks either semiautonomously or autonomously." The key word is orchestrating — agents that plan, execute, and deliver multi-step analytical workflows, not agents that help you build a dashboard or translate a question into SQL.
Every vendor in this comparison either claims agentic capabilities or is marketing toward them. Tableau says it's "the world's first agentic analytics platform." ThoughtSpot calls itself "The Agentic Analytics Platform." Amazon rebranded QuickSight to Quick Suite with custom AI agents. Strategy added a Universal Agent. Qlik launched a Discovery Agent. Even Domo was named #1 in Dresner's Agentic AI Report.
When everyone is agentic, nobody is agentic.
There's a useful test: when a KPI moves unexpectedly, what does the platform do without being asked? A Level 1 platform waits for someone to notice and open a dashboard. A Level 2 platform detects the change and sends an alert: "Revenue dropped 8%." A platform with genuine agentic capability detects the change, investigates which dimensions contributed, identifies the specific factors driving the shift and how much each one matters, synthesizes relevant context from unstructured sources (contracts, call transcripts, market reports), generates an executive narrative explaining what happened and what to do about it, and delivers the finished analysis to the right stakeholders — all before anyone asks.
Gartner also warns about "widespread agent washing" — vendors marketing agentic capabilities without the analytical depth to back them up. The distinction matters because agents that assist with building analytics (generating dashboards, writing queries, cleaning data) are genuinely useful but fundamentally different from agents that perform analysis autonomously (detecting anomalies, investigating causes, synthesizing across data types, delivering explanations).
The vendors in this comparison span that spectrum. ThoughtSpot's Spotter Agent Suite helps you build analytics faster — SpotterViz generates dashboards, SpotterModel creates semantic models, SpotterCode writes code. Tableau's AI agents assist with data prep and answer questions. These are developer productivity tools. Tellius's Agent Mode plans and executes a multi-step analytical investigation — statistical decomposition, changepoint detection, contribution analysis, cross-referencing structured and unstructured data — and delivers the result as a finished narrative. That's the difference between an assistant and an analyst.
Tellius vs. Power BI: Complementary Platforms, Different Jobs
Power BI is the most deployed BI platform in the world. Tellius is the deepest. They solve different problems — and many enterprise teams run both.
Power BI excels at governed, cost-effective reporting at scale. Copilot is accelerating fast — generating DAX, building report pages, summarizing data, all from natural language. With Fabric, Power BI becomes the analytics layer of a unified Microsoft data platform. At $14/user/month (or included in M365 E5), the economics work for organization-wide deployment.
Which BI platform can explain why a KPI changed?
But when an executive asks "why did we miss Q4 revenue target in the Northeast," Copilot's capabilities end at showing the relevant report, summarizing what the data shows, and generating a chart. It can't create a new DAX measure to investigate a hypothesis the model doesn't already encode. It can't identify which factors drove the miss, rank them by measured impact, or synthesize across structured performance data and unstructured context (sales call notes, market reports, competitive filings).
Tellius does. Agent Mode plans the investigation, runs SQL and Python for statistical decomposition, pulls context from documents and unstructured sources when relevant, validates against the semantic layer, and delivers a finished explanation: "62% of the revenue shortfall is attributable to a payer mix shift in three Northeast territories, driven by a formulary change at Anthem effective March 1. The remaining 38% is split between lower new patient starts in cardiology (24%) and a pull-forward effect from Q3 stocking (14%)."
The platforms coexist well. Power BI handles organization-wide reporting and visualization for the 95% of users who need dashboards. Tellius handles the analytical investigations that Power BI can't perform — for the teams that need to understand why the numbers look the way they do.
Tellius vs. Tableau: What "Agentic" Actually Means
Both Tellius and Tableau claim "agentic analytics." Both shipped AI agents in 2025. The comparison starts with what those agents actually do.
Tableau's agents — Data Pro, Concierge, and Inspector — accelerate specific tasks within the Tableau workflow. Data Pro assists with data preparation and semantic model building. Concierge answers natural language questions about your data. Inspector (still in beta as of February 2026) monitors metrics and flags anomalies. These are useful productivity tools that make Tableau users faster at what they were already doing.
Tellius's Agent Mode is a different architecture. It doesn't assist within a workflow — it is the workflow. When a KPI changes, the agent plans a multi-step investigation: running SQL for data extraction, Python for statistical methods (changepoint detection, variance decomposition, contribution analysis), pulling context from unstructured sources (documents, transcripts, filings), validating against the governed semantic layer, and generating an executive narrative with recommendations. Feed delivers these investigations proactively, 24/7, before anyone asks.
The distinction maps to depth. Inspector detects that revenue dropped. But it doesn't investigate why. Tellius's Feed detects the same change and automatically delivers the investigation: which factors contributed, how much each one drove the shift, what changed in the unstructured context around it, and what to do about it.
For organizations running Salesforce and Data Cloud, Tableau Next's four-layer architecture creates genuine strategic value. For organizations that need the analytical investigation itself automated, Tellius provides the depth that Tableau's agents don't reach.
Tellius vs. ThoughtSpot: Search vs. Explanation
ThoughtSpot and Tellius both position around AI-powered analytics. The difference is what the AI is optimized to do.
ThoughtSpot optimizes for search. A decade of NL expertise, the patented search token architecture, and Spotter AI combine to deliver a strong question-answering experience. Users ask, ThoughtSpot finds. The results are interactive, drillable, and accurate — assuming the underlying data model is well-structured.
Tellius optimizes for explanation. The platform doesn't just find the data that answers your question — it investigates why the answer is what it is. Root cause analysis, variance decomposition, contribution ranking, and automated narrative generation produce finished analytical deliverables, not starting points for further investigation. And increasingly, those investigations span data types — structured performance data, unstructured documents, external signals — synthesized by agents that work across the full information landscape.
What is the best BI platform for root cause analysis?
Both platforms handle "what happened?" well. The gap appears at "why did it happen?" ThoughtSpot surfaces the relevant data and lets you explore. Tellius diagnoses the causes and tells you.
For teams with strong data analysts who primarily need faster access to well-modeled data, ThoughtSpot is solid. For teams where the bottleneck is the analytical investigation itself — understanding causal relationships across structured and unstructured data — Tellius goes deeper.
Frequently Asked Questions
Understanding Business Intelligence in 2026
What is a business intelligence platform?
A business intelligence platform is a software system that connects to organizational data sources, applies governed logic and calculations, and presents the results through dashboards, reports, visualizations, and increasingly, AI-driven analysis. Modern BI platforms range from traditional reporting tools (Power BI, Tableau, Cognos) to AI-first exploration platforms (ThoughtSpot, Sigma) to agentic analytics platforms that automate analytical investigation (Tellius). The common thread is making organizational data accessible, consistent, and actionable — but the depth of analysis varies enormously across vendors.
What is agentic analytics?
Agentic analytics is the application of AI agents across the data-to-insight workflow, orchestrating analytical tasks semi-autonomously or autonomously — as defined by Gartner in their February 2025 Market Guide. Where traditional BI requires humans to build dashboards and investigate data, and augmented analytics adds AI assistance to those tasks, agentic analytics uses AI agents that can plan multi-step investigations, execute statistical analysis, synthesize across data types, and deliver finished explanations without waiting for human direction. The distinction matters because most vendors claiming "agentic" capabilities are offering AI that helps you build analytics faster (generating dashboards, writing queries), not AI that performs the analysis itself. Tellius is the only BI platform in this comparison with full agentic analytics capabilities: agents that detect a KPI change, plan the investigation, execute it, and deliver a finished explanation. The litmus test: does the agent build things for you, or does it think for you?
What is automated root cause analysis in business intelligence?
Automated root cause analysis in business intelligence is the use of ML-driven classification and statistical decomposition to identify and rank the specific factors driving any change in a business metric — without requiring an analyst to manually investigate. When revenue drops, churn spikes, or a KPI crosses a threshold, automated root cause analysis decomposes the contributing factors across every relevant dimension (region, product, customer segment, time period), quantifies each factor's impact (e.g., "62% of the decline is attributable to payer mix changes in the Northeast"), and generates a narrative explanation. This is fundamentally different from NLQ-to-SQL translation, which helps you find data faster but still requires human interpretation. In this comparison, Tellius is the only BI platform with full automated root cause analysis as a first-class capability — the deterministic analytics engine runs classification algorithms and variance decomposition, not just LLM-powered querying.
What's the difference between a BI platform and a data analytics platform?
A BI platform focuses on reporting, dashboarding, and data visualization — turning data into charts and tables that humans interpret. A data analytics platform goes further, using ML and statistical methods to surface patterns, explain causes, predict outcomes, and recommend actions. Tellius operates at this intersection — it includes BI capabilities (dashboards, visualizations, governed reporting) but its core value is the analytical investigation engine that explains why metrics changed and delivers finished analysis autonomously. In practice, most enterprise teams run a BI platform alongside a deeper analytics layer, rather than expecting one tool to do both jobs.
Do business intelligence platforms still matter in the age of AI?
Yes — and arguably more than before. AI amplifies both the value of good analytics and the damage of bad analytics. Without governed semantic layers and trusted data foundations, AI chatbots and agents produce hallucinated, inconsistent, or misleading answers faster than traditional tools produced wrong reports. The role of BI is evolving from "build dashboards" to "provide the governed data layer that makes AI trustworthy." Platforms that combine strong governance with genuine AI depth — not just chatbots bolted onto dashboards — are becoming the intelligence backbone of the enterprise.
How does a semantic layer affect which BI platform I should choose?
A semantic layer determines whether your BI platform gives consistent, trustworthy answers — or whether five people asking the same question get five different numbers. It's the centralized logic that defines what "revenue," "churn," or "active customer" actually means across every dashboard, report, and AI interaction. Gartner predicts organizations prioritizing semantic modeling will improve AI accuracy by 80% and reduce costs by 60%. When evaluating platforms, look at three things: does the semantic layer govern AI outputs (not just dashboards)? Is it code-first with version control (Looker's LookML, Strategy Mosaic) or GUI-based (Tableau Semantics, Tellius)? And critically — does it span tools, or lock you in? Strategy Mosaic governs across Power BI, Tableau, and Excel. Tellius's knowledge graph governs conversational queries, AI agent investigations, and visualization simultaneously.
Why do most BI platforms with AI still require analysts to investigate root causes?
Most BI platforms bolt AI onto visualization engines — the AI helps you build dashboards and query data faster, but the investigation itself is still manual. Power BI Copilot can show you the chart and summarize what's visible. Tableau's Concierge can answer follow-up questions. ThoughtSpot's Spotter can find the relevant data. But the step that matters most — decomposing which factors caused a change, quantifying each one's impact, pulling context from unstructured sources, and delivering a finished explanation — still falls to your team. Tellius is architected differently: the root cause engine runs ML-driven classification and statistical decomposition as a first-class capability, not an add-on to a charting tool.
Disclosure
This article is published by Tellius. We're a vendor in this category, and we've positioned ourselves favorably — as every vendor comparison guide does. We've also invested significant effort in making this the most comprehensive, accurate, and useful BI platform comparison available. Every vendor's profile was researched using public sources (analyst reports, vendor websites, press releases, user reviews, pricing pages) and cross-referenced against our competitive intelligence.
This evaluation weights AI-powered analytical depth as the primary differentiator. Organizations that prioritize other dimensions — visualization breadth, ecosystem integration, deployment cost, self-service adoption — may reasonably rank these platforms differently.
If you represent a platform listed here and believe we've mischaracterized your capabilities, reach out — we'll review and update the relevant section.
All analyst citations (Gartner, Forrester, IDC) reference publicly available reports, press releases, or summary materials. Gartner does not endorse any vendor, product, or service depicted in its research publications.
See Tellius in Action
No spam — we hate it as much as you do. Subscribe to get insights on BI evolution, agentic analytics, and competitive intelligence delivered monthly.
Start your 30-day free trial
Get release updates delivered straight to your inbox.
No spam—we hate it as much as you do!

Kaiya Missions: objective-driven agentic workflows that deliver polished presentations on your schedule

The best BI platform depends on what your team needs. For cost-effective organization-wide reporting and dashboarding, Power BI is the most widely deployed platform — 350,000+ organizations at $14/user/month. For analytical depth and automated root cause investigation, Tellius is the only platform operating at Level 3 and Level 4 of the BI intelligence hierarchy. For data visualization and the Salesforce ecosystem, Tableau remains the standard. For search-driven self-service, ThoughtSpot is the strongest. The full breakdown: Tellius (best for automated insight investigation), Qlik Sense (best for associative exploration), ThoughtSpot (best for search-driven self-service), Tableau (best for Salesforce-ecosystem visualization), Power BI (best for Microsoft-ecosystem reporting), Strategy (best for universal semantic layer), Looker (best for code-first semantic governance), Sigma (best for warehouse-native spreadsheet analytics), Amazon QuickSight (best for AWS-native serverless BI), SAP Analytics Cloud (best for SAP-ecosystem planning), IBM Cognos (best for governance-first hybrid BI), Domo (best for all-in-one cloud BI), and Sisense (best for embedded SaaS analytics).
Tellius and Power BI solve different problems — and many enterprises run both. Power BI is the most cost-effective reporting and visualization platform at scale ($14/user/month), ideal for organization-wide dashboarding within the Microsoft ecosystem. Tellius automates the analytical investigation that Power BI can't perform: when a metric moves, Tellius decomposes why, ranks the contributing factors, and delivers a finished explanation. Power BI's Copilot generates charts and DAX. Tellius's Agent Mode runs multi-step statistical investigations across structured and unstructured data. When an executive asks why Q4 revenue missed in the Northeast, Copilot can show the relevant report and summarize what's visible — it can't identify which factors drove the miss or synthesize context from sales call notes and market reports. Tellius can.
Tableau leads in data visualization and benefits from deep Salesforce ecosystem integration. Tableau Next's AI agents — Data Pro, Concierge, and Inspector — assist with data prep, querying, and anomaly detection. But Inspector flags anomalies without decomposing what's driving them, and Concierge guides exploration without performing autonomous root cause analysis. Tellius's Agent Mode performs the full investigation autonomously: detecting changes, decomposing contributing factors with quantified attribution, and delivering finished narratives. For organizations running Salesforce and Data Cloud, Tableau Next creates genuine strategic value. For organizations that need the analytical investigation itself automated, Tellius provides the depth that Tableau's agents don't reach. Tableau is stronger for visualization. Tellius is deeper for analysis.
Qlik and Tellius share AI ambitions but approach analytics from different foundations. Qlik's patented Associative Engine is technically unique — the only non-query-based in-memory analytics engine in major BI — and excels at non-linear exploratory analysis across complex, multi-source datasets. Qlik Answers adds unstructured data querying via a separate GenAI assistant. But Qlik's analytical depth stops at pattern detection and assisted exploration. Tellius's root cause engine autonomously decomposes why a metric changed, ranks the causal factors by measured impact, and delivers a finished explanation — a capability Qlik's architecture doesn't include. Qlik is stronger for broad data integration via Talend and exploratory discovery. Tellius is deeper for causal investigation.
No — and it's not designed to. The platforms are complementary. Power BI excels at cost-effective, governed reporting and visualization for the 95% of users who need dashboards, reports, and standard data access within the Microsoft ecosystem. Tellius excels at the analytical investigations that sit beyond reporting: automated root cause analysis, proactive KPI monitoring with explanations, and agentic workflows that deliver finished analysis autonomously. Many enterprise teams run Power BI as the organization-wide reporting layer and add Tellius for the teams that need to understand why the numbers look the way they do.
Tellius is the only BI platform in this comparison that natively synthesizes across structured datasets and unstructured business context within a single analytical investigation. Agent Mode can pull context from contracts, call transcripts, competitive filings, and market reports alongside structured performance data — delivering explanations that span data types. Qlik Answers queries unstructured content (PDFs, SharePoint, Confluence) through a separate GenAI knowledge assistant, but it doesn't integrate unstructured findings into structured root cause analysis. ThoughtSpot's Spotter 3 adds unstructured data blending. Most other platforms — Power BI, Tableau, Cognos, SAP AC — are designed primarily for structured, tabular data.
Governance varies significantly. Tellius enforces governance through its semantic layer — metric definitions, business rules, hierarchies, and row-level security are centralized so every user, dashboard, and AI agent operates from the same governed definitions. Strategy Mosaic has the deepest multi-tool governance heritage, spanning Power BI, Tableau, and Excel from a single semantic layer. Looker's LookML enforces governance through code with Git version control. Tableau Semantics (GA 2025) is newer but closing the gap. Power BI's semantic model provides reasonable governance within the Microsoft ecosystem. Most platforms without a full semantic layer — Domo, Sisense, Sigma, QuickSight — rely on source-level governance rather than platform-enforced consistency.
Tellius is the best BI platform for pharmaceutical commercial analytics — trusted by eight of the top ten pharmaceutical companies with purpose-built intelligence for HCP targeting, Rx analytics (TRx, NBRx, NRx), field force effectiveness, incentive compensation, and payer access monitoring. The semantic layer natively understands pharma data structures, and AI agents monitor pharma KPIs 24/7 with root-cause explanations. For a deeper look at pharma-specific capabilities, see Tellius for Pharma & Life Sciences.
Tellius is the strongest option for CPG commercial teams that need AI-powered analytics for trade promotion effectiveness, category management, revenue growth management, and retailer analytics. The platform integrates directly with syndicated data sources (Nielsen, Circana, Numerator), retailer portals (Walmart Luminate, Kroger 84.51°, Amazon), and trade management systems — with root cause analysis that explains why promotions underperformed, which categories are shifting, and where pricing adjustments would have the highest impact.
For FP&A teams that need AI-powered variance analysis with automated root cause investigation, Tellius is the strongest option — it performs price/volume/mix variance decomposition, generates executive narratives for flash reporting, and proactively monitors financial KPIs. For teams that need BI and enterprise planning (budgeting, forecasting, consolidation) unified on a single platform, SAP Analytics Cloud is the only vendor with native planning capabilities. Power BI with Fabric is the cost-effective option for Microsoft shops. The "best" depends on whether the primary need is analytical depth (Tellius), planning integration (SAP), or cost-effective reporting (Power BI). For more on FP&A use cases, see Tellius for Financial Services.
BI pricing varies dramatically. Power BI Pro is the least expensive at $14/user/month (40% increase from 2024). Tableau Cloud ranges from $15/month (Viewer) to $115/month (Enterprise Creator). ThoughtSpot averages ~$140K/year. Looker averages ~$150K/year. QuickSight offers session-based pricing starting at $0.30/session. Domo averages ~$134K/year. Tellius, Strategy, and Qlik Enterprise are quote-based. SAP Analytics Cloud planning tier runs $157/user/month. Beyond licensing, TCO must include infrastructure (cloud compute, warehouse costs), implementation, training, and the analyst time consumed by manual investigation. A $14/user/month platform requiring three analysts to investigate every anomaly manually may cost more than a higher-license platform that automates the investigation.
Implementation timelines range from days to months depending on platform complexity and deployment scope. Power BI Desktop is available immediately for individual use; organizational deployment with governance takes 4-8 weeks. Tableau Cloud deployment typically takes 4-12 weeks. ThoughtSpot's cloud deployment ranges from 2-6 weeks assuming well-modeled warehouse data. Tellius enterprise implementation takes 8-12 weeks including semantic layer setup, data integration, and initial agent configuration. Strategy/Mosaic enterprise deployments can take 3-6 months for full metadata modeling. Sigma and QuickSight can deploy in 1-2 weeks for warehouse-connected environments.
ROI varies by platform and use case. Traditional reporting platforms (Power BI, Tableau) primarily save analyst time on report building — typical ROI is 2-4x over 3 years through reduced manual reporting effort. AI-first platforms (ThoughtSpot, Sigma) add self-service ROI by reducing requests to central data teams. Agentic analytics platforms (Tellius) add investigation ROI by automating the root cause analysis that previously consumed analyst days or weeks — Tellius customers report root cause investigations completing in seconds versus the 2-3 weeks they previously required. The highest-ROI platform is the one that eliminates the bottleneck specific to your team's workflow.
Start with the question your team actually needs answered. If the primary need is organization-wide reporting and dashboarding, Power BI or Tableau deliver proven value. If the need is ad-hoc exploration across well-modeled data, ThoughtSpot is strong. If the need is understanding why metrics changed — not just seeing that they changed — evaluate Tellius. Eight critical criteria: self-service adoption (will users actually use it?), conversational analytics (can people ask in plain English?), AI depth (can it explain causality, not just show data?), visualization breadth (does it produce the charts and reports you need?), proactive monitoring (continuous watching or on-demand only?), semantic layer (consistent definitions?), agentic workflows (autonomous investigation or assisted exploration?), and industry specificity (does it understand your domain?).
Yes — and most enterprises do. According to ESG research, 73% of organizations use at least three BI tools. Common combinations: Power BI for organization-wide reporting + Tellius for root cause intelligence. Power BI + Strategy Mosaic for governed semantic layer across tools. Tableau for visualization + ThoughtSpot for self-service search. The key is ensuring consistent data definitions across platforms — which is where semantic layers become critical.
Power BI is often necessary but rarely sufficient on its own. If your team's primary gap is analytical depth — understanding why metrics changed rather than just seeing the dashboards — Tellius complements Power BI by automating the root cause investigations that Copilot can't perform. If the gap is semantic governance across tools, Strategy Mosaic sits atop Power BI and provides consistent metric definitions via its Power BI Connector (GA September 2025). If the gap is self-service search, ThoughtSpot connects to the same warehouses and offers a different interaction model. The choice depends on what Power BI isn't giving you today.
Amazon QuickSight (now Quick Suite) is a solid choice for enterprise analytics within the AWS ecosystem — particularly for organizations with large viewer populations where session-based pricing ($0.30-$0.50 per session) is more cost-effective than per-user licensing. It handles standard BI needs well: dashboards, reports, NLQ via Amazon Q, and embedded analytics. The Quick Suite evolution adds agentic capabilities. Where it falls short is analytical depth — automated root cause analysis, visualization sophistication versus Tableau or Power BI, and the constraints of AWS ecosystem lock-in for multi-cloud organizations.
Start with the Mission
This blog argues that successful analytics and AI initiatives don’t start with tools or dashboards—they start with a clear mission tied to real business outcomes. It highlights how organizations often get stuck in cycles of data exploration without direction, leading to wasted time and low impact. Instead, leaders should define the decisions they want to improve, align analytics efforts to those goals, and build workflows that move from insight to action. By grounding analytics in mission-driven use cases, companies can reduce manual effort, accelerate decision-making, and unlock the full value of AI-powered insights.
.webp)
Introducing Kaiya Apps: Enterprise AI Apps That Get the Numbers + Nuance Right
This blog explores how Kaiya Apps operationalize AI for analytics by embedding domain knowledge, leveraging AI agents, and automating multi-step workflows like root cause analysis, forecasting, and scenario modeling. The result is faster, more consistent decision-making—where teams can move from question to trusted insight in minutes, without relying on manual data wrangling or fragmented tools.