What's New
Changelog - 5.0.1
Release 5.0
Changelog - 4.3.4
Changelog - 4.3.3
Changelog - 4.3.2
Changelog - 4.3.1
Release 4.3 (Fall 2023)
Changelog - 4.2.7
Changelog - 4.2.6
Changelog - 4.2.5
Changelog - 4.2.4
Changelog - 4.2.3
Changelog - 4.2.2
Changelog - 4.2.1
Release 4.2
Changelog - 4.1.5
Changelog - 4.1.4
Changelog - 4.1.3
Changelog - 4.1.2
Changelog - 4.1.1
Release 4.1
Release 4.0
Release 3.9
Release 3.8
Release 3.7
Release 3.6
Release 3.5
Release 3.4
Release 3.3
Release 3.2
Release 3.1
Release 3.0
Release 2.4.1
Release 2.4
Free Cloud Trial
Release 1.8
Release 2.3
Release 2.2
Release 2.1
Release 2.0
Release 1.7
Release 1.6
Release 1.5
Getting Started
Quick Guide
Best Practices Guide
Search - Best Practices
Vizpads (Explore) - Best Practices
Insights (Discover) - Best Practices
Predict - Best Practices
Data - Best Practices
Glossary
Tellius 101
Navigating around Tellius
System requirements
Tellius Architecture
Installation steps for Tellius
Guided tours for quick onboarding
Customizing Tellius
Tellius Copilot 101
Search (Natural Language)
Search in Tellius
Guide Me
How to Search
Business View List / Columns
Query
Query
Percentage Queries
Time Period Queries
Live Query
Generating Insights-based queries from Search
Search Result
Discover Insights
Interactions
Chart Operations
Add to Vizpad
Table View
Switch Chart type
Change Chart Config
Apply Filters
Change Formatting
Measure Aggregation - Market Share Change
View Raw Data
Download/ Export
Embed URL
Partial Data for Visualization
Best-fit visual
Add to Vizpad
Adding the chart to a Vizpad
Customize the auto-picked columns
Search Query Inspector
Teach Tellius
GPT mode in Search
History
Guided Search
Add Guided Search Experience
Display Names in the Search Guide
Guided Search
Guided Search Syntax and Attributes
Deep Dive
Maps in Search
Search Keywords
Percentage Queries
Time Period Queries
Year-over-Year Analysis
Additional Filters
Pagination
List View In Search Results
Marketshare queries
Embed Search
Personalized Search
Search Cheat Sheet
Filters in Help Tellius Learn
Explore (Vizpads)
Dashboards in Tellius
Vizpad Creation
Create Interactive Content
Create Visualization Charts
List of Charts
Common Chart Types
Line Chart
Bar Chart
Pie Chart
Year-over-Year Functionality in Vizpad
Area Chart
Combo Chart
KPI Target Chart
Treemaps
Bubble Chart
Histogram
Heat-Map Charts
Scatter Chart
Other Charts
Cumulative line chart
Cohort Chart
Explainable AI Charts
For each chart
Create Visualization Charts
Global Filters
Embedded Filters
Other Content
Anomaly management for charts
Creating Interactive Content
Vizpad level Interactions
Viz level Interactions
Discover Insights
Drivers
Discover hidden insights - Genius Insights
How Genius Insights works
Discoveries in Insight
Anomalies on Trend
Interactions
Chart Operations
Switch Chart type
Change Chart Config
Apply Filters
Change Formatting
Add X/Y Axis Target Lines to Scatter Chart
Improvements to Conditional Formatting
Adding Annotations to Tables
Displaying query execution time
AI summaries
Embedding Vizpad
Vizpad Consumption
Collection of Interactive Content
Vizpad level Interactions
Global Filter on the fly
Global Resolutions
Refresh
Notifications / Alerts
Share
Download / Export
Unique name for Vizpads
Edit Column Width
Viz level Interactions
Importing bulk filter values
Multi-Business View Vizpads
Discover (Genius Insights)
Discoveries
What are discoveries
Type of Discoveries in Tellius
Create Discoveries
Kick-off Key Drivers
Edit Insights
Key Driver Insights
Components of Key Drivers
What are Key Drivers
Edit Key Driver Insights
Segment Drivers
Trend Drivers
Trend Insights (Why Insights)
Components of Trend Insights
WHAT: Top Contributors
WHY: Top Reasons
HOW: Top Recommendations
Seamlessly navigating to "Why" from "What"
Create Trend Insight
Edit Trend Insights
What are Trend Insights
Comparison Insights
Components of Comparison Insights
Create Comparison Insight
What are Comparison Insights
Edit Comparison Insights
Others Actions
Save
Refresh
Share Insights
Download
Adding Insights to Vizpad
Insights Enhancements
Embedding Insight
Impact Calculation for Top Contributors
Marketshare
Live Insights
Predict (Machine Learning)
Machine Learning
AutoML
How to create AutoML models
Leaderboard
Prediction
Others
What is AutoML
Point-n-Click Predict
Feed (Track Metrics)
Assistant (Conversations)
Tellius on Mobile devices
Data (Connect, Transform, Model)
Connectors
Connector Setup
Google BigQuery
Google Cloud SQL
Connecting to a PostgreSQL Cloud SQL Instance
Connecting to an MSSQL Cloud SQL Instance
Connecting to a MySQL Cloud SQL Instance
Snowflake
PrivateLink
Snowflake Best Practices
OAuth support for Snowflake
Integrating Snowflake with Azure AD via OAuth
Integrating Snowflake with Okta via OAuth
Edit Connector
Live Connect
Data Import
Cache
Direct Business View
JDBC connector for PrestoDB
Amazon S3
Looker SQL Interface
Databricks
Connecting to an AlloyDB Cluster
List of Connectors by Type
Tables Connections
Custom SQL
Schedule Connector Refresh
Share Connections
Datasets
Load Datasets
Configure Datasets (Measure/Dimensions)
Transform Datasets
Create Business View
Share Datasets
Copy Datasets
Delete Datasets
Swapping datasources
Metadata migration
Data Prep
Datasets
Data Profiling / Statistics
Transformations
Dataset Transform
Aggregate Transforms
Calculated Columns
SQL Transform
Python Transform
Create Hierarchies
Filter Data
SQL Code Snippets
Multiple Datasets Scripting SQL
Column Transforms
Column Metadata
Column type
Feature type
Aggregation
Data type
Special Types
Synonym
Rename Column
Filter Column
Delete Column
Variable Display Names
Other Functions
Metadata View
Dataset Information
Dataset Preview
Alter Pipeline Stage
Edit / Publish Datasets
Data Pipeline (Visual)
Alerts
Partitioning for JDBC Datasets
Export Dataset
Write-back capabilities
Data Fusion
Schedule Refresh
Business Views
Create Business View
Create Business View
Datasets Preview & List
Add datasets to Model
Joins
Column selection
Column configuration
Primary Date
Geo-tagging state/country/city
Save to Fast Query Engine
Publish
Business View
What is Data Model
BV Visual Representation (Preview)
BV Data Sample
Learnings (from Teach Me)
Custom Calculations (Report-level Calc)
Predictions on BV
BV Refresh
Export/ Download Business View
Share Business View
URL in Business View
Request Edit Access
Projects (Organize Content)
Monitor Tellius
Embedding Tellius
Embedding
Settings
About Tellius
User Profile
Admin Settings
Manage Users
Team (Users)
Details & Role
Create a new user
Edit user details
Assigning the user data to another user
Restricting the dataset for a user
Deleting a user
Assign User Objects
Teammates (Groups)
Authentication & Authorization
Application & Advanced Settings
Data
Machine Learning
Genius Insights
Usage tracking & Support
CDN
Download Business View, Dataset, and Insights for Live BV
Customize Help
Impersonate
Data Size Estimation and Calculation
Miscellaneous Application Settings
Configuration for time/date-related results
Dataflow Access
Enable In-memory operations on Live sources
Language Support
Administration
Setup & Configuration
Installation Guide
AWS Marketplace
Autoscaling
Backup and Restore
Help & Support
FAQ
Data Preparation FAQs
Environment FAQs
Search FAQs
Vizpads FAQs
Data Caching
Security FAQs
Embedding FAQs
Insights FAQs
Tellius Product Roadmap
Help and Support System
Guided Tours
Product Videos
Articles & Docs
Provide Feedback
Connect with Tellius team
Support Process
Notifications
Getting Started Videos
Getting Started
Tellius Connect
Tellius Data Overview Video
Connecting to Flat Files Video
Connecting to Data Sources Video
Live Connections Video
Data Refresh and Scheduling Video
Tellius Prep
Getting Started with Tellius Prep Video
Transformations, Indicators, Signatures, Aggregations and Filters Video
SQL and Python Video
Working with Dates Video
Data Fusion Video
Business View Video
Business Mapping Video
Report Level Calculations Video
Writeback to DB
Natural Language Search
Getting Started with Search Video
How-To Search Video
Customizing Search Results Video
Search Interactions Video
Help Tellius Learn
Explore - Vizpads
Getting Started with Vizpads Video
Creating Vizpads Video
Creating and Configuring Visualizations Video
Viz-Level Interactions Video
Vizpad-Level Interactions Video
Auto Insights
Getting Started with Auto Insights Video
Discovery Insights Video
Segment Insights Video
Trend Insights Video
Comparison Insights Video
Iterate on Insights Video
Tellius Feed Video
Predict - ML Modeling
Getting Started with Predict Video
AutoML Configuration Video
AutoML Leaderboard Video
Point-n-Click Regression Video
Point-n-Click Classification Video
Point-n-Click Clustering Video
Point-n-Click Time Series Video
Point-n-Click PythonML Video
PredictAPI Video
Apply ML Model Video
ML Refresh and Schedule Video
Admin
Best Practices & FAQs
API Documentation
Vizpad APIs
User & user groups APIs
Machine Learning APIs
Fall 2023 (4.3)
Table of Contents
- 🚀 New features
- 📈 Enhancements
- Display of columns in Search and Tellius Assistant
- ‘Weekly’ aggregation enhancements for date filters
- Additional treemap algorithms
- Enriched KPI target chart
- Vizpads generation on intranet
- Feature importance of columns
- Share objects using name
- Data type of cluster labels
- Proxy support for connectors
- Forbidden Python libraries
- 🛠️ Minor fixes
- ⛔ Deprecation
- All Categories
- What's New
- Release 4.1
Release 4.1

- 🚀 New features
- 📈 Enhancements
- Display of columns in Search and Tellius Assistant
- ‘Weekly’ aggregation enhancements for date filters
- Additional treemap algorithms
- Enriched KPI target chart
- Vizpads generation on intranet
- Feature importance of columns
- Share objects using name
- Data type of cluster labels
- Proxy support for connectors
- Forbidden Python libraries
- 🛠️ Minor fixes
- ⛔ Deprecation
We welcome 2023 with a whole new release! 🎉 We’re stoked to announce the latest version of Tellius, 4.1, which comes equipped with a collection of exciting features focused on improving context, collaboration, and visibility. Here is the comprehensive list of features and improvements introduced in 4.1:
🚀 New features
Metadata for columns
Understanding the context of every column helps business teams leverage their data and visualize insights faster. So we’ve introduced a metadata view to empower users with an optimal view of all the information about their data in one place.
With this feature, users will be able to add the following types of metadata during data preparation:
- Column description
- Display name
- Data format
- Data aggregation
- Data type
- Include/Exclude columns for Insights and Predict
- Synonyms
- Special type
- Rank
- Indexing
- Column type
- Feature type
Users can easily edit and sort the metadata of each column. The values will be reflected throughout the platform (Search, Insights, Vizpads, Predict, Feed, and Data).
In a dataset, multiple columns can be selected, and changes can be applied to them in bulk.
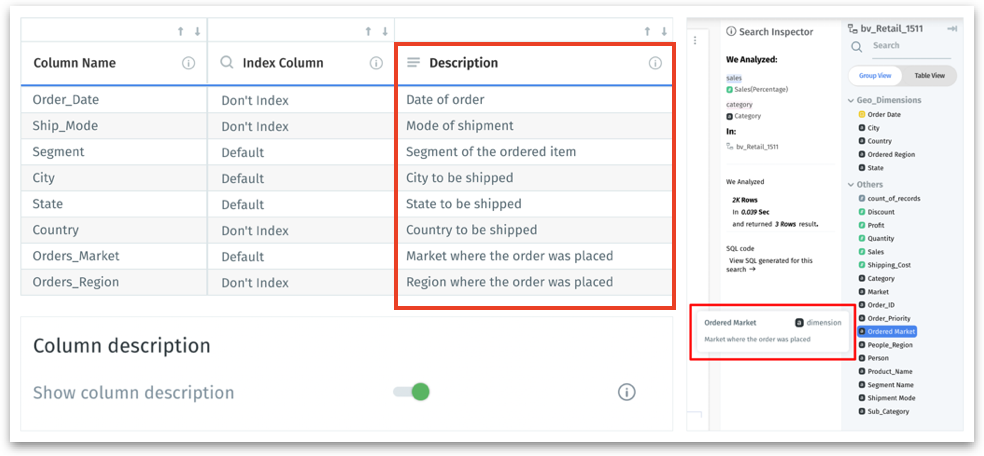
Data dictonary for columns
Data dictionary is included to help users interpret the context of each column. Across the platform, when a user hovers over a column, its corresponding description and the type of column (measure/dimension) will be displayed in the tooltip. The metadata facilitates business users to be more aware of the descriptions of columns defined in a dataset.
Selection of columns for analysis
During data preparation, users have the flexibility to choose the columns to be included for analysis. Every column comes with a toggle option to be included in Insights and Predict. The unselected columns will be excluded from any analysis by default unless modified by the user. The Insight Configuration and Insight Summary will display the list of included and excluded columns along with the reason for exclusion.
Provision to rank columns
During data preparation for live datasets, users can rank the columns (from 1 to 20) to prioritize them over the non-ranked columns. The ranked columns get auto-picked for Live Insights.
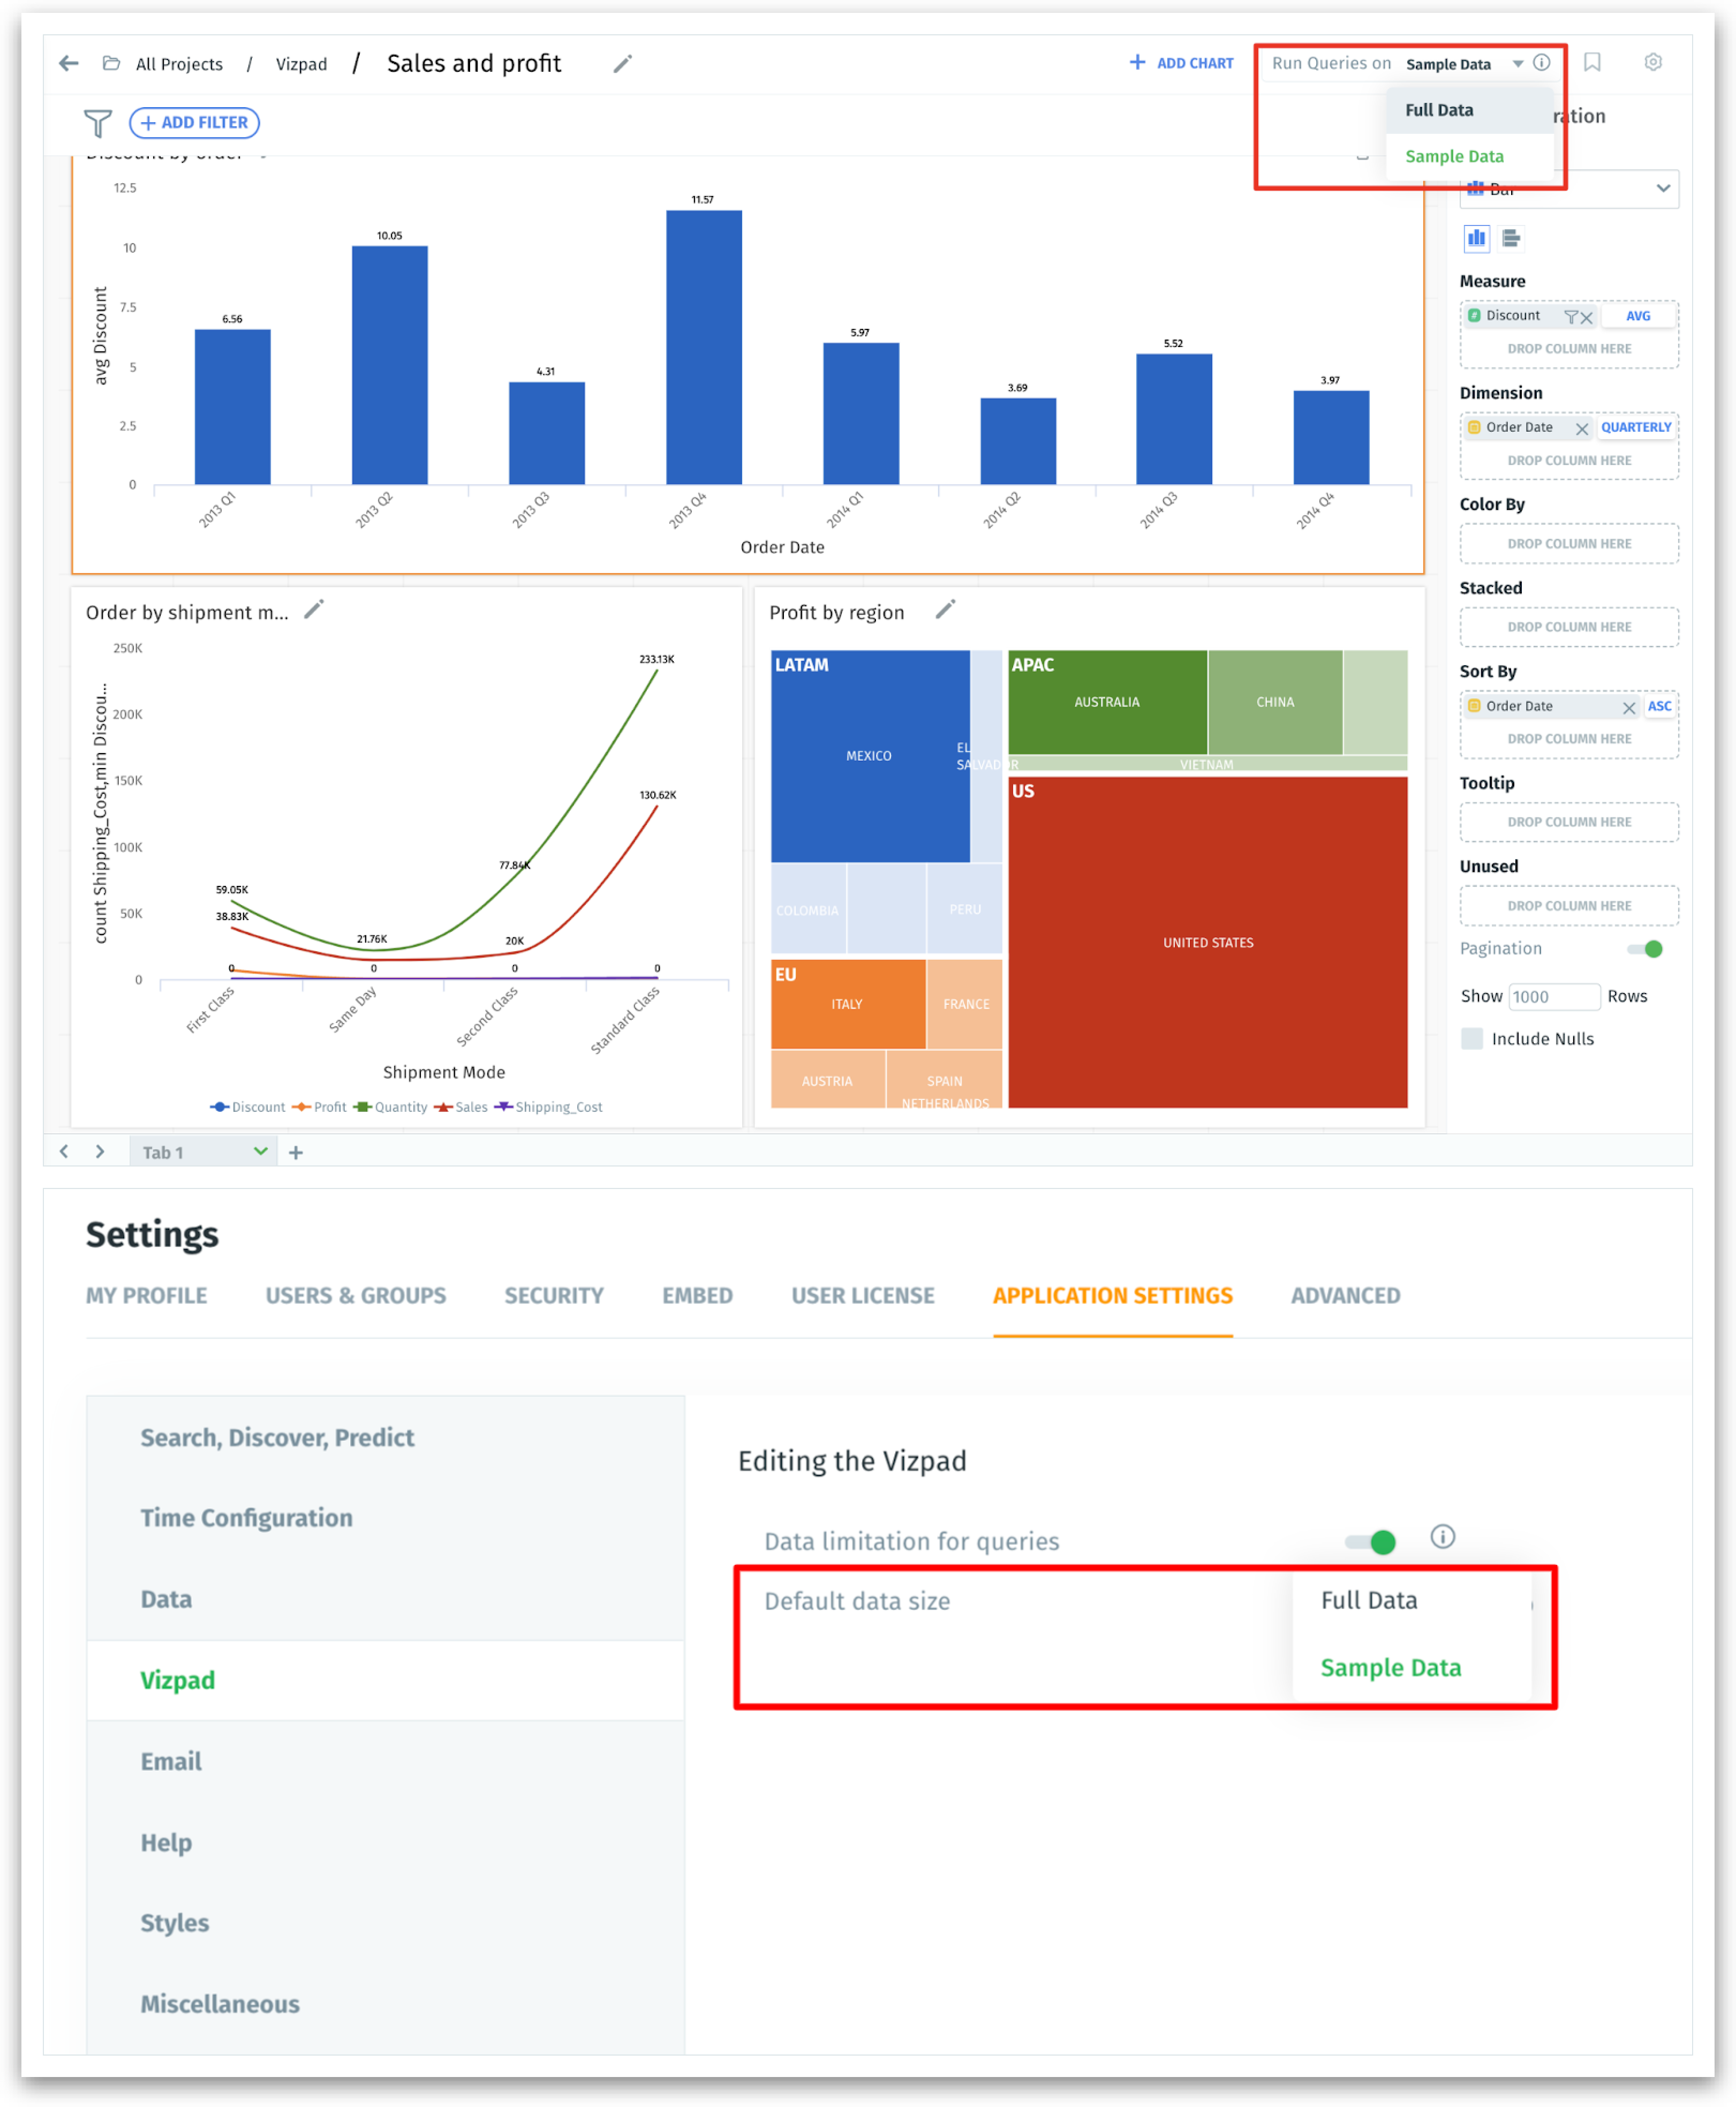
Processing of queries on sample data
Usually, when users create a chart in Vizpad, the results will be rendered for the entire dataset. To avoid the time-consuming overhead of processing large datasets, Tellius introduces a way to run the queries on a limited dataset (sample data). The feature helps save time and makes the overall Vizpad building process more efficient. In the Settings page, admins can enable/disable the option to run the queries on sample data.
Multi-user subscription to Feed
Since only the creator of the Feed receives email alerts, Tellius introduces a way for anyone interested in the Feed to subscribe to get regular email alerts. To avoid duplication of Feeds, a new Feed will be created only after checking for any similar Feed. The user can either subscribe to the existing Feed to receive periodic updates or create a new Feed.
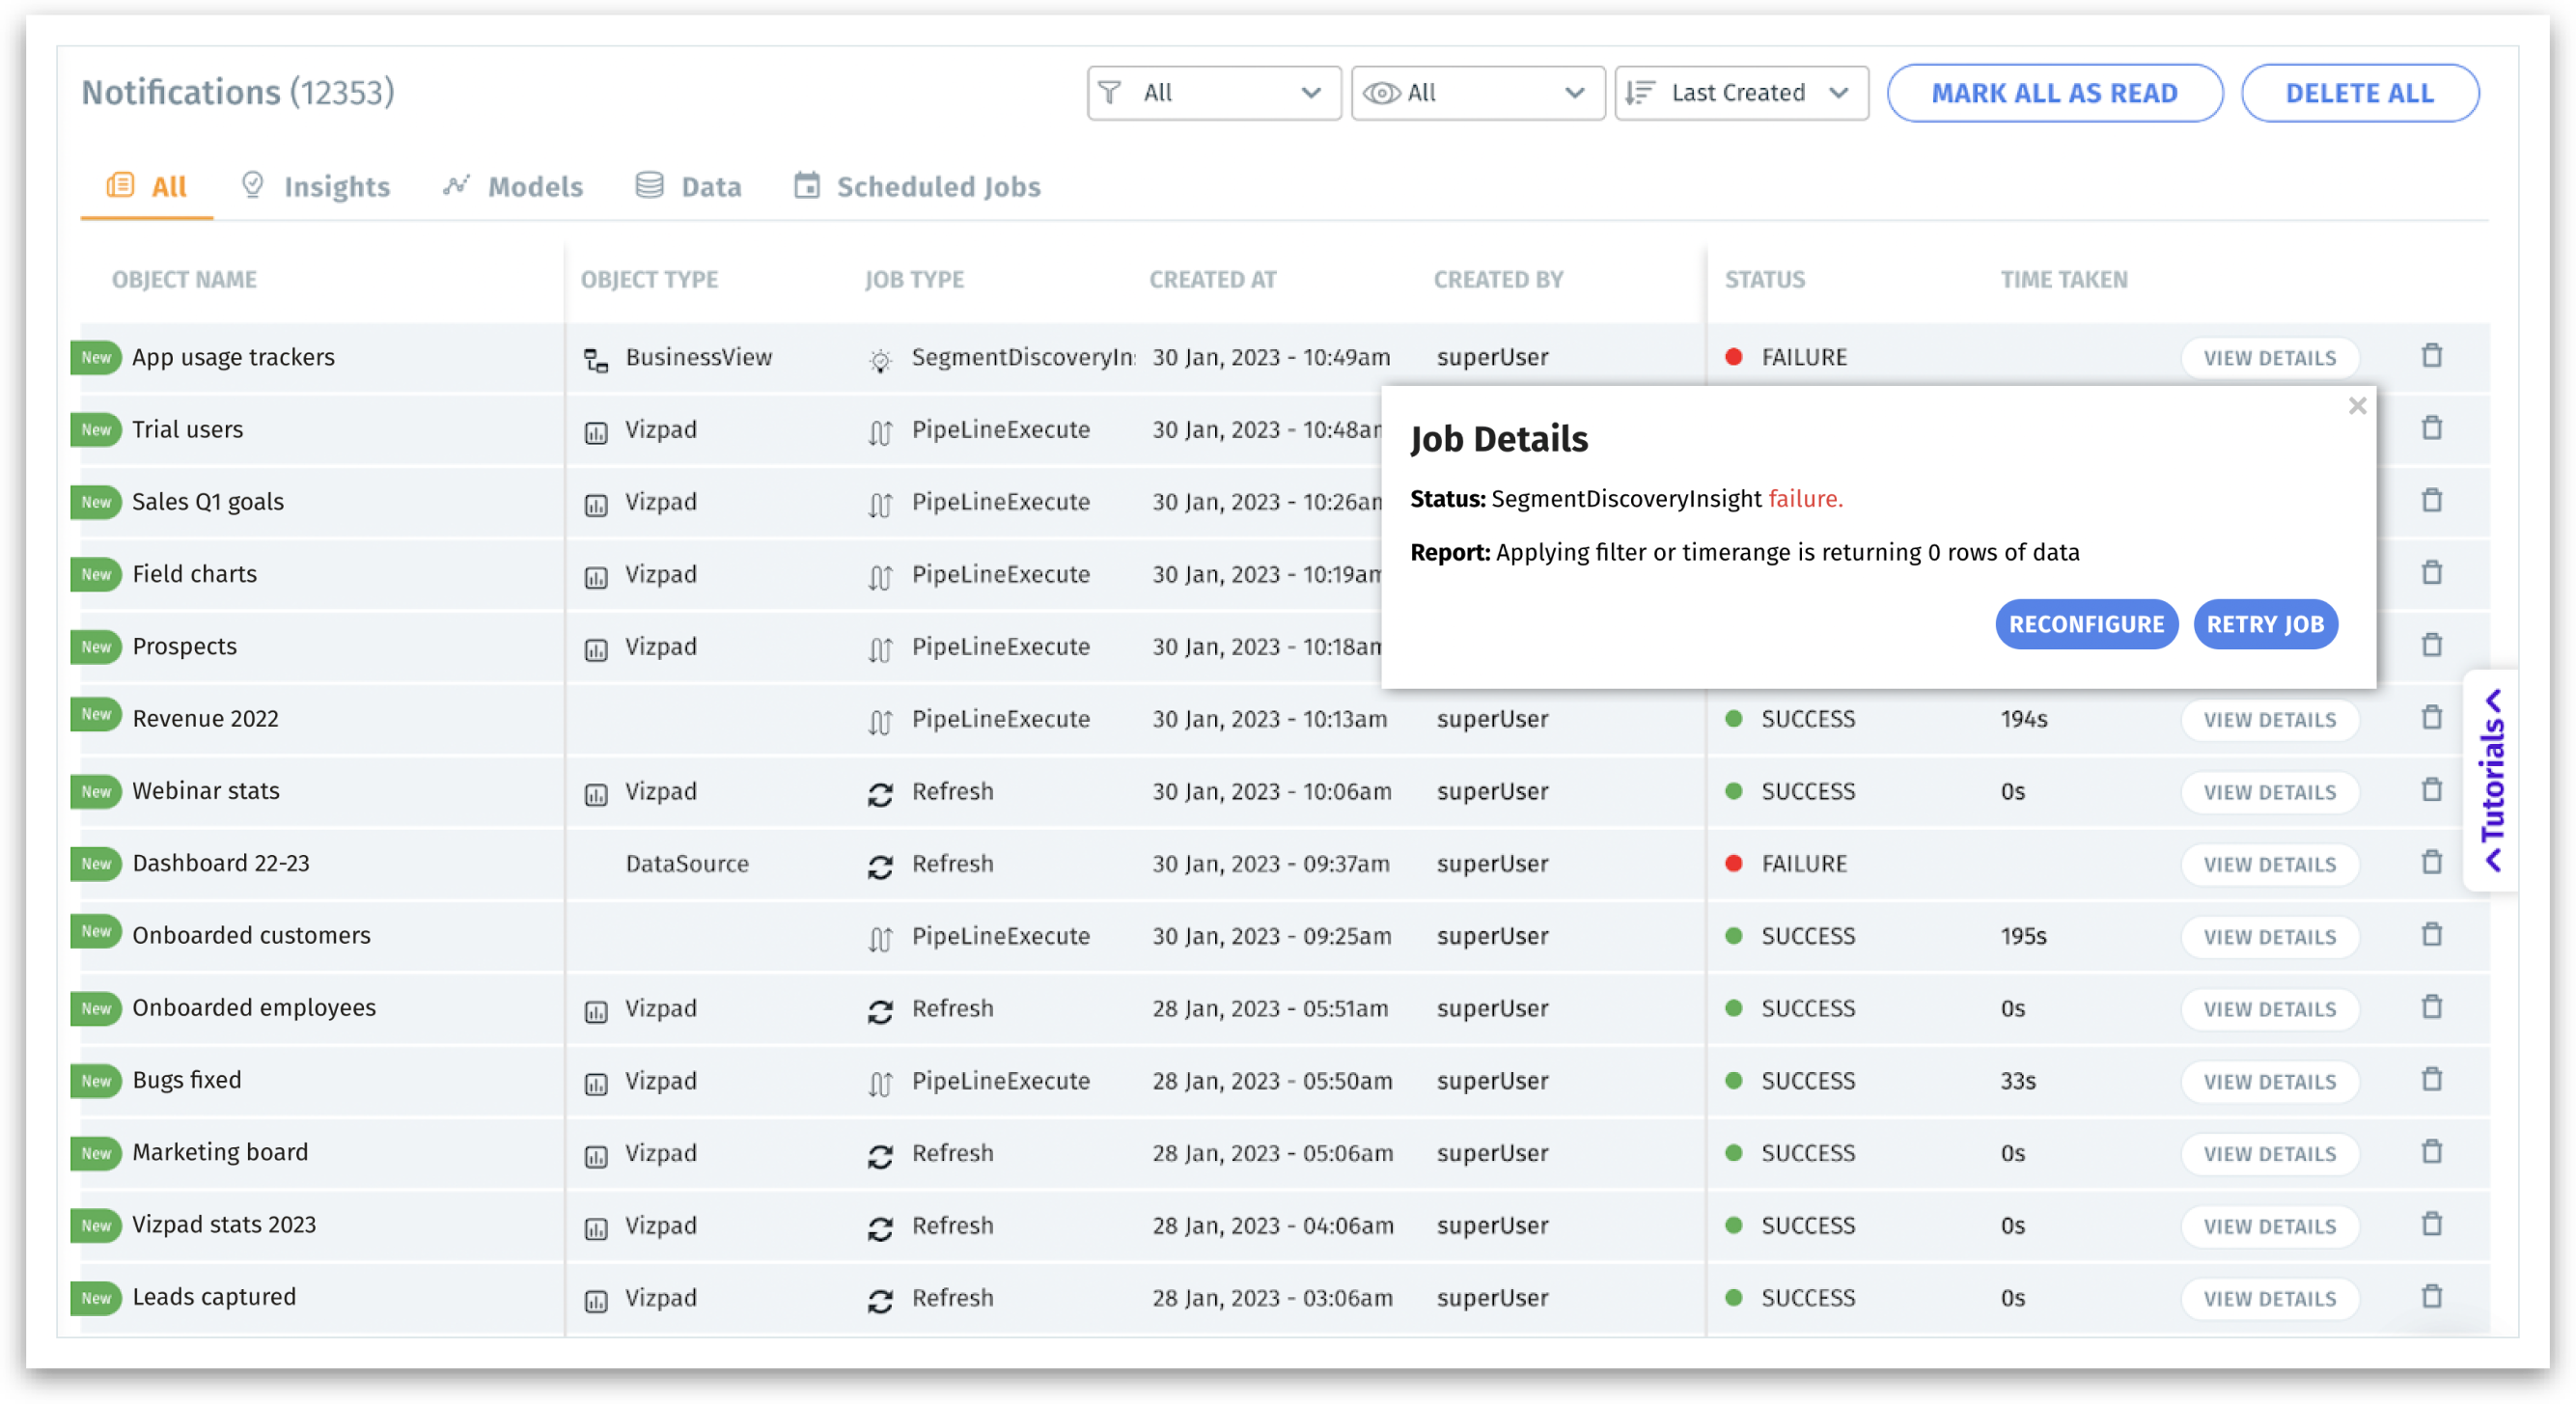
Additional metadata on the Notifications page
The Notifications page now displays the metadata (name, type) of every object associated with a job. The metadata enables the user to correlate the type of an executed job with an actual object. If required, users can choose to retry specific failed jobs.
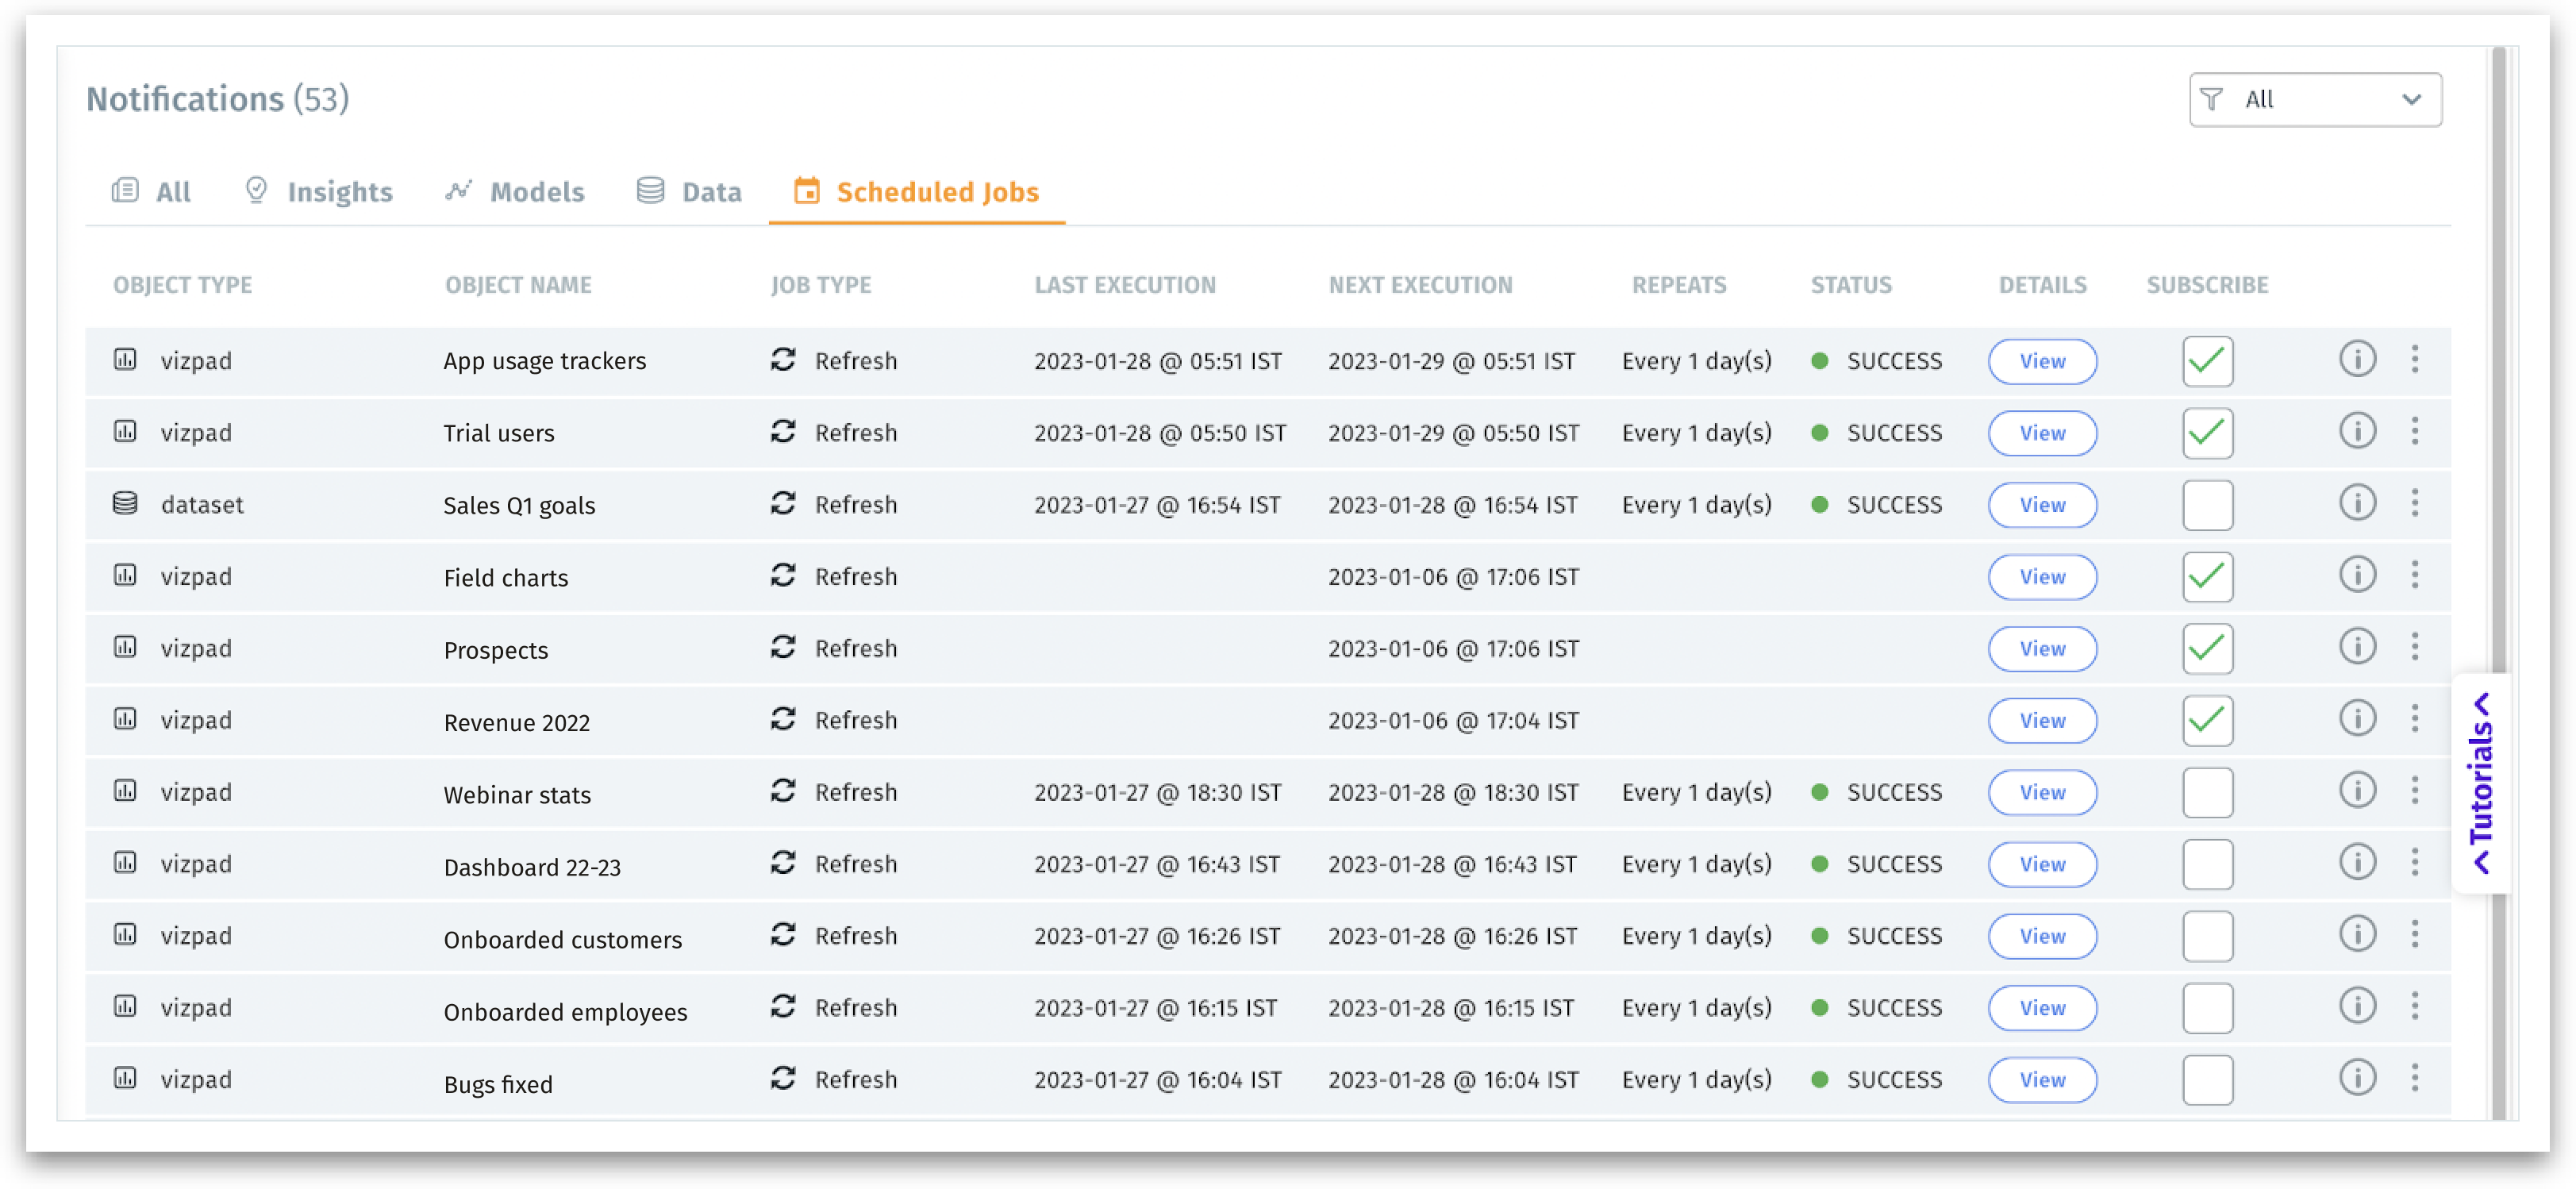
Subscription to scheduled jobs
A new tab has been added to display all the scheduled jobs associated with objects accessible to a user. Users can subscribe to the required jobs to receive regular email notifications. It provides a way to monitor the status (success/failure) of the job and stay informed of the objects shared with them.
Kerberos-based authentication for Spark SQL
Now, users can access Spark SQL tables via Kerberos. In addition to authenticating via username and password, the Spark SQL connector supports Kerberos-based authentication.
📈 Enhancements
Display of columns in Search and Tellius Assistant
To enhance the search experience and help users be more informed of the columns in a business view, the following improvements have been added:
- Search - When a search query is being typed, the columns present in the corresponding business view will be displayed in the right pane, organized under Group View and Table View. Once a query is successfully executed, the same details will be pinned next to the Search Inspector.
- Tellius Assistant - Once a business view is selected, the columns will be displayed in the right pane.
Users can show/hide the business view details as required.
‘Weekly’ aggregation enhancements for date filters
In a Vizpad chart, when users choose a date column with ‘weekly’ aggregation as the dimension, the following improvements will be applicable:
- The actual weekend dates will be displayed in the chart instead of weekend numbers.
- A toggle option has been included in the Application Settings to set weekend dates as default when date filters are applied.
Additional treemap algorithms
In a Vizpad chart, users can change the treemap algorithm to represent hierarchical data. Tellius now supports all four algorithms by Highcharts:
- Slice and Dice (applied by default)
- Squarified
- Stripes
- Strip
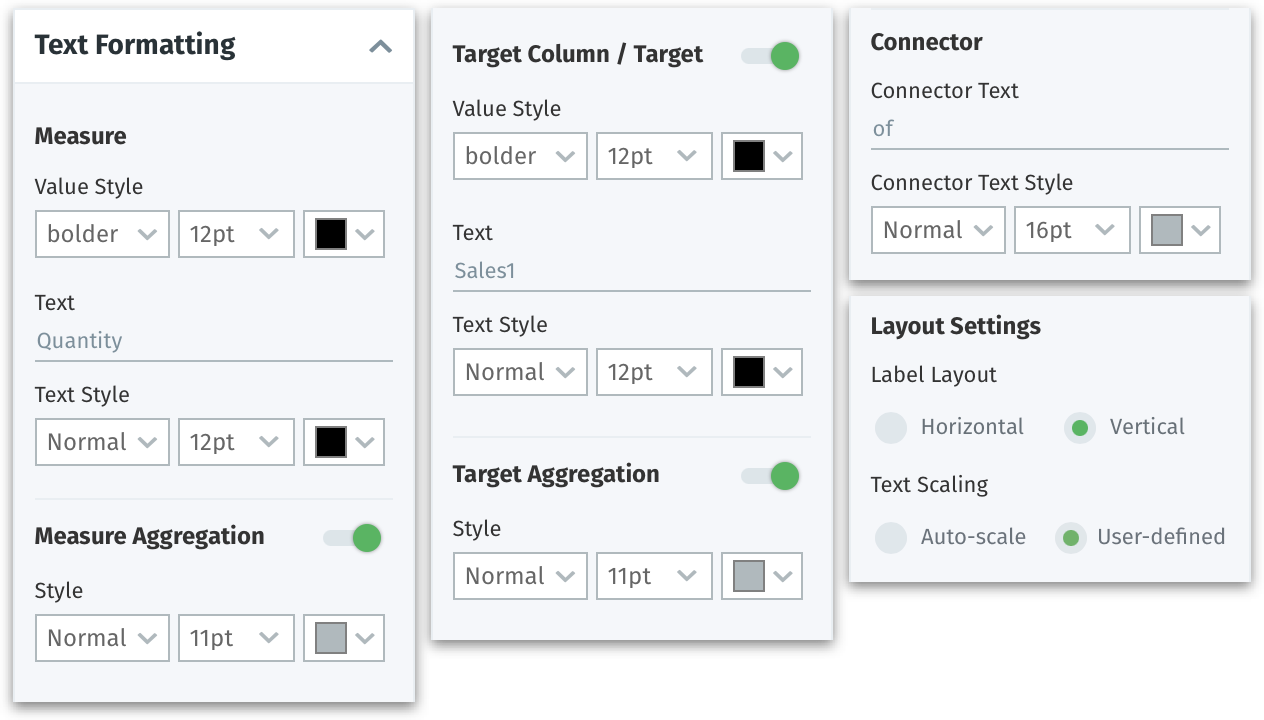
Enriched KPI target chart
To enhance the KPI target chart’s readability, we’ve introduced a way to easily customize and format the font size, font color and style of the following:
- Measure (title and values) and aggregation
- Target columns (title and values)
- Connector text (such as ‘of’)
Users have the flexibility to customize the font size displayed in KPI and KPI target charts using the following two options:
- Auto-scale - Tellius chooses a responsive sizing based on the size of the chart and length of the text
- User-defined - The font size set by the user will be considered.
Users can also show/hide aggregation, connector text, and target columns. The text in the chart can be aligned horizontally/vertically and arranged relative/fixed as required.
Vizpads generation on intranet
Tellius has introduced a way to improve the user adoption of Vizpads when they are connected to an on-premises network. Vizpads can be opened seamlessly from scheduled emails when users are logged in to Tellius without an outbound internet connection. The required URLs to be configured are included in Settings to support the rendering of Vizpads and to prevent timeout errors:
Feature importance of columns
A new tab Feature Importance has been added to display the importance of each column. Once a model has been created using XGBoost or regression algorithm, the feature importance would be displayed in percentages as a part of the Model summary.
Share objects using name
Across Tellius, users can now share an object (Vizpad, chart, Insight, Model) by typing in the user’s first name or last name. The email IDs associated with the names would be automatically displayed for more clarity.
Data type of cluster labels
Once clustering is done, the cluster labels will be created with the data type: dimensions (String) instead of measures (numeric) so as to enable users to categorize and visualize data in different charts.
Proxy support for connectors
Tellius now supports proxy configuration to connect with Salesforce and Google Analytics. Users can avail of the optional proxy support to seamlessly load the datasets.
Forbidden Python libraries
The following libraries have been removed and thus cannot be imported into Python during data preparation.
- shlex
- sh
- plumbum
- pexpect
- fabric
- envoy
- commands
- os
- subprocess
- requests
🛠️ Minor fixes
- The Vizpad rendering, loading, and performance issues (side panel, tooltip, CSS, Anomalies, garbage collection) have been fixed and optimized.
- The switching between different tabs in a Vizpad has been made seamless, with the warning message displayed only when any changes are made to the current tab.
- HTML tags included in the Search queries will be sanitized and rejected with an “Invalid query” error.
- For bar, line, and combo charts, data will not be plotted for null values unless “Include null values” is selected by the user.
- The default aggregation set for a column (measure) during data preparation will be reflected across the platform unless modified by the user.
- Conditional formatting and number formatting capabilities have been fixed for KPI charts.
- The visibility of data labels for the waterfall charts has been rectified.
- The dataset renaming issue for DataFusion has been fixed.
- Filtering of high cardinality columns using a Vizpad list has been fixed.
- The date format displayed in the downloaded Vizpad charts (in CSV format) has been rectified.
- The timeout limit for the generation of multiple reports on Vizpad has been increased.
- The gaps in email settings and SMTP configurations have been fixed now.
⛔ Deprecation
In the upcoming release 4.2, connecting directly to BigQuery data tables via GCS bucket feature will be deprecated.